당사 팬 페이지에 가입하십시오

wd.Multi_LineMA - MetaTrader 5용 지표

- 조회수:
- 112
- 평가:
- 게시됨:
- 업데이트됨:
-
 이 코드를 기반으로 한 로봇이나 지표가 필요하신가요? 프리랜스로 주문하세요
프리랜스로 이동
이 코드를 기반으로 한 로봇이나 지표가 필요하신가요? 프리랜스로 주문하세요
프리랜스로 이동
MT5 사용자 지정 인디케이터인 "wd.Multi_LineMA.mq5"는 트레이더에게 더 긴 차트주기(MTF 다중 차트주기)의 이동평균값에 대한 귀중한 통찰력을 제공하도록 설계되었습니다. 여기에는 지정된 수의 막대 및 동적 MA 수평 가격선에 대한 트레일을 볼 수 있는 기능 등 심층 분석을 위한 추가 시각적 기능이 포함되어 있습니다.
인디케이터의 작동 방식은 다음과 같습니다:
MTF 다중 시간대 이동 평균:
이 지표는 기간, 방법, 적용 가격 등 사용자가 정의한 매개변수를 기준으로 이동 평균을 계산합니다. 현재 주기가 지정된 상위 주기보다 낮으면 상위 주기에서 이동평균 값을 가져와 현재 차트에 표시합니다. 반대로 현재 기간이 지정한 기간보다 높으면 낮은 기간의 이동평균 값을 표시하지 않고 제한된 낮은 TF 플롯을 표시하거나 현재 차트에서 낮은 TF 값을 숨깁니다.
이동평균 트레일:
이동평균 트레일이 있는 이 인디케이터는 속성에서 값을 변경하여 특정 수의 막대에 대한 트레일 길이를 조정할 수 있습니다.
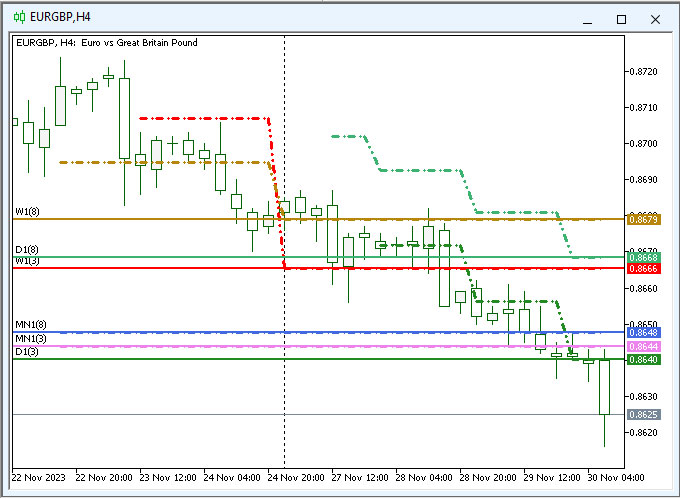
수평 가격선:
이동평균의 마지막 값을 기준으로 동적으로 움직이는 수평 가격선을 통합한 인디케이터입니다. 이 선은 현재 입찰 가격 수준에서 생성된 이동 평균에 해당하며 이동 평균 값이 변경될 때마다 실시간으로 업데이트됩니다.
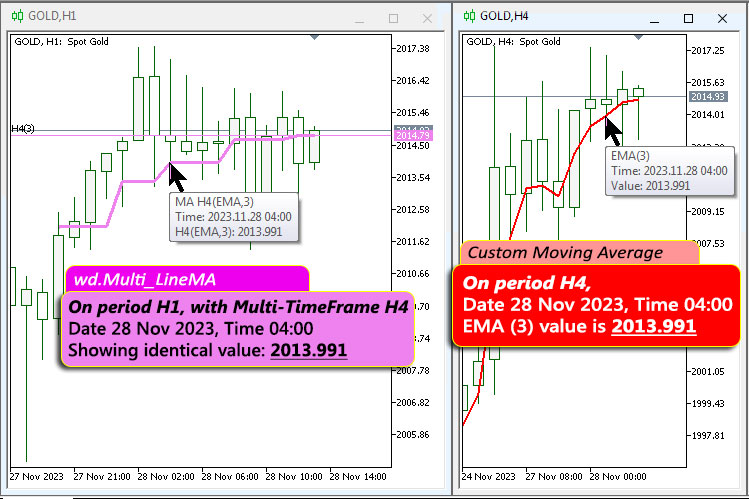
MTF 다중 시간대 이동 평균은 실시간 값을 기준으로 계산됩니다. 예를 들어, '사용자 지정 이동평균'(메타트레이더 5 내장 인디케이터)을 사용하여 H4, 날짜 2023년 11월 28일, 시간 04:00의 금에서 2013.991의 값을 표시합니다. 마찬가지로 'wd.Multi_LineMA'를 사용하면 현재 차트 기간이 다른 경우에도 동일한 값인 2013.991을 반영합니다.
이동평균선은 차트를 선으로 어지럽히지 않고 과거 움직임을 관찰하는 데 유용합니다. 수평 가격선은 가격 가시성을 높이고 사용자가 지지선과 저항선을 결정하는 데 도움을 줍니다. 차트에서 이동평균의 현재 수준을 시각화하는 기준점 역할을 합니다.
전반적으로 이 인디케이터는 필요한 매개 변수를 효율적으로 구성하고, 다중 시간대 이동 평균을 초기화하고, 수평 가격선을 지속적으로 업데이트하며, 시간대 간 관계에 따라 MA 트레일 표시를 관리합니다. 가장 큰 장점은 사용자가 MA를 기반으로 저항-지지선을 몇 초 만에 빠르고 효과적으로 식별할 수 있다는 것입니다.
MetaQuotes Ltd에서 영어로 번역함.
원본 코드: https://www.mql5.com/en/code/47513
 Uniformity Factor Script
The script provides a quick estimation of an exponent/power factor for transformation of variable-length price increments into uniform distibution, that makes them a "random walk". The estimated value characterizes current symbol as more profitable when using in a particular trading strategy.
 MT5 Telegram Trade Notifier (Bot API) — Deal Alerts
Utility MT5 EA that sends BUY/SELL deal notifications to Telegram via Bot API (WebRequest)