Fan sayfamıza katılın

wd.Multi_LineMA - MetaTrader 5 için gösterge

- Görüntülemeler:
- 133
- Derecelendirme:
- Yayınlandı:
- Güncellendi:
-
 Alım-satım fırsatlarını kaçırıyorsunuz:
- Ücretsiz alım-satım uygulamaları
- İşlem kopyalama için 8.000'den fazla sinyal
- Finansal piyasaları keşfetmek için ekonomik haberler
Kayıt Giriş yapWeb sitesi politikasını ve kullanım şartlarını kabul edersiniz
Hesabınız yoksa, lütfen kaydolun -
 Bu koda dayalı bir robota veya göstergeye mi ihtiyacınız var? Freelance üzerinden sipariş edin
Freelance'e git
Bu koda dayalı bir robota veya göstergeye mi ihtiyacınız var? Freelance üzerinden sipariş edin
Freelance'e git
"wd.Multi_LineMA.mq5" adlı MT5 özel göstergesi, yatırımcılara daha yüksek bir zaman diliminden (MTF Multi TimeFrame) Hareketli Ortalama değerleri hakkında değerli bilgiler sunmak üzere tasarlanmıştır. Belirli sayıda çubuk için izleri görüntüleme yeteneği ve dinamik bir MA yatay fiyat çizgisi gibi derinlemesine analiz için ek görsel özellikleri kapsar.
Göstergenin nasıl çalıştığı aşağıda açıklanmıştır:
MTF Multi-Timeframe Moving Average:
Gösterge, dönem, yöntem ve uygulanan fiyat gibi kullanıcı tanımlı parametrelere dayalı olarak bir Hareketli Ortalama hesaplar. Geçerli zaman dilimi belirtilen daha yüksek zaman diliminden daha düşükse, daha yüksek zaman diliminden Hareketli Ortalama değerlerini alır ve bunları geçerli grafikte görüntüler. Tersine, mevcut zaman dilimi belirtilenden yüksekse, daha düşük zaman dilimi Hareketli Ortalama değerlerini görüntülemekten kaçınır, sınırlı bir lowerTF grafiği göstermeyi veya mevcut grafikte lowerTF değerlerini gizlemeyi tercih eder.
Hareketli Ortalama İzi:
Hareketli Ortalama izine sahip olan gösterge, kullanıcıların özelliklerdeki değeri değiştirerek belirli sayıda çubuk için iz uzunluğunu ayarlamasına olanak tanır.
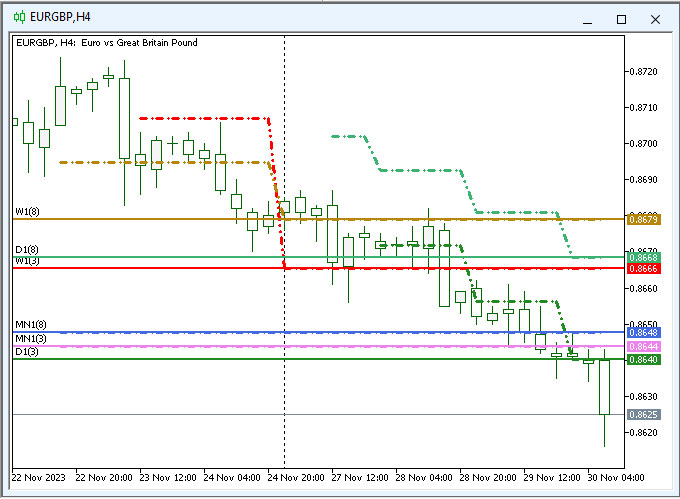
Yatay Fiyat Çizgisi:
Gösterge, Hareketli Ortalamanın son değerine göre dinamik olarak hareket eden bir Yatay Fiyat Çizgisi içerir. Bu çizgi, mevcut teklif fiyatı seviyesinde oluşturulan Hareketli Ortalamaya karşılık gelir ve Hareketli Ortalama değeri değiştikçe her tıklamayla gerçek zamanlı olarak güncellenir.
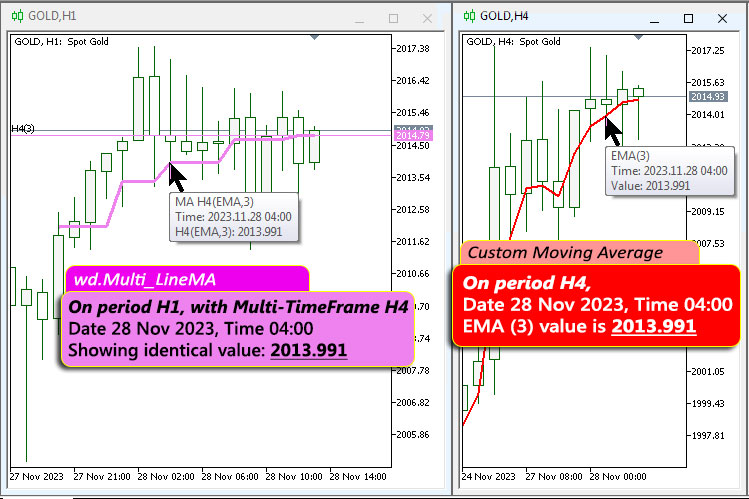
MTF Multi-Timeframe Hareketli Ortalama, gerçek zamanlı değerlere göre hesaplanır. Örneğin, H4'te Altın üzerinde, Tarih 28 Kasım 2023, Saat: 04:00, 'Özel Hareketli Ortalama' (MetaTrader 5 yerleşik göstergesi) kullanılarak 2013.991 değerini gösterir. Benzer şekilde, 'wd.Multi_LineMA' kullanıldığında, mevcut grafik dönemi farklı olsa bile aynı 2013.991 değerini yansıtır.
Hareketli Ortalama İzi, grafiği çizgilerle karıştırmadan tarihsel hareketi gözlemlemek için kullanışlıdır. Yatay Fiyat Çizgisi fiyat görünürlüğünü kolaylaştırır ve kullanıcıların destek ve direnç çizgilerini belirlemelerine yardımcı olur. Grafikteki Hareketli Ortalamanın mevcut seviyesini görselleştirmek için bir referans noktası görevi görür.
Genel olarak, gösterge gerekli parametreleri verimli bir şekilde yapılandırır, Çok Zaman Dilimli Hareketli Ortalamayı başlatır, Yatay Fiyat Çizgisini sürekli olarak günceller ve zaman dilimleri arasındaki ilişkiye dayalı olarak MA izlerinin görüntülenmesini yönetir. En önemli avantajı, kullanıcıların saniyeler içinde MA'ya dayalı direnç-destek çizgilerini hızlı ve etkili bir şekilde tanımlamalarını sağlamaktır.
MetaQuotes Ltd tarafından İngilizceden çevrilmiştir.
Orijinal kod: https://www.mql5.com/en/code/47513
Engulfing bar with rsi
Rsi seviyelerinin altında veya üstünde yutan çubukta uyarılar
CCIT3_noReCalc
Değiştirilmiş CCIT3_Simple.
 Uniformity Factor Script
The script provides a quick estimation of an exponent/power factor for transformation of variable-length price increments into uniform distibution, that makes them a "random walk". The estimated value characterizes current symbol as more profitable when using in a particular trading strategy.
 MT5 Telegram Trade Notifier (Bot API) — Deal Alerts
Utility MT5 EA that sends BUY/SELL deal notifications to Telegram via Bot API (WebRequest)