Join our fan page
- Published by:
- Nikolay Kositsin
- Views:
- 11490
- Rating:
- Published:
- Updated:
-
Need a robot or indicator based on this code? Order it on Freelance Go to Freelance
Real author:
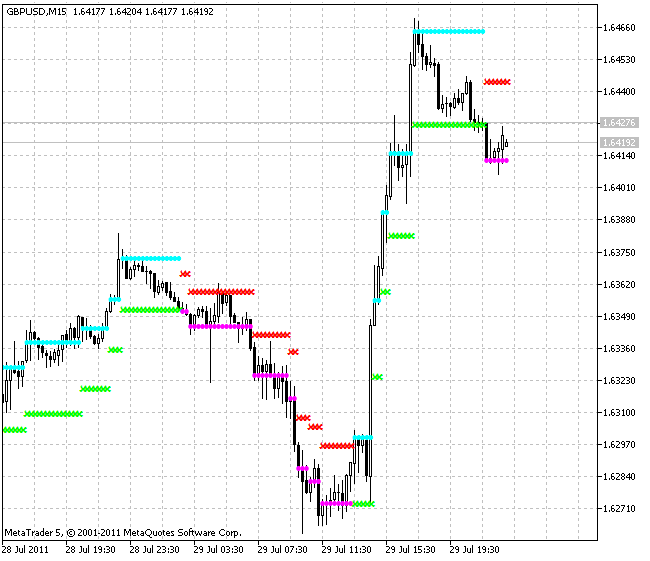
This indicator marks its values depending on the current trend.
In case of a downward trend, the indicator is colored red and magenta. In case of an upward trend, it is colored lime and aqua. When prices are rising, the level where crosses are set is a support line. When prices are falling they represent a resistance line. Similarly, aqua points show resistance levels when prices go up, while magenta ones show support levels during a downward trend.
MQL4 version of this indicator was published in CodeBase at mql4.com 02.11.2007.

Translated from Russian by MetaQuotes Ltd.
Original code: https://www.mql5.com/ru/code/428
 ColorMACD
Histograma MACD colorido com a linha de sinal que muda de cor de acordo com a direção da tendência.
 Center of Gravity J. F. Ehlers
Center of gravity is the oscillator developed by John Ehlers and presented in the "Stocks & Commodities" magazine (May, 2002).
 FATL
FATL
Fast Adaptive Trend Line (FATL) is based on the low frequency digital filter.
 FractalChannel_v1
The indicator shows the channel based on fractals.