Join our fan page
- Views:
- 9473
- Rating:
- Published:
-
Need a robot or indicator based on this code? Order it on Freelance Go to Freelance

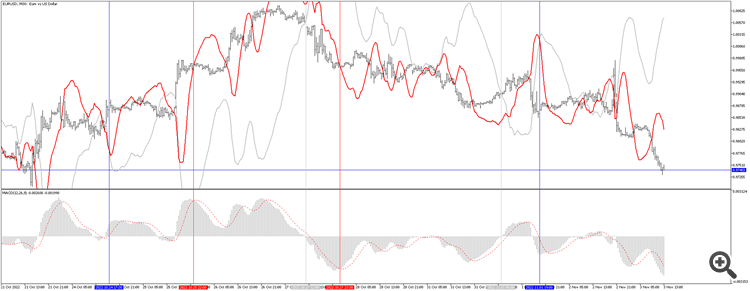
You can see how MACD works on main price chart.
Equivalency #1:
MACD oscillator: MACD line crosses the Signal line.
MACD_CW: Indicator Red line crosses the price bar.
Example in Fig.: Red vertical lines.
Equivalency #2:
MACD oscillator: MACD line crosses Zero.
MACD_CW: Indicator Silver line crosses the price bar.
Example in Fig.: Silver vertical lines.
Equivalency #3:
MACD oscillator: Signal line crosses Zero.
MACD_CW: Indicator Red line crosses Indicator Silver line.
Example in Fig.: Blue vertical lines.
 CSV Exporter
Automatically export csv file
 The Restoring Pull Indicator
The Restoring Pull Indicator was created by John Ehlers (Stocks & Commodities V.11:10 (395-400))
 Nadaraya Watson Envelope
This tool outlines extremes made by the prices within the selected window size. This is achieved by estimating the underlying trend in the price using kernel smoothing, calculating the mean absolute deviations from it, and adding/subtracting it from the estimated underlying trend. Originally Made By LuxAlgo. Coded in MT5 format.
 ATR Stop Loss bands
Money-managing stop loss baseline indicator for MT5.