Join our fan page


- Views:
- 20501
- Rating:
- Published:
-
 You are missing trading opportunities:
- Free trading apps
- Over 8,000 signals for copying
- Economic news for exploring financial markets
Registration Log inYou agree to website policy and terms of use
If you do not have an account, please register -
 Need a robot or indicator based on this code? Order it on Freelance
Go to Freelance
Need a robot or indicator based on this code? Order it on Freelance
Go to Freelance
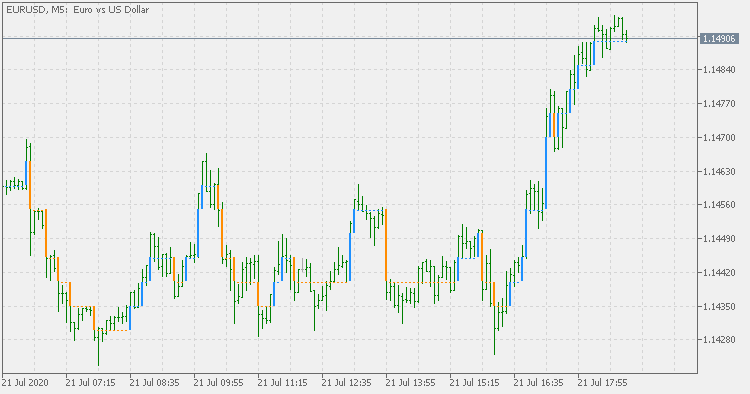
The original version : Step chart
Usage:- Step chart is displaying values as increments of step size
- Step size can be specified as fractional pips
- You can use any of the usual price types to display the chart
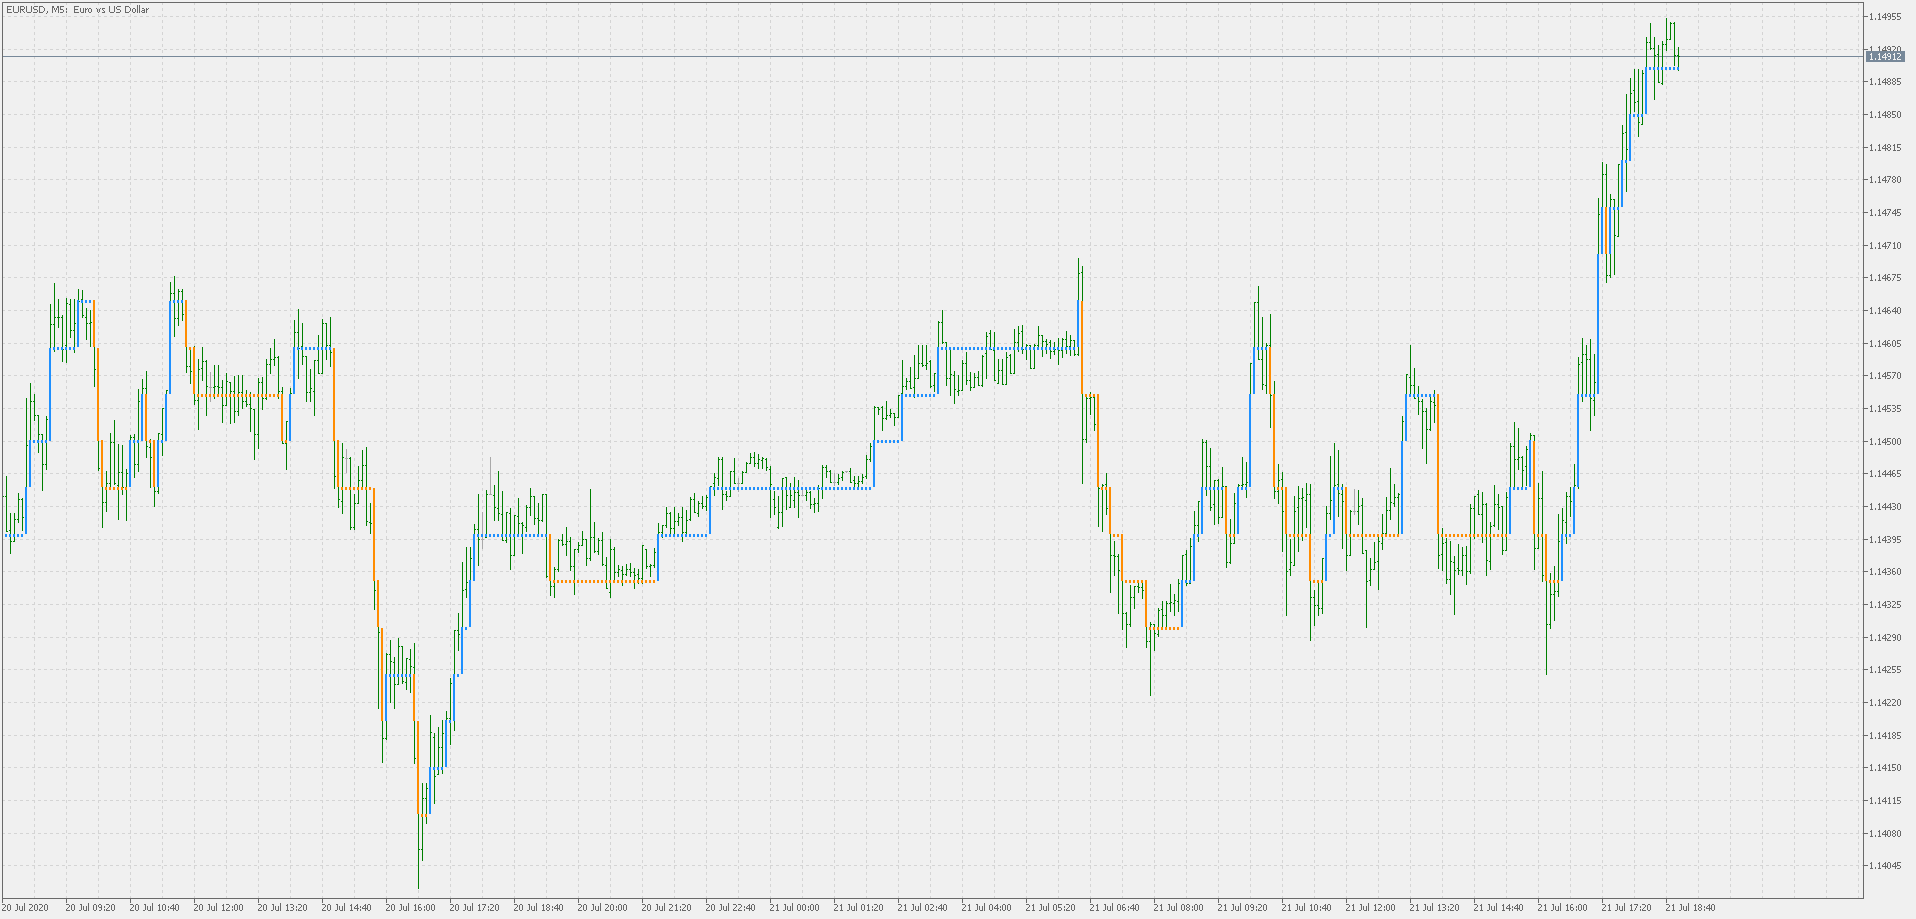
Reason for upgrade : making the code faster (never enough of execution speed) and simpler to use (iCustom() wise too)
 Identify potential Trends/Range (Pivot Points)
When I start learning about trading, I remember the trading pioneer Shawn Lucas (founder of Apiary-fund) saying "trading is simple, you go from bound range market to breakout market and vice versa". I looked at few charts and he was right. So I told myself, I have to always eyeball ranging market and trending market but with the help of an indicator. There are plenty for indicator that help us eyeball these ranging/trending market and they work really well, but I like using Pivot Points.
Open Random Charts
This script opens randomly selected charts and applies user-defined template.
 Design patterns - Builder
For a complex object separate its construction from representation. Same construction process can create different representations
 Range Follower
this expert opens trade in the direction of the trend when specific rate of average daily range has been passed.