Join our fan page

Daily Pivot, Resistance and Support Levels Assist - indicator for MetaTrader 4
- Views:
- 29718
- Rating:
- Published:
-
 You are missing trading opportunities:
- Free trading apps
- Over 8,000 signals for copying
- Economic news for exploring financial markets
Registration Log inYou agree to website policy and terms of use
If you do not have an account, please register -
 Need a robot or indicator based on this code? Order it on Freelance
Go to Freelance
Need a robot or indicator based on this code? Order it on Freelance
Go to Freelance
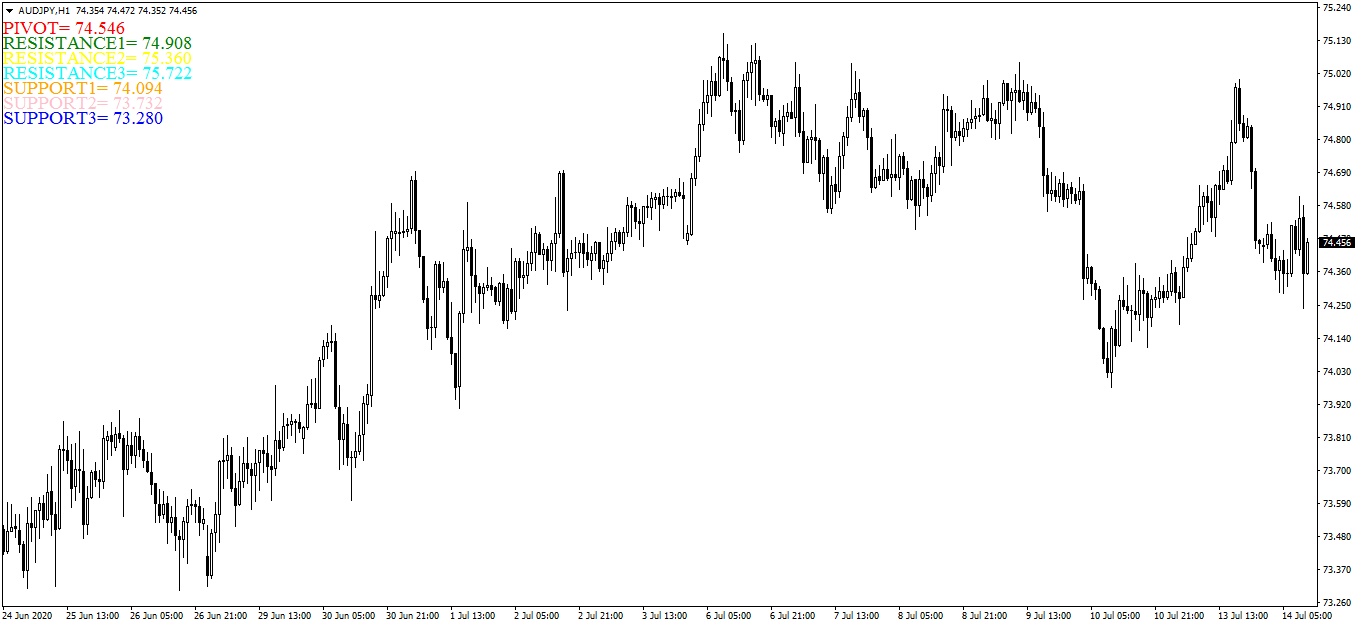
This is an indicator on Daily Pivot Points and Support and Resistance levels. It shows Pivot Point, Resistance1,Resistance2, Resistance3, and the corresponding Support level values in one of the Corners on the chart. whoever uses it can change the Corner where the values are displayed changing the BASE_CORNER variable in the Inputs tab.
This Indicator can be used for drawing Pivot Point,Resistance and Support Levels on the chart with vertical lines on the values shown. if the market is trading above the Pivot point, the market's sentiment is bullish and may find resistance levels. if the market is trading below the Pivot point, the market's sentiment is bearish and may go down to Support levels.
 Trade History Marker 1.10
Mark your historical trades in you mt4 with lines and arrows. You can load data from your history or load data from a csv file.
Pan PrizMA CD Phase Sin leverage 72
Calculates the phase and amplitude of the expected wave.
Power of AUD with average
Power of AUD indicator with average shows actual strength of currency AUD calculated of 7 pairs that contain AUD. Indicator can be used for strategies based on mean reversion and/or correlation. Included pairs: EUR AUD, GBP AUD, AUD USD, AUD CAD, AUD NZD, AUD JPY, AUD CHF.
Power of CAD with average
Power of CAD indicator shows actual strength of currency CAD calculated of 7 pairs that contain CAD. Indicator can be used for strategies based on mean reversion and/or correlation. Included pairs: USD CAD, AUD CAD, CAD JPY, EUR CAD, GBP CAD, NZD CAD, CAD CHF.