Watch how to download trading robots for free
Find us on Telegram!
Join our fan page
Join our fan page
You liked the script? Try it in the MetaTrader 5 terminal

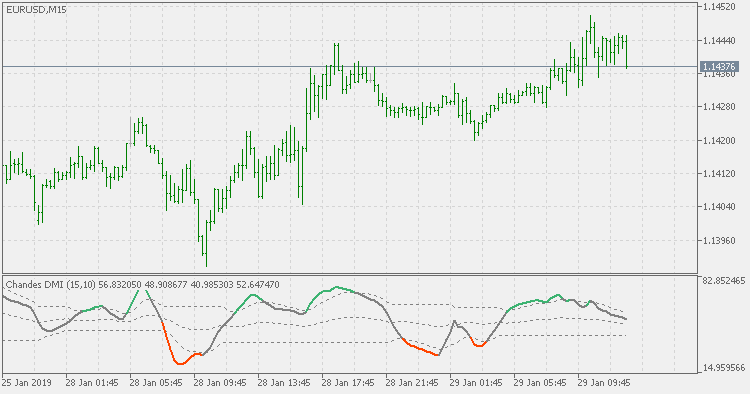
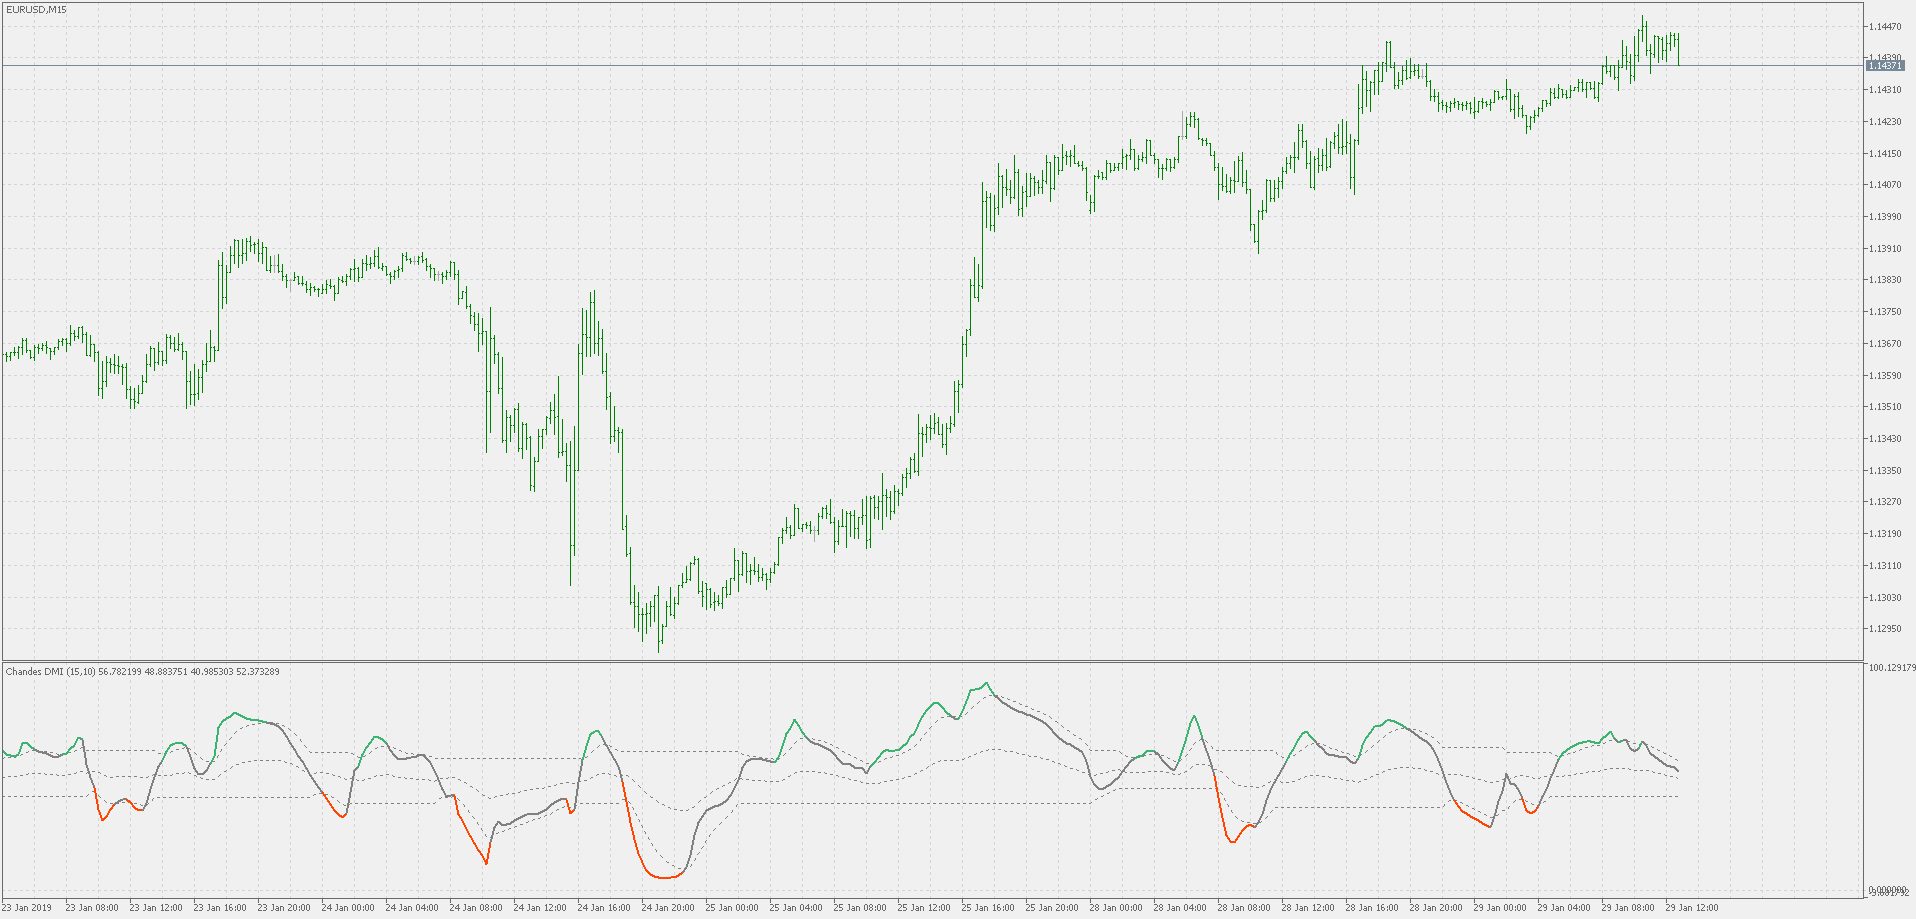
Chande's DMI - std adaptive with dsl signal lines - indicator for MetaTrader 5

- Views:
- 7265
- Rating:
- Published:
-
 You are missing trading opportunities:
- Free trading apps
- Over 8,000 signals for copying
- Economic news for exploring financial markets
Registration Log inYou agree to website policy and terms of use
If you do not have an account, please register -
 Need a robot or indicator based on this code? Order it on Freelance
Go to Freelance
Need a robot or indicator based on this code? Order it on Freelance
Go to Freelance
Theory :
Original definition of the Tushar Chande's and Stanley Kroll's DMI is the following :The dynamic momentum index is used in technical analysis to determine if a security is overbought or oversold. This indicator, developed by Tushar Chande and Stanley Kroll, is very similar to the relative strength index (RSI). The main difference between the two is that the RSI uses a fixed number of time periods (usually 14), while the dynamic momentum index uses different time periods as volatility changes, typically between five and 30.
This version is deviating from it in a number of ways :
- it is using RSX instead of RSI for calculation (thus producing a much smoother result)
- it is using standard deviation adapting to calculate that RSX
- it is adding discontinued signal lines instead of using fixed levels for OB/OS signal
Usage :
You can use color changes as signals. Color change can be one of the following :
- color change on slope change
- color change on outer dsl signal lines cross
- color change on middle dsl signal lines cross. the middle signal line is calculated as the average of upper and lower, which makes it a good new "zero" line (or 50 line in case of DMI)
Chande's DMI - std adaptive with floating levels
Chande's DMI - std adaptive with floating levels
Volatility ratio
Volatility ratio - standard deviations based