Join our fan page

- Views:
- 11238
- Rating:
- Published:
-
 You are missing trading opportunities:
- Free trading apps
- Over 8,000 signals for copying
- Economic news for exploring financial markets
Registration Log inYou agree to website policy and terms of use
If you do not have an account, please register -
 Need a robot or indicator based on this code? Order it on Freelance
Go to Freelance
Need a robot or indicator based on this code? Order it on Freelance
Go to Freelance
Theory :
As described by John Ehlers :
We could measure the fractal dimension of prices by covering the curve with a series of small boxes. This is burdensome task, but if we note that the price samples are uniformly spaced, we note that the box count is approximately the average slope of the curve. Therefore, we can estimate the box count as the highest price during an interval minus the lowest price during that interval , divided by the length of the interval itself. The equation for the number of boxes is then:
N1 = (HighestPrice – LowestPrice) / Length
We compute the fractal dimension by computing “N” over two equal intervals to get the averaging over each interval. Box1 covers the period from 0 to T bars ago. Box2 covers the period from T to 2T bars ago. Therefore, N1=(HighestPrice – LowestPrice) over the interval from 0 to T, divided by T. Similarly, N2=(HighestPrice – LowestPrice) over the interval from T to 2T, divided by T. We also define a N3 = (HighestPrice – LowestPrice) over the entire interval from 0 to 2 T , divided by 2T. Since we are looking backwards in time, the slope computation of the fractal dimension is D = (Log(N1+N2) + Log(n3)) / Log(2)
There are a few versions of frama already available for mt4 as well as for mt5. Some are Calculating correctly, but when it comes to mt5, they are probably too slow. Some are calculating incorrectly (giving a false impression that used period is really the calculating period). This version is doing both : it is calculating correctly and is doing it in a fast enough mode
As an addition, there is an option that does not exist in the original frama : the choice how to calculate the the highest high and lowest low. As usual;, some of Ehlers' explanations are vague. As it is obvious for the above description, the highest high and lowest low can be either "highest price" and "lowest price" - as it is described in the original definition - or it can be "highest high" and "lowest low", which is how, for some strange reason, Ehlers' decided to do the original code, even though he did not describe it that way. This version adds an option to do it either way.
When using the actual chosen price for highest high and lowest low for fractal estyimation, the indicator is much more responsive, and is much closer to what we should expect from used periods of calculations
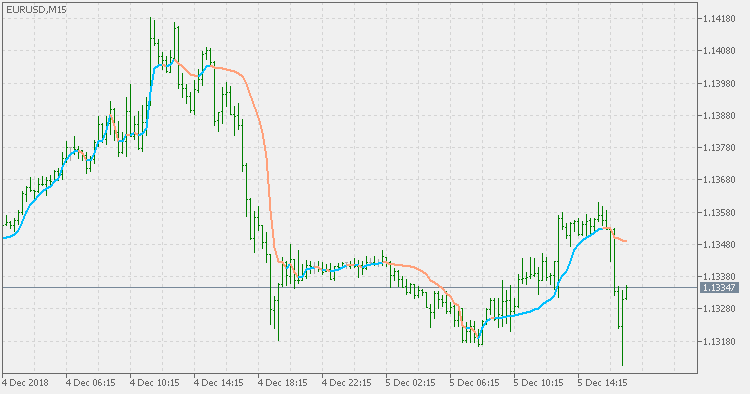
Usage :
It can be used the usual way (the way any average type indicator is used)
 Super smoother RSI
Super smoother RSI
Better Volume
Easy and visual way to check abnormal changes in Volume.
Frama - floating levels
Fractal Adaptive Moving Average with floating levels
Filtered frama
Fractal Adaptive Moving Average with value filter