Join our fan page

RSI adaptive EMA ribbon - indicator for MetaTrader 5

- Views:
- 7368
- Rating:
- Published:
- Updated:
-
 You are missing trading opportunities:
- Free trading apps
- Over 8,000 signals for copying
- Economic news for exploring financial markets
Registration Log inYou agree to website policy and terms of use
If you do not have an account, please register -
 Need a robot or indicator based on this code? Order it on Freelance
Go to Freelance
Need a robot or indicator based on this code? Order it on Freelance
Go to Freelance
The background :
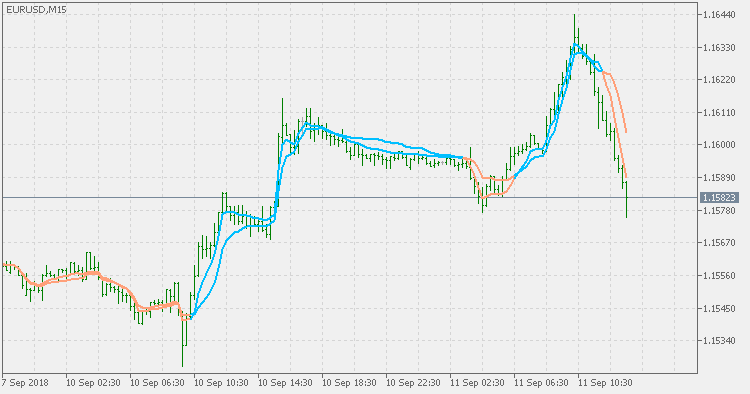
This indicator is using the RSI adaptive EMA (originally published here : RSI adaptive EMA) to assess the market condition. Even though it can be translated (and was done so) to a MACD, the on-chart representation of what is used for MACD calculation can help in easier spotting of possible trend changes
Of parameters :
Just the usual parameters : fast rsi period , slow rsi period and the price used. Take care that the fast is faster than the slow period - since then the results can be unpredictable (I did not add a code to check that - the assumption is that the user can do whatever she/he can do as a part of experimenting)
Usage :
Simple color change of the two values indicates a possible start of a new trend and can be used as a signal
RSI adaptive EMA - floating levels
RSI adaptive EMA - floating levels
Range Action Verification Index - extended
Range Action Verification Index - extended