Join our fan page

- Views:
- 75239
- Rating:
- Published:
- Updated:
-
 You are missing trading opportunities:
- Free trading apps
- Over 8,000 signals for copying
- Economic news for exploring financial markets
Registration Log inYou agree to website policy and terms of use
If you do not have an account, please register -
 Need a robot or indicator based on this code? Order it on Freelance
Go to Freelance
Need a robot or indicator based on this code? Order it on Freelance
Go to Freelance
Changes in version 6.0:
- Added second overbought/oversold level.
- Added new signal type: RSI2 crosses RSI1 (fast RSI crossed slow RSI).
- Histogram types were changed to: Histograms of RSI1 or histograms of MA1.
- Second MA (MA2) can be changed to: MA or RSI1 or MA of MA1.
Features
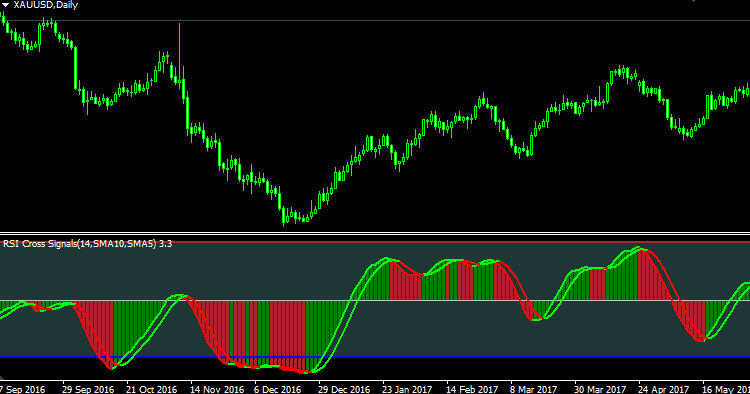
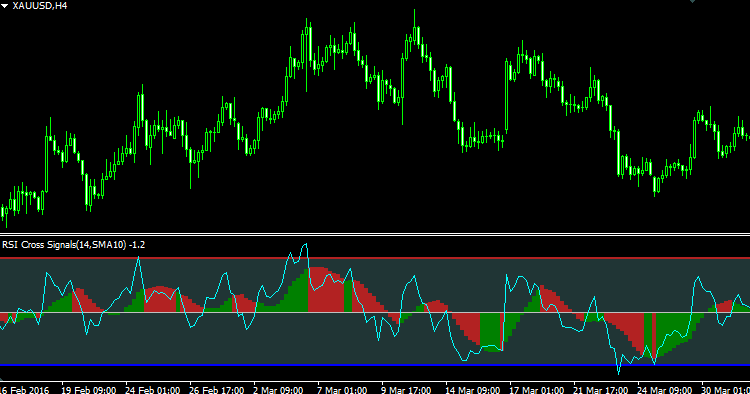
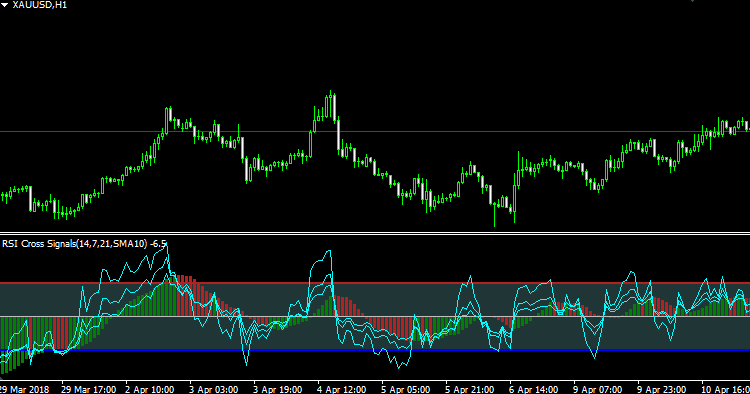
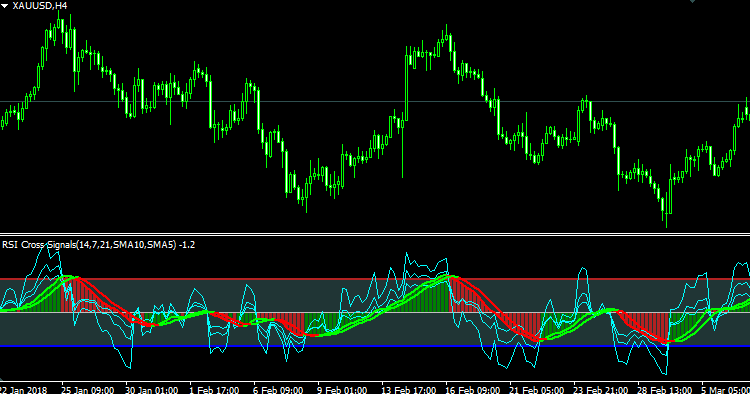
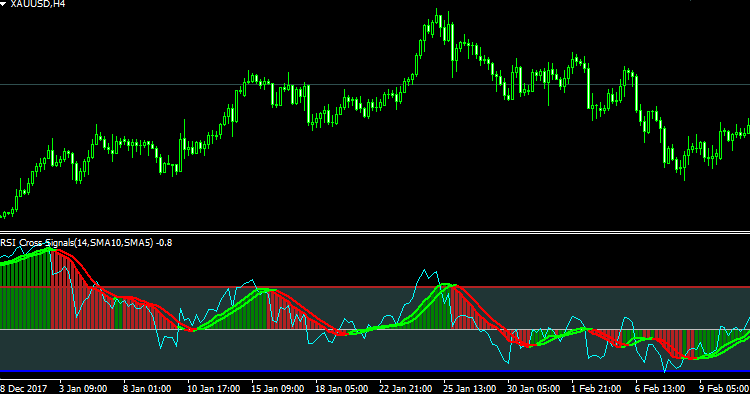
- Displays 3 RSI lines of different periods and the MA of the first RSI line (smoothed RSI).
- Displays the MA of the smoothed RSI. The crosses of smoothed RSI and its MA can be used as the signals.
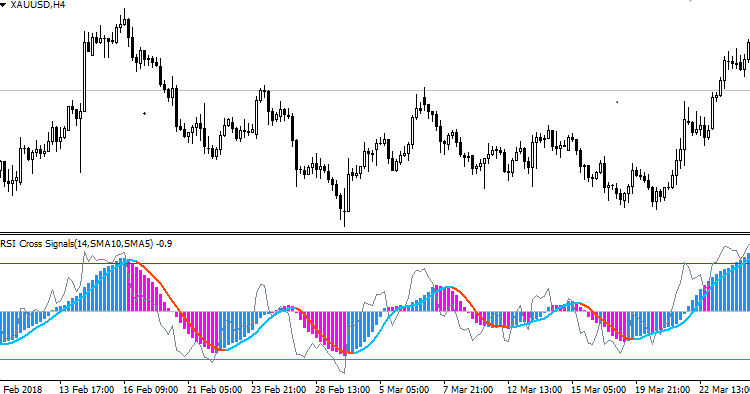
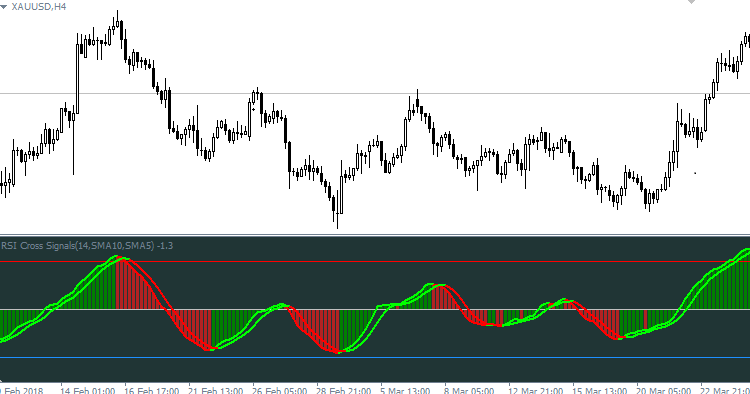
- Displays histogram for RSI or its Moving Average.
- Colored level lines.
- Two color MA lines.
- Four color histogram.
- Color filling between overbought and oversell levels (background).
- Users can turn off/on most of the features mentioned above.
About RSI value of this indicator
- The RSI value of this indicator = original RSI value - 50
- The overbought/oversell level = original overbought/oversell level - 50
This is to make RSI changes around 0 (not 50), which is convenient to draw histograms.
Users enter original overbought/oversell levels (70/30, or any other values), this indicator will change (subtract 50) automatically.
Parameters
- RSI 1 Period - Period of RSI #1. If input is less than 2 or larger than 100, indicator will use default (14) instead.
- RSI 2 Period - Period of RSI #2. If input is less than 2 or larger than 100, indicator will use default (21) instead.
- RSI 3 Period - Period of RSI #3. If input is less than 2 or larger than 100, indicator will use default (7) instead.
- Price Apply To - RSI price apply to
- Overbought Level - Overbought level (70, or any other levels you need)
- Oversell Level - Oversell level (30, or any other levels you need)
- Smooth Period - Enter the MA period for smoothing RSI #1
- Smooth Method - Choose MA method for smoothing RSI #1
- MA Period - Period of second MA (MA of smoothed RSI #1)
- MA Method - Method of second MA
- Enable RSI 1 Line - Turn on/off RSI #1 line
- Enable RSI 2 Line - Turn on/off RSI #2 line
- Enable RSI 3 Line - Turn on/off RSI #3 line
- Enable Smoothed RSI 1 - Turn on/off Smoothed RSI #1 line
- Enable MA of Smoothed RSI 1 - Turn on/off second MA (the MA of smoothed RSI #1)
- Choose How to Draw Histogram - Three options to draw histograms:
- Draw Histogram for RSI 1:
- Draw Histogram for Smoothed RSI 1
- Disable Histogram
- Choose How to Change Histogram Color - Two options about how the histogram colors change:
- As Per Smoothed RSI #1 Direction
- As Per RSI #1 and Smoothed RSI #1
Option 2 means: when RSI #1 crosses above the smoothed RSI, histogram will be green, which indicates a possible uptrend; when it crosses down smoothed RSI, histogram color will be red, which indicates a possible downtrend.
- Enable Background - If this option is enabled, indicator will draw histograms between Overbought level and Oversell level, as the background of "normal area".
- Background for Whole Indicator Window - If this option is enabled, the background histograms will be drawn from the top to bottom of the whole indicator window. This is available only if "Enable Background" option is turned on.


Note
The default color settings are fit for "Green and Black" theme in MetaTrader 4, if you use "Black and White" scheme, please change the colors to make it clear in white background.
 Hedging_Zone_Recovery_Area
This is my version of Zone Recovery Hedging Strategy Ea with two moving averages. It works on any time frame, you should try it on demo account.
 Start External Process
Script to start an external program.
 Hourly Pivot Points with Color Filling
Calculate Pivot Points based on H1 bar, according to normal formula and Fibonacci, with color filling.
Martingale Bone Crusher
This Martingale EA trades with one moving average, it is considered relatively safe because it takes a single trade at a time.