Join our fan page

- Views:
- 21224
- Rating:
- Published:
- Updated:
-
 You are missing trading opportunities:
- Free trading apps
- Over 8,000 signals for copying
- Economic news for exploring financial markets
Registration Log inYou agree to website policy and terms of use
If you do not have an account, please register -
 Need a robot or indicator based on this code? Order it on Freelance
Go to Freelance
Need a robot or indicator based on this code? Order it on Freelance
Go to Freelance
View current and historical trends of every timeframe in a single indicator window. The trend is determined by the two last moving averages of each timeframe; if the current moving average is above the previous moving average, the trend is bullish (green), otherwise, it is bearish (red). The default Moving Average period is set to 5, to identify short term trends.
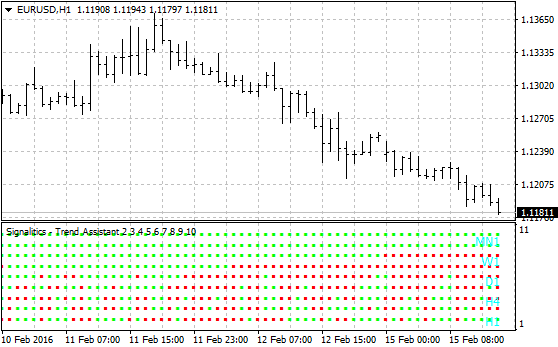
Recommendations:
- You can change the Moving Average configuration to fit your need.
 Kaufman's AMA from wellx
Non-optimized version of Kaufman's adaptive moving average.
3ColorMACD
Standard MACD diagram with bullish and bearish bars colored differently.
Simple Horizontal Grid
A round-number horizontal web with continuous auto-adjusting.
Dynamic Candle Timer
The indicator shows: the remaining time on each candle, the changing value of the Bid price, tick by tick, the relative price position of the Bid/Ask spread.