Join our fan page

GainLossInfo - indicator for MetaTrader 4

- Views:
- 14732
- Rating:
- Published:
- Updated:
-
 You are missing trading opportunities:
- Free trading apps
- Over 8,000 signals for copying
- Economic news for exploring financial markets
Registration Log inYou agree to website policy and terms of use
If you do not have an account, please register -
 Need a robot or indicator based on this code? Order it on Freelance
Go to Freelance
Need a robot or indicator based on this code? Order it on Freelance
Go to Freelance
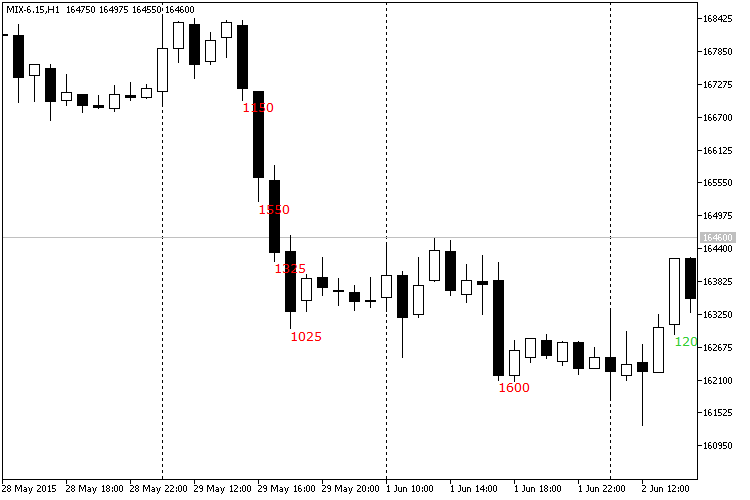
Shows the current gain and loss for all candlesticks exceeding the specified threshold. Values are calculated in percentages and points.
The indicator can calculate gain/loss in two modes: simple difference between Open and Close prices, difference between current Close and previous Close. The user can set minimum threshold (in points and percent), change the calculation mode and control the font color for displayed values.
Input Parameters:
- PercentageLimit (by default = 1.0) — threshold for displaying the change in percentage points.
- PipsLimit (by default = 1000) — threshold for displaying the change in broker points.
- CloseToClose (by default = true) — if true, the indicator will compare the current Close price with the previous Close price, if false — with the current Open price.
- DisplayLossColor (by default = Red) — color for negative changes (losses).
- DisplayGainColor (by default = Green) — color for positive changes (gains).
- DisplayDistance (by default = 100) — distance from the Maximum price of a candlestick to the displayed gain/loss value in broker points.
- MaxBars (by default = 100) — maximum number of bars to process. The higher this value, the slower the indicator will work.
Recommendations:
- It is almost impossible to use this indicator for getting trade signals. Its mainly intended to simplify the market analysis and to make it easier to find certain bullish or bearish patterns. Of course, everyone can try to use abnormally big changes as signals to open or close positions.
Translated from Russian by MetaQuotes Ltd.
Original code: https://www.mql5.com/ru/code/13185
Easy Trend Visualizer
A simple visualizer of trends.
Dots
The indicator shows current trend direction by placing colored dots on the main chart.
 HAN
HAN
The Heiken Ashi Naive Expert Advisor is based on the Heiken Ashi candle chart system and uses the standard indicator of the same name.
Price Alert
Plays sound alerts when the price reaches certain levels, specified by trader.