Join our fan page
- Views:
- 28668
- Rating:
- Published:
- Updated:
-
Need a robot or indicator based on this code? Order it on Freelance Go to Freelance
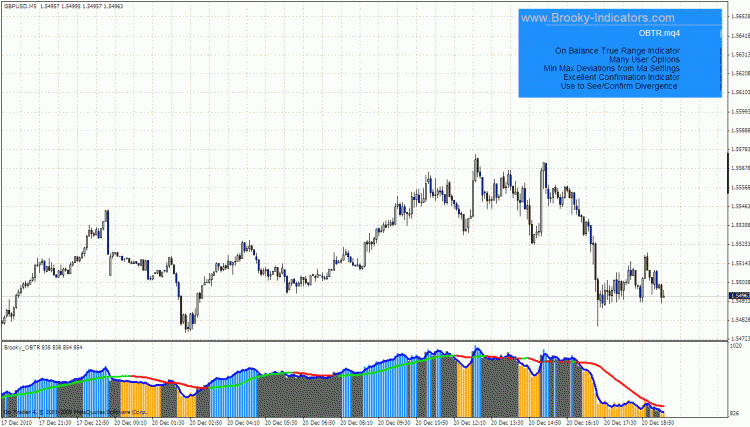
Tom Bierovic originated the concept of using the range to overcome some of the limitations of the volumes indicator.
I searched everywhere for an MT4 version and could not find. Therefore this indicator was born.
I have enabled it with many options so that it can be tailored to suit many strategies. It appears to work very well as a confirm tool with
other standard indicators. It is suggested to use it in conjunction with MACD signals and a 9 ema smooth of the OBTR. The proximity
parameter that you will find in the settings is how close to either side of the Slow ma in pips you want the OBTR line to come before a
cross is shown. If set to say 11, this will mean a range of 22 pips will be grayed out. This can serve as a breakout point. Set to a small value often
shows the end of a retrace in a trend. The maximum setting is designed to gray out those areas where the difference between the MA and OBTR exceeds
your setting. Example is say 126 pips. This may be a point of exhaustion for a breakout and a time to take profit.
As a very basic set of rules.
a) Gray: MA close to OBTR: Look for a breakout or trend continuation.
b) Gray: MA far from OBTR: Take profit or reverse trade.
c) Blue: Look for an excuse to go long.
d) Orange: Look for a reason to Short.
NOTE: The slow MA is a tri color line and if the line is neither Lime or Red but gray, if that happens over say 2 bars, this seems to intimate for eg: the end of an upswing
in a downtrend.
I hope that this is a handy addition to your toolbox.
Cheers
Brooky
 AlertLine
The indicator shows a messsage then the price crosses the lines, titled the "Support" and "Rezistans" on the chart.
 ZIGZAG on fractals, without redrawing the values
Zigzag lines are built on fractals
 Tick Chart
Tick chart in separate window with Ask line and candle price lines.
 Breaking Out with RSI
An indicator based on Lows and Highs of last 16 candles + RSI reading. Describes trend as Flat, Trending Up, Breaking Out Upwards, Trending Down, Breaking Out Downwards.
