Example of a trade and the importance of a right decision.

So lets have a look again on the picture and lets go step by step . What tell us :
1.candles
2.candle formations
3.Fibonacci retracement
4.Volume
5.MACD
6.Stochastic
1.Candles
The study of candles is very very complicated and if you would like to know something about candles you must study a lot . But we can always use what fit to our strategy. But what tell us the candles here . Actually nothing special . We can see that the candles after the last huge bear candle are very weak without any power so we can only dedicate that something is happening.
( RESULT : no decision)
2. Candle formation.
We have two groups of candle formation : continuation and reversal . So there are some congestions that can tell us that this one should go more down . The last 5 candles form a formation named as a „flag“ which is also a signal for short.
( RESULT : short)
3. Fibonacci retracement
As we have been describing in our article about fibonacci tools and how to use them we will stick the steps written there so we will have a look on some S/R lines so lets have a look on the picture where we will find this and only one very important S/R line which took a play also in history ( the red line).
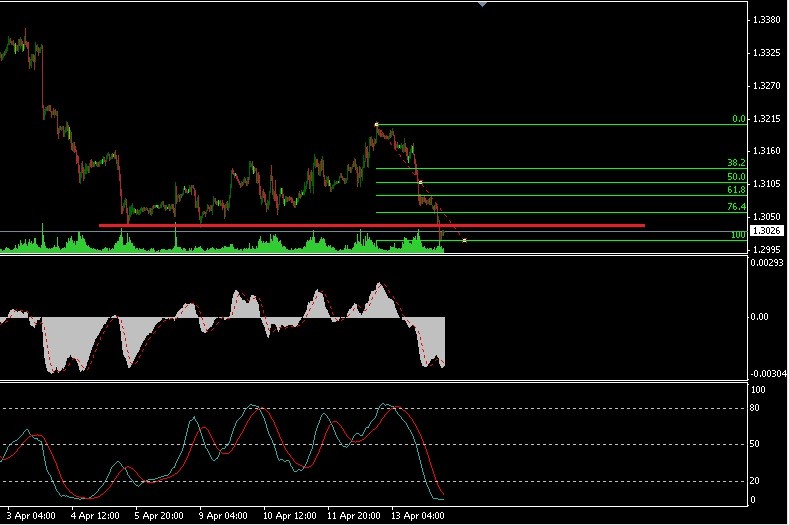
So we have our S/R line. And now we can draw our fibonacci retracement where the level 0% will be up and 100% under the s/r line as you can see on the picture. From this point we can even think about our potentional TP of our trade which will be somewhere at the level of 38.2%
4. Volume
The study of „volume“ is very complicated and i sused with the combination of Elliot waves. But as you can see on our first picture when the trend is clear the values of volume are high but the actual situation is different . The volumes of last 5 candles are : 72 ,79,56,42 ,... So as you can see they decrease so the „sell power“ is weakening and the next period of time will show us that we are correct.What we should see is also the slightly move up and rising of the volues of the volume. So lets have a look on next picture.
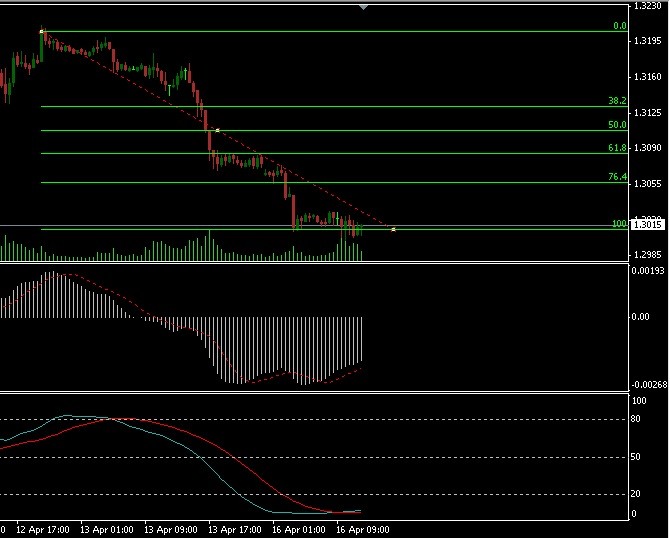
So after a few hours we can observe 2 facts ! The red S/R line is holding and as i have mentioned the volues of volume are rising
(RESULT : buy)
5.MACD
This indicator is very useful and can show us probable prize divergences. In simply words said . The prize move somewhere where it shouldnt. And we can talk about extreme. So lets have a look on our last situation again. We can see that MACD is below the value of zero , that mean that the prize is in sort of extreme ( something unusual for it) . Generaly the basic rule of „ prize action“ is that the prize always is trying to be in some specific average. And MACD show us in what sort of extreme the prize at the moment is. So we can see that for now i tis enough of downfall and in a very short way we can expect some upwards movement.
(RESULT : buy)
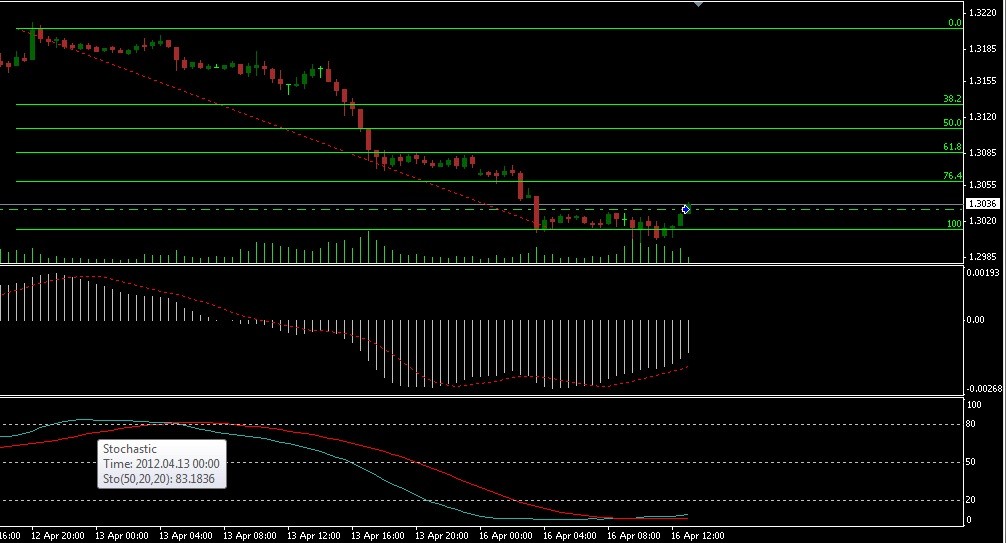
6.Stochastic.
This indicator is connected with the cycles of the market . All of us know the basic theory how to use the indicator. But when we would like to use it correctly we should make some basic research what periods will be ideal for our strategy. I have chosen the periods of 50,20,20. There are 3 basic rules :
a) Buy when the stochastic lines are below the value of 20
b) When the stochastic lines are around the number of 50 dont trade
c) Sell when the stochastic lines are above the value of 80
But what is more important we should always use stochastic with the combination of some other indicator. So according what we have written look on the picture again and you will see our result.
(RESULT : buy)
The summarizion of the indicators and formations are these:
For sell : 1
For no conclusion: 1
For buy : 3
From the results of summarization we can see that zour final decision should be BUY. Here we can say how important is to make a complex analysis ( only in the case of TA). Later you will get this to your blood and will see if your system is profitable. According to this you can aprove it.
Elliot wave dedications
As you and your trading will improve later you will start to see thing more easier like Elliot waves on the graph . Lets see on our situation without the indicators with only the usage of Fibonacci retracement for better setting of the waves. As we can see on the picture everything nicely fit to our for still no dedicated decision buy.

So we will set our entry point now on level 100% with the SL . The usage of our account should be according to 2% risk rule. So as we have entered we can also set our trailing stop to the value of +40 pips. Our TP would be the level of fibonacci level of 50% . The theory says that it should be level 38.2% but as we all know the prize will never hit everythink precisely and totaly perfect.
So after all these the decision is very easy ,... if it still not for you try to start believe to your decisions . SO according to all this aspects we will open a buy position as on the picture.
We have set also trailing stop which was moving with our position and after a few hours the situation looks that our trade hase been already closed

You can use this to WHATEVER instrument and WHENEVER the rules are always the same . Make a complex analyzis ,...write pluses and minuses and after that just make your decision.


 & AMD Framework")
")