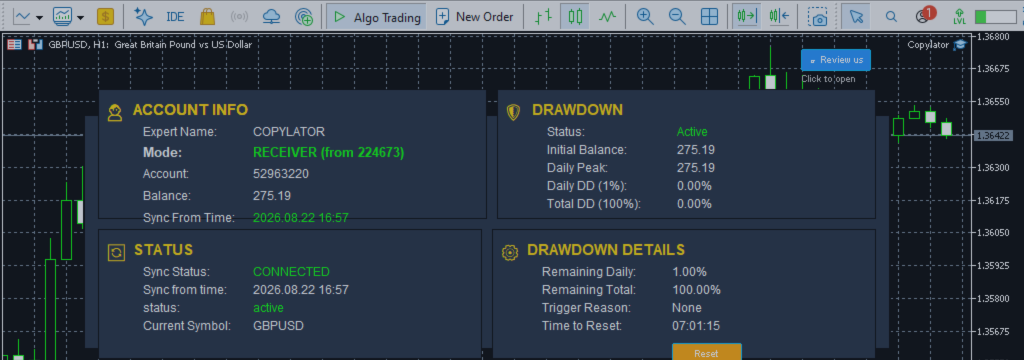
Time Under Water: The Drawdown Metric Nobody Configures — COPYLATOR – MT5 Trade Copier

Product link:
https://www.mql5.com/en/ market/product/191385
Almost every discussion of drawdown protection focuses on depth. How far can the account fall before the limit is triggered? Twenty percent? Fifteen percent? Ten percent?
But drawdown has another important dimension: duration. How long does the account remain below its previous equity peak before recovering?
An account that falls 12% and recovers in three weeks presents a very different experience from an account that falls by the same amount and remains below its peak for eight months. A conventional percentage-based drawdown limit treats these situations similarly because it measures the size of the decline, not the time required to recover.
This second dimension is known as time under water, and it deserves a place in every serious strategy evaluation.
What Does Time Under Water Measure?
Time under water measures how long an equity curve remains below a previous high-water mark before reaching that level again.
Consider an account that starts at $10,000, rises to $11,000, falls to $9,900, and eventually returns to $11,000.
The period between the decline below $11,000 and the recovery to that level represents time under water. The account has not yet recovered its previous equity peak, even if it has generated profitable trades during the recovery period.
The metric is expressed in days, weeks, or months rather than as a percentage. It describes the duration of recovery, not the depth of the loss.
For accurate measurement, the calculation should use a consistent equity curve and a clearly defined high-water mark. If the account has deposits or withdrawals, those cash flows should be accounted for so that external transfers are not mistaken for trading performance.
Why Drawdown Depth Alone Can Be Misleading
A strategy with a 15% maximum drawdown may appear acceptable at first glance. But the same 15% drawdown can have very different implications depending on how long recovery takes.
Compare two hypothetical strategies:
- Strategy A: Maximum drawdown of 15%, with recovery in three weeks.
- Strategy B: Maximum drawdown of 15%, with recovery taking nine months.
The maximum decline is identical, but the recovery experience is not.
A short, sharp drawdown can be stressful, but a prolonged recovery can create a different kind of pressure. The trader may begin questioning the strategy, comparing it with other signal providers, changing lot sizes, or abandoning the system before its historical recovery period has elapsed.
A shallow drawdown that persists for months can be just as difficult to tolerate as a deeper decline that recovers quickly.
The Relationship Between Time Under Water and Drawdown Limits
Drawdown protection primarily controls the depth of an account's decline against its configured reference values. It does not independently measure how long the account has remained below a previous equity peak.
This distinction matters when choosing protection settings.
A trader who expects a strategy to recover within a few weeks may be comfortable with a particular drawdown threshold. If historical data shows that recovery can take several months, the same threshold may be psychologically or financially unsuitable.
The appropriate limit therefore depends on more than the strategy's historical maximum drawdown. It also depends on the trader's available capital, tolerance for prolonged recovery, trading objectives, and ability to leave the strategy operating under controlled risk.
Time under water does not automatically tell a trader which percentage limit to choose. It provides additional information for making that decision.
How to Measure Time Under Water
Time under water can be calculated from a historical equity curve, provided the data is sufficiently detailed and consistent.
A practical measurement process is:
- Identify a new high-water mark in the equity curve.
- Record the date and time when equity subsequently falls below that high.
- Track the period during which equity remains below the high-water mark.
- Record the recovery date when equity reaches or exceeds the previous high again.
- Calculate the elapsed time between the start of the underwater period and the recovery.
- Repeat the process across the available history.
The resulting observations form a recovery-duration distribution.
- Median time under water: The middle recovery duration across completed underwater periods. It describes a typical recovery more reliably than an average when a few unusually long periods exist.
- Maximum time under water: The longest completed recovery period in the historical sample.
- Current time under water: How long the account has remained below its latest unrecovered high-water mark.
One important detail: an underwater period that has not yet recovered is still ongoing. It should be reported separately rather than excluded from analysis simply because no recovery date is available.
Historical maximum time under water is not a guarantee that future recoveries will finish within the same period. It is an observation from the available sample, not a forecast or a deadline.
Three Questions This Metric Helps Answer
1. Can You Tolerate the Historical Recovery Period?
A strategy whose longest historical recovery took nine months may require a trader to tolerate a prolonged period below the previous equity peak.
If the trader is likely to abandon the strategy after two months, the strategy may be unsuitable regardless of its long-term profitability.
The key question is not simply whether the strategy eventually recovered. It is whether the trader can realistically follow its risk plan during the recovery period.
2. Is the Drawdown Limit Appropriate for the Strategy?
A drawdown limit can trigger correctly while the account remains below its previous peak for a long time.
For example, a trader may configure a 20% limit based on the expectation that the strategy normally recovers quickly. If historical recovery periods are much longer than expected, the trader may discover that the account can remain blocked or restricted for an extended period.
The protection may have performed exactly as configured. The problem may be that the trader evaluated the strategy using drawdown depth alone and did not consider recovery duration.
3. Is the Waiting Period Long Enough?
Some traders use a waiting period or cooldown before resuming copying after a drawdown event.
A short cooldown can prevent an immediate emotional restart, but it does not establish that the strategy has recovered or that its underlying conditions have improved.
A three-day cooldown, for example, is not evidence that a strategy with historically long recovery periods is ready to resume after three days.
Cooldown decisions should be based on a review of the strategy and the account's current condition, not simply on the passage of a predetermined number of days.
The Prop Firm Implication
Time under water is particularly relevant when evaluating strategies for prop firm challenges.
Challenges often operate within a defined evaluation period. The exact duration and trading rules vary between firms and account types.
A strategy may have positive long-term returns and an acceptable maximum drawdown but still be unsuitable for a short evaluation window if its recovery periods are frequently longer than the available time.
For example, a strategy with a median time under water of 40 days may spend a substantial part of a 30-day evaluation period below its previous equity peak.
This does not prove that the strategy will fail the challenge. It does indicate that its recovery characteristics should be evaluated alongside its return, drawdown, trading frequency, and the firm's specific profit and loss rules.
A strategy designed for long-term account growth is not automatically suitable for a short-duration evaluation.
Depth and Duration: Understanding the Recovery Mathematics
Drawdown depth determines the percentage gain required to recover a loss. Recovery duration determines how long the recovery takes.
For example, after a 10% loss, an account needs an 11.11% gain on its reduced balance to return to its starting level.
That required percentage gain is the same whether recovery takes one month or six months. What changes is the pace at which the recovery occurs.
If the account recovers by approximately 11.11% over one month, the required monthly performance is very different from spreading that recovery over six months.
However, a longer recovery period does not necessarily mean that the strategy has a lower expected return. It may reflect a period of unfavorable market conditions, a different sequence of trades, or a change in exposure. The equity curve alone does not establish the cause.
Depth and duration should therefore be evaluated together, rather than treating one as a substitute for the other.
The Behavioral Effect of a Long Recovery
Extended time under water can create behavioral pressure that is not visible in a maximum drawdown percentage.
- Loss of confidence: The trader may begin doubting the strategy because the previous equity peak remains unrecovered.
- Comparison with other strategies: Other signal providers may currently be performing well, even though they may be at different points in their own drawdown cycles.
- Reducing lot size: A trader may reduce exposure to feel safer. This can reduce future losses, but it can also reduce the monetary contribution of any subsequent recovery.
- Increasing lot size: Another trader may increase exposure in an attempt to recover faster, potentially making the drawdown worse.
- Resetting protection prematurely: A trader may manually reset drawdown protection to resume copying without first evaluating whether the strategy or account conditions justify doing so.
These reactions are not inevitable, but they are common risks of prolonged uncertainty.
A predefined risk plan can help prevent emotional changes to lot sizing, protection thresholds, and reset decisions during an extended recovery period.
What Should You Configure in COPYLATOR?
Time under water is a strategy-analysis metric, not a direct drawdown trigger in COPYLATOR. The copier's drawdown protection is designed to respond to configured drawdown conditions; it does not independently calculate or enforce a maximum recovery duration.
Nevertheless, recovery-duration analysis can inform three important configuration decisions.
1. Drawdown Limits
Choose daily and total drawdown limits with both the depth of historical losses and the duration of recovery in mind.
A trader who cannot tolerate a prolonged period of reduced equity may need a more conservative strategy or lower exposure. Simply lowering a drawdown limit does not guarantee shorter recovery periods, however. It changes when protection responds, not how quickly the underlying strategy recovers.
2. Cooldown and Resumption
If a waiting period is used after a drawdown event, treat it as a pause for review rather than a prediction of recovery.
Before resuming copying, check the account's current exposure, the reason for the drawdown, the strategy's recent behavior, and whether the original risk assumptions remain valid.
3. Manual Reset Policy
A manual reset should be a deliberate risk-management decision, not a way to make an uncomfortable drawdown disappear from the dashboard.
In COPYLATOR, a manual reset through Drawdown Details on the Receiver resets the daily and total drawdown calculations and establishes the current balance as the new initial balance.
This changes the reference used by the protection calculations. It does not recover lost capital, close existing positions, or improve the underlying strategy.
Before resetting, review whether the account's current exposure and the strategy's condition justify resuming copying.
Keep a Recovery Record for Every Sender
When following multiple senders, record recovery duration alongside the usual performance statistics.
A useful monitoring record can include:
- Maximum drawdown.
- Median completed time under water.
- Maximum completed time under water.
- Current time under water, if the account is still below its high-water mark.
- Largest historical losing streak.
- Recovery performance after the deepest drawdowns.
Review the figures periodically, such as quarterly, and compare them with earlier observations.
If the median recovery duration increases significantly while the maximum drawdown remains similar, the strategy's recovery profile may have changed. That is a reason to investigate further, not automatic proof that the strategy has deteriorated.
Also remember that sender performance and receiver performance may differ because of lot sizing, broker execution, spread, swap, slippage, and account-specific conditions. Whenever possible, calculate the metric from the actual receiver equity curve if the purpose is to understand the recovery experience of that account.
Summary
Drawdown has two important dimensions: depth and duration. Conventional percentage-based drawdown protection focuses primarily on depth. Time under water measures how long an account remains below a previous equity high before recovering.
This metric helps traders understand whether they can tolerate a strategy's historical recovery periods, whether a strategy fits a time-limited evaluation, and whether their risk and reset decisions reflect realistic expectations.
It does not automatically determine the correct drawdown limit, predict future recovery dates, or provide a direct trigger for COPYLATOR's drawdown protection. It is an additional analytical tool that helps make configuration decisions more informed.
Record recovery duration alongside maximum drawdown. Monitor both completed and ongoing underwater periods. Review the strategy before changing exposure or resetting protection.
Drawdown depth tells you how far the account fell. Time under water tells you how long you had to live with it. A complete risk assessment needs both.
Product link:
https://www.mql5.com/en/ market/product/191385