
EdgityCore - Understanding Trading Mode
Every EdgityCore Indicator can work in two modes. This guide explains the first one, Trading Mode, in plain trading language. It does not matter which indicator you use: the idea is the same.
"I am trading today. What should I expect from the indicator, and what will it show me?"
That is the question Trading Mode answers.
What Trading Mode Is
Trading Mode is the live, day-by-day mode of the indicator. It watches the market as it unfolds, shows you each new signal as it forms, and keeps score of how your own trades on those signals are doing.
It is built around one idea: what matters is the current broker day. The indicator does not try to prove anything about the past. It helps you trade today.
- It marks new signals on the chart with their entry, Stop Loss and profit levels.
- It tells you whether a signal is still fresh or whether the moment to take it has passed.
- It matches the trades you take to the signals they came from.
- It reports the results of those trades in the statistics panel.
- It protects you from a bad day getting worse, through the Circuit Breaker.
Trading Mode is the default mode when you attach an EdgityCore Indicator to a chart.
When to Use It
Use Trading Mode when you are trading, or preparing to trade, today:
- You want to see signals as they form and decide whether to act on them.
- You want your own results for the day, measured against the signals you traded.
- You want a daily safety net that stops new signals after a run of losses.
If your question is instead "Did this strategy work over the last two years?", you want the other mode. See EdgityCore - Understanding Quant Analysis Mode.
How Analysis Begins
When Trading Mode starts, the indicator looks at the current broker day only, from 00:00 broker time today onwards. Nothing before that is analysed, and there is no end date: the analysis simply keeps following the market.
00:00 broker time now (open-ended) │─────────────────────┤────────────────────────────▶ signals from earlier live signals today are drawn appear as bars complete
This has a practical consequence. If you attach the indicator at 14:00, it does not start from zero. It reviews the bars since 00:00 and draws any signals that formed earlier in the day, so your chart looks the same as if the indicator had been running all day. Those earlier signals are drawn silently: they do not send alerts.
Note — Broker time
A "day" always means a day on your broker's server clock, not your local clock. The day starts when your broker's day starts. Your chart's time axis shows broker time.
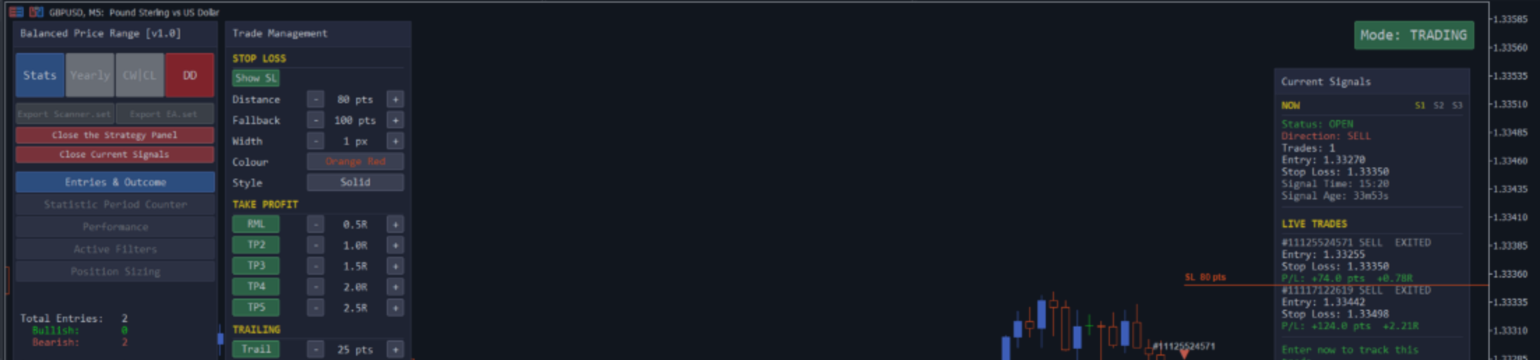
Choosing the mode. The mode button at the top right of the chart shows Mode: TRADING or Mode: QUANT. One click switches between them and the indicator rebuilds itself for the new mode. The starting mode is set by the input Default Trading Mode at startup (Day Trading or Quant Analysis). The indicator remembers your last choice for each symbol and timeframe, so a reload or a restart keeps you where you were, for as long as the input itself is unchanged. If you load a settings file whose mode is different, the settings file wins.
The Active Filters section of the statistics panel also confirms the mode (Mode: Trading).
Chart layout. When you attach an EdgityCore Indicator it keeps free space on the right of the chart (MetaTrader's chart shift), turns the chart's auto-scroll on, and restores your own chart settings when it is removed. The inputs Chart Layout: reserve space on the right (MT5 Chart Shift) and Chart Layout: shift size (% of chart width, 10-50) control this, and the first one can be switched off.
What the Indicator Monitors
In Trading Mode the indicator keeps an eye on two things.
- The market. Each time a bar completes, the indicator applies its detection rules (and your session and filter settings) to the current broker day and decides whether a new signal has formed.
- Your trades. On the same symbol, it looks at the trades you open and close, so it can link each trade to the signal it belongs to.
The indicator never opens, changes or closes a trade for you. Your execution is never restricted. It only reads what happened and reports it.
Two parallel layers. Trading Mode keeps two layers side by side, and it helps to keep them apart:
- Signals are the indicator's own analysis. The indicator evaluates every signal from its own levels, whether or not you trade it. The signal status (OPEN, ACTIVE, CLOSED) and the Circuit Breaker work on this layer.
- Trades are your actual positions at your broker. LIVE TRADES, the Trade History and the Trading Mode statistics, including the Performance figures, work on this layer.
A trade is linked to a signal only when you take one. The Circuit Breaker does not use the results of your trades.
How Signals Are Created
A signal appears when the indicator's pattern is complete and every condition you have set is satisfied. When that happens you see, on the chart:
- an entry marker and entry line;
- the Stop Loss;
- the Risk Mitigation Level (RML) and the Take Profit levels, as multiples of the risk (see Core Concepts — Understanding Risk (R)).
If you have switched alerts on, a new signal sends one alert when it is confirmed on the most recent bar. Signals found while the indicator loads never alert, so reloading does not flood you with notices about old signals.
A signal is only created if the Circuit Breaker has not already stopped signals for the day (see below).
What an Active Signal Is
The Current Signal Panel describes every signal with a Status:
| Status | What it means for you |
|---|---|
| OPEN | The signal is still fresh. If you want to take it as a new trade, this is the moment. |
| ACTIVE | The moment to take it as a new signal has passed. The signal has not finished, so you can still manage a trade you already have, but a new entry now is your own discretionary decision. |
| CLOSED | The signal has finished. |
Each indicator decides for itself how long the OPEN period lasts, because it depends on the strategy. Your product page describes it. Status describes the signal only. It never says anything about your own trades.
You are never prevented from trading. The indicator separates two things: market analysis (what the strategy sees) and your decisions (what you choose to do).
All Signals or Latest Only. In Trading Mode the Current Signal Panel also has two buttons, All Signals and Latest Only. All Signals is the default and draws every signal as described in this guide. Latest Only keeps the chart focused on the latest open signal and removes the chart drawings of the other signals. It changes only what is drawn: signals, statistics, alerts and your trades are not affected. The choice is remembered for each symbol and timeframe.
How a Signal Progresses
Signal appears → OPEN → ACTIVE → CLOSED (fresh) (passed) (finished)
While a signal is unfinished, the chart follows the market against its levels. The signal finishes when price reaches its Stop Loss, one of its Take Profit levels, or its trailing stop. If you have turned on Close at EOD, it also finishes at the end of the broker day.
Two things can then happen to the chart:
- You traded it. A marker with your ticket number shows which trade belongs to which signal.
- You did not trade it. When the signal has finished and no trade of yours was matched to it, its levels are reduced to a small grey marker. This is not a loss, an error or a cancellation. It only records that the signal existed.
A finished signal's levels stay visible for the number of bars set by Signal visibility after close (0 keeps them forever).
The Completed Trades row of the Strategy Panel chooses what the chart shows of a signal's levels: All levels, or only the Reached Levels (the entry, the Stop Loss and the Take Profit levels that price has actually reached).
How Your Trades Are Matched to Signals
The statistics in Trading Mode are about your trades, so the indicator must know which trade belongs to which signal. The rules are simple:
- A trade you open by hand from MetaTrader, on the same symbol and in the signal's direction while the signal is still valid, is matched to that signal.
- If the indicator's companion EA is trading the symbol, the EA's trades are the ones matched.
- One signal is matched to one trade, the first one. One trade belongs to one signal. Extra trades on the same signal remain valid trades in your account but are not counted in the statistics.
- When two signals could both claim a trade you opened by hand, it goes to the most recent signal.
- Once a trade has been matched, the match is permanent. It is saved, so it is restored if you reload the indicator or restart MetaTrader.
LIVE TRADES. While a matched trade is open, the Current Signal Panel lists it in a LIVE TRADES section: its direction, entry, Stop Loss and its running result in points and in R. When the trade closes it leaves the list and is counted in the statistics and in the Trade History. The section is not shown while the indicator's companion EA is trading the symbol.
How Completed Trades Affect the Statistics
Until the first trade of the day has been matched to a signal, the statistics panel shows greyed dashes. This is deliberate: statistics should describe your trading, so they wait for your first trade.
When a matched trade closes, the indicator reads the result from your broker's records. It measures where you actually closed, from your real entry price to your real closing price, as a multiple of the risk. The trade is then placed in exactly one result row (for example Close SL-Entry or Close RML-TP2: each row is the interval between two of the levels, from Close Below SL to Close Above TP5) and the figures update within moments:
- Net Points, Average per Trade, Win Rate, Profit Factor and Average R/R;
- Maximum Drawdown, and Maximum Consecutive Wins and Losses;
- whether you closed the trade yourself (Closed Manually).
These figures describe the trades you took, not every signal the indicator displayed. Take half the signals and the statistics describe those. Skip all of them and there is nothing to report yet.
Note — Partial Trade Closures
When you partially close a matched trade, the realised profit or loss is not yet added to the Trading Mode statistics. The trade continues to be treated as pending until the remaining position has been fully closed.
This behaviour will be improved in a future EdgityCore release, where partial closures will be reflected more accurately in the reported trading statistics.
How the Statistics Panel Evolves
The panel is organised in sections: Historical Analysis, Performance, Active Filters, Position Sizing and, in Trading Mode, Statistic Period Counter.
During the day it moves through three stages:
- Waiting. No trade matched yet: dashes, greyed.
- Trade open. The panel becomes active and counts your entries; the trade is counted as pending until it closes.
- Trades closed. Each closed trade adds to the result rows and to every figure above.
The Performance section adds deeper measures (Expectancy, Risk of Ruin, Sharpe and Sortino). Advanced figures such as Risk of Ruin appear only once enough trades have been analysed, so that a handful of trades cannot give a misleading picture. Until then the row reads Available after N analysed trades. The minimum is the input Performance View: min trades for advanced stats (default 30, range 10-500), and the figures keep accumulating while they are hidden.
Daily or Multi-Day. By default the panel counts one broker day and starts again at the next one. In the Statistic Period Counter section you can switch it to Multi-Day with the Multi-Day Statistics button: the statistics then accumulate from a start date until you press Reset Statistics. Resetting starts a new counting period only; your trades and your account are never touched.
How the Trade History and the Reports Are Updated
Your chart and panel are updated continuously. Reports are different: they are snapshots that you create with a button, and each one is saved as a new, time-stamped file. Nothing is overwritten.
| Report | In Trading Mode |
|---|---|
| Stats | Available. |
| DD (Drawdown) | Available. |
| CW|CL | Greyed out while the Circuit Breaker is enabled. It becomes available if the Circuit Breaker is disabled. |
| Yearly | Greyed out. A yearly report is a multi-year study: use Quant Analysis Mode. |
| Trade History | Available, with the Export Trade History button of the LIVE TRADES section. It lists your closed trades one per row with the real prices, times and exit. Only closed trades are exported. Open trades are shown in the LIVE TRADES section until they close. |
The Trade History follows the same counting period as the statistics: the current broker day in Daily counting, or the whole period in Multi-Day counting. Every report is described in its own guide.
Note — What differs between indicators
Trading Mode works the same way in every EdgityCore Indicator. What differs is the strategy: the signal logic, how long a signal stays OPEN and the strategy-specific settings. Your indicator's product page describes them.
How the Circuit Breaker Behaves
The Circuit Breaker protects you from a bad day getting worse. In Trading Mode it is on by default, and it has its own switch: the input Circuit Breaker (Trading Mode), which is independent of the Quant Analysis Mode setting.
It watches the outcome of each completed signal during the current broker day, as the indicator evaluates it from the signal's own levels. This happens whether or not you traded that signal. A signal that reaches its Stop Loss before reaching the Risk Mitigation Level adds one to the consecutive-loss count. A signal that reaches the Risk Mitigation Level or a Take Profit resets the count to zero. Signals that are still open do not contribute.
When the consecutive-loss count reaches the configured Daily Loss Limit, the indicator stops creating new signals for the remainder of the current broker day. The Daily Loss Limit is an input; 0 turns the Circuit Breaker off, as does switching off Circuit Breaker (Trading Mode).
What Happens When the Circuit Breaker Stops New Signals
- No new signal is drawn, counted in the statistics, exported or sent as a signal alert for the rest of the broker day.
- You are told once. The first time the Circuit Breaker stops signals on the current broker day, the indicator sends one notice through the alert channels you switched on in the Alerts inputs. It is headed by the indicator's name and Circuit Breaker Activated, and reads: The Daily Circuit Breaker has been activated because the daily loss limit has been reached. No further signals will be generated today. Signal generation will automatically resume on the next trading day. The notice is for today only: it is not sent for earlier days when the indicator loads or recalculates, and reloading the indicator on the same day may send it again.
- Signals that already exist are not removed or modified. They stay on the chart and keep following their own Stop Loss and Take Profit levels.
- Your account is not affected. The Circuit Breaker never closes, blocks or changes a trade. If you open a trade by hand anyway, MetaTrader executes it as usual.
When Monitoring Resumes
The count starts again at the next broker day, and signal creation resumes automatically. You do not need to do anything.
A Typical Trading Day
- Attach the indicator (or open the chart). Confirm the button reads Mode: TRADING.
- Let it load. Signals that formed earlier today appear. They are for context and do not alert.
- Watch the Current Signal Panel. A new signal arrives with the status OPEN.
- Decide. Take the trade, or do not. The indicator never decides for you.
- Manage the trade as you normally would. The panel and chart follow it.
- Review as you go. After your first matched trade the statistics wake up. Each closed trade updates them.
- Respect the day. If the Circuit Breaker stops new signals, it is telling you the day is not going your way.
- Export what you need at the end of the day: the Stats, the DD and the Trade History.
- Tomorrow the count, the signals and the Circuit Breaker start fresh.
Important — Not a guarantee
Signals and statistics describe how the strategy and your trades performed. They are not a promise of future results, and they are not trading advice. Trading involves risk, including the loss of the capital you invest.
Related Guides
EdgityCore — Core Concepts — Understanding Risk (R)
EdgityCore — Indicator Statistics Report Guide
EdgityCore — Indicator Trade History Report Guide
EdgityCore — Frequently Asked Questions Part 2
EdgityCore — Frequently Asked Questions Part 3
© 2026 Marc Quentier. All Rights Reserved. This document is part of the EdgityCore Suite. No part of this publication may be reproduced, distributed or transmitted in any form or by any means without the prior written permission of the copyright holder, except as permitted by applicable copyright law.




