
Questions & Answers — Part 3
This page continues the EdgityCore indicator Q&A from Part 2. It covers manual-trade association (the Single Association Rule, Retest Validity, and the Signal Association Buffer), the signal lifecycle (OPEN, ACTIVE, and CLOSED), the Current Signal Panel in detail, alerts, how the Take Profit levels are calculated from the Stop Loss, the LIVE TRADES section with the Trade History export, and the Trading Mode statistics panel (Performance View, outcome rows and the Statistic Period Counter). For signal detection, session configuration, and the core statistics panel see Part 1; for trailing stops, exports, instrument compatibility, the Daily Circuit Breaker, and Trading Mode / Quant Analysis Mode see Part 2. The terminology used throughout this page follows the EdgityCore Customer Terminology Policy (FP-041).
| # | Question | Topic |
|---|---|---|
| Q44 | I opened two manual trades on the same signal — why is only one of them recognised? | Single Association Rule: a signal is associated with at most one broker trade. The first trade matched to it permanently consumes it; later trades on the same signal are valid MetaTrader trades but are not associated or counted in Trading Mode statistics. |
| Q45 | What are Retest Validity and the Signal Association Buffer? | Two optional Quant settings for retest-based indicators. Retest Validity chooses where a retest may be accepted; the Signal Association Buffer only extends how long the Current Signal Panel shows a signal as open (manual trades are recognised while the signal is valid, regardless of this setting — see Part 2, Q43). Neither creates new signals; defaults keep today's behaviour. |
| Q46 | Can I still take a manual trade after the optimal entry window has closed? | Yes. If no trade was taken during the optimal entry window, your first discretionary trade is still recognised and included in the statistics while the signal remains valid. Once the signal has closed, further manual trades are no longer recognised. |
| Q47 | What is the difference between OPEN and ACTIVE? | OPEN is the strategy's engineered optimal entry. ACTIVE means the signal is still active but any new entry is entirely at your discretion — later entries may involve greater risk or a different reward profile. |
| Q48 | Why does the indicator still recognise a trade after the optimal entry window? | EdgityCore separates market analysis from trading decisions: the indicator identifies the preferred entry but does not stop you entering later while the signal remains valid. |
| Q49 | Why does the indicator distinguish between OPEN and ACTIVE? | To separate market analysis from trading decisions: OPEN identifies the strategy's preferred entry, ACTIVE shows the signal is still active after that window, and the first discretionary trade is still recognised so you can apply your own judgement without changing the strategy analysis. |
| Q50 | Quant Mode — Entry Classification vs Signal Lifecycle | Trading Mode shows the signal lifecycle (Open / Active / Resolved). Quant Mode classifies each entry by the highest performance level achieved so far (SL, TP1…TP5, Trail), independently of the signal lifecycle. Quant "Pending" means "entry not yet classified", not "signal still active". |
| Q51 | What do OPEN, ACTIVE and CLOSED mean on the Current Signal Panel? | OPEN: the strategy's optimal entry window is running. ACTIVE: that window has closed but the signal has not finished — a later entry is your own discretionary decision. CLOSED: the signal has finished. |
| Q52 | What ends a signal's optimal entry window — and what ends the signal itself? | Each strategy sets its own entry window (for example, it may end when the entry candle closes), and some add their own limits. It never stops you trading. The signal itself ends only at Stop Loss, Take Profit, the trailing stop, or the end of the broker day. |
| Q53 | What does "Signal expired — No trade taken" mean, and how is it decided? | In Trading Mode, a finished signal that has no trade matched to it is reduced to a grey marker. It is based on the trades the indicator has matched to the signal, not a live search of your account, and it is not a loss, an error or a cancellation. |
| Q54 | Why can neighbouring signals show different states? | Each signal is tracked on its own: a trade is matched to one signal only, each entry window closes at its own time, and a finished signal never takes the PREVIOUS slot on the panel. |
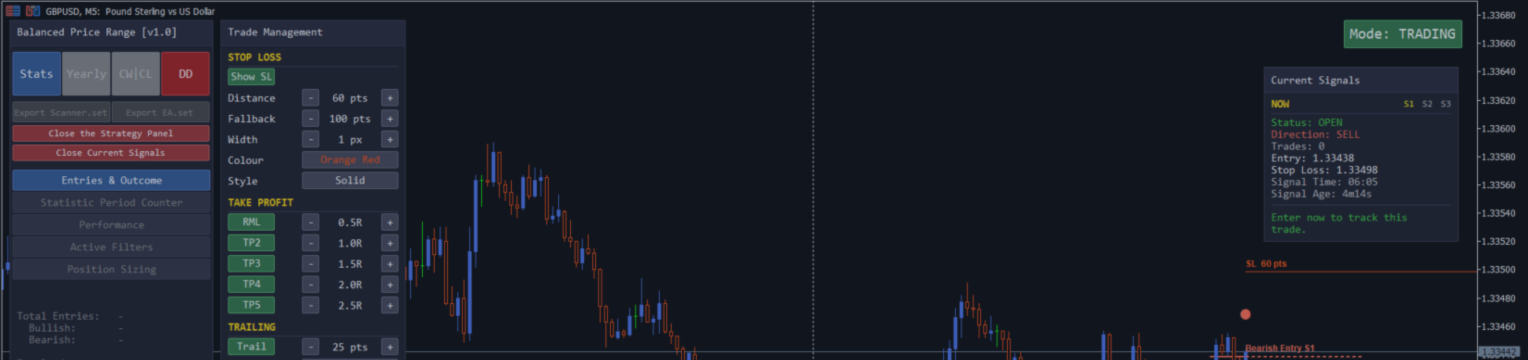
| Q55 | What does each line and message on the Current Signal Panel mean? | Status, Direction, Trades, Entry, Stop Loss, Signal Time and Signal Age describe the signal; the coloured footer line tells you whether the entry window is open, closed, or whether entries are being tracked at all. |
| Q56 | When does the indicator send an alert, and how do the alert channels work? | A new signal triggers an alert when it is confirmed on the most recent bar; past signals never alert. Popup, sound, push and email are switched on separately in the Alerts inputs (all off by default). In Trading Mode the Circuit Breaker also sends a separate one-time notice through the same channels. |
| Q57 | Why are the Take Profit levels calculated from the Stop Loss? | Every trade starts with the risk you are prepared to take. Each target is a multiple of that risk (R), so every trade follows the same risk model and results stay comparable across markets. |
| Q58 | What is the LIVE TRADES section of the Current Signal Panel, and what does Export Trade History do? | Trading Mode. LIVE TRADES lists only your open trades; closed trades are exported on demand to a CSV by the Export Trade History [N] button, where N is the number of closed trades the file will contain. Covers the Daily and Multi-Day scope, the CSV location and columns, and the export confirmation message. |
| Q59 | What do the sections and rows of the Trading Mode statistics panel mean? | Trading Mode. Historical Analysis (real closed-trade interval rows, Closed Manually), Performance (Expectancy, Risk of Ruin, Sharpe, Sortino and the minimum-trades input), and the Statistic Period Counter (Daily or Multi-Day counting). Also: which reports are unavailable in Trading Mode. |
Q44: I opened two manual trades on the same signal — why is only one of them recognised?
This is the Single Association Rule, an intentional EdgityCore framework rule:
A signal may be associated with at most one broker trade.
The first broker trade successfully matched to a signal permanently consumes that signal for association purposes. From that moment the signal is linked to that trade's ticket and position, and it is never evaluated for association again — even while the signal is still valid (see Part 2, Q43).
Any further manual trade you open from the same signal:
- is a valid MetaTrader trade — your execution is never restricted or altered;
- is not associated with the signal;
- receives no ticket label and no trade marker on the chart;
- is excluded from Trading Mode statistics;
- is not saved with the indicator's stored trade associations, so it is not restored after a reload.
This is intentional framework behaviour, not a missed match.
Why this rule exists
- Deterministic statistics — every signal has exactly one recorded trading outcome, so the same signals always produce the same statistics.
- No double counting — a single signal can never contribute several wins or several losses.
- Strategy quality, not position sizing — Win Rate, Profit Factor and the other signal statistics measure how good the strategy's signals are, not how many times you chose to scale in or re-enter.
- One-to-one mapping — each signal maps to exactly one recorded outcome, and that outcome to exactly one signal.
Not the same as the one-signal-per-trade rule
A separate rule works in the opposite direction: one broker position can be associated with at most one signal. If two nearby signals in the same direction could both match the same trade, the trade is linked only to the first and is never counted twice.
The two rules are independent and together keep the mapping one-to-one:
- Single Association Rule — one signal → at most one associated broker trade.
- Position consume-once rule — one broker position → at most one signal.
Important: If you scale in or take several entries on the same signal, only the first matched trade contributes to Trading Mode statistics. The results of the additional trades still appear in your MetaTrader account history, but not in the indicator's statistics.
Q45: What are Retest Validity and the Signal Association Buffer?
These are two optional Quant settings, available on indicators whose signals require a retest before confirmation (for example FVG First Strike in its Retest entry mode, Order Block, and Delivery Shift in its Retest entry mode). With their default values the indicator behaves exactly as before.
Neither setting creates new signals. They change only:
- where a retest may be accepted (Retest Validity), and
- how long the Current Signal Panel keeps showing an already confirmed signal as open (Signal Association Buffer).
Retest Validity (Quant)
| Option | Behaviour |
|---|---|
| Strategy Default (unchanged) | Default. The strategy's own published retest rule, exactly as before. |
| Originating Session Only | The retest must occur before the session that produced the setup has ended, on the same broker day. |
| Session Overlapping (Broker Day) | The retest may occur at any time during the same broker day, including during later sessions. |
In every option the signal still belongs to its originating session: its session label, its statistics and the per-session limits are attributed to that session. For the two non-default options the broker day is the hard limit — a retest on the next broker day is never accepted.
Because it decides which retests are accepted, Retest Validity changes which signals exist — identically in Quant Analysis Mode and in Trading Mode. Use Quant Analysis Mode to compare the options on the same history: number of signals, win rate, profit factor, drawdown, net points and every other statistic.
Signal Association Buffer (candles, 0-10, 0 = off)
Manual trades are recognised for as long as the signal is valid (see Part 2, Q43), so this setting no longer affects which trades are recognised. After a signal's Trade Window has closed, the buffer keeps the Current Signal Panel showing the signal as open for a further N candles. 0 (default) keeps today's behaviour.
- The Trade Window itself is not reopened, and the signal's entry, lifecycle, outcome and statistics are unchanged.
- The Single Association Rule is unchanged (see Q44): only the first matched trade is associated with a signal.
The Signal Association Buffer is now purely a display feature. It no longer influences manual trade recognition or Trading Mode statistics.
Current Signal Panel
The Current Signal Panel shows a signal for as long as it remains valid: it stays visible after its originating session has ended, until the signal closes (Stop Loss, Take Profit or trailing stop reached) or its broker day ends. Its status reads OPEN during the optimal entry (extended by any configured Signal Association Buffer), then ACTIVE while the signal remains valid, then CLOSED. While the signal is ACTIVE the footer reads "A discretionary entry is still tracked." (or "Your entry is tracked." once a trade is associated), and "Signal closed." when it has closed.
Q46: Can I still take a manual trade after the optimal entry window has closed?
Yes.
The optimal entry window marks the strategy's preferred entry. If no trade was taken during that period, you may still open your first discretionary trade while the signal remains valid. That trade is still recognised by the indicator and included in the performance statistics.
Once the signal has closed — its Stop Loss, Take Profit or trailing stop has been reached — additional manual trades are no longer recognised. Only the first trade on a signal is recognised (see Q44).
Entering during the optimal entry window remains the strategy's preferred approach. Later discretionary entries are still recognised while the signal remains valid, but they may involve additional risk and remain entirely the trader's responsibility.
Q47: What is the difference between OPEN and ACTIVE?
OPEN represents the strategy's engineered optimal entry — the preferred entry timing generated by the strategy. The Current Signal Panel shows the signal as OPEN during this period.
ACTIVE means the signal is still running, but any new entry is now entirely at the trader's discretion. The panel shows the signal as ACTIVE during this period, and CLOSED once the signal has closed. Later entries may involve greater risk or a different reward profile.
The indicator recognises both, but only the trader decides whether a later entry remains acceptable.
Q48: Why does the indicator still recognise a trade after the optimal entry window?
EdgityCore separates market analysis from trading decisions. The indicator identifies the preferred entry, but it does not prevent the trader from entering later if the signal remains valid. This lets discretionary traders manage signals according to their own judgement while the statistics stay accurate.
The signal remains the analytical object: the statistics describe what happened to the signal and to your first trade on it, and evaluating the additional risk of a later entry is the trader's responsibility.
Q49: Why does the indicator distinguish between OPEN and ACTIVE?
The indicator separates market analysis from trading decisions.
OPEN identifies the strategy's preferred entry, where the signal was originally engineered. ACTIVE indicates that the signal is still running even though the optimal entry window has already passed.
The indicator continues to recognise the first discretionary trade while the signal remains valid, allowing traders to apply their own judgement without changing the underlying strategy analysis. This distinction preserves both objective strategy evaluation and discretionary trading flexibility (see Q46 and Q47).
Q50: Quant Mode — Entry Classification vs Signal Lifecycle
Trading Mode and Quant Mode intentionally measure different concepts.
Trading Mode — Signal Lifecycle. The panel shows where each signal currently is in its lifecycle: Open, Active or Resolved. The counters describe the present state of each signal.
Quant Mode — Entry Classification. The panel evaluates the performance of each entry. Each simulated entry is classified according to the highest performance level it has achieved so far:
- An entry begins as Pending.
- As soon as price reaches a classified outcome (SL or a TP level), the entry leaves Pending and is classified immediately.
| What price has done | Entry classification |
|---|---|
| Reaches SL before TP1 | SL |
| Reaches TP1 | TP1 |
| Reaches TP2 | TP2 |
| Reaches TP3, then later returns to SL (trailing not active) | TP3 — stays TP3 |
| Reaches the trailing activation level, then exits via the trailing stop | Trail |
The entry is classified as soon as its first performance outcome is established. This classification is independent of the signal lifecycle.
Important consequence. Signal Lifecycle and Entry Classification are two independent concepts. An entry can already be classified (for example TP2) while its signal is still Active in the Trading Mode lifecycle. Seeing both at the same time is normal and intentional.
Why Quant Mode works this way. Quant Mode evaluates the quality of an entry strategy. It answers questions such as:
- How often does an entry reach TP1?
- How often does an entry reach TP2?
- How often does an entry reach TP3?
- How often does an entry activate trailing?
- How often does an entry fail before reaching any target?
It is not designed to monitor the current lifecycle of signals.
| Note: The "Pending" counter in Quant Mode does not mean "all signals that are still active." It means "entries that have not yet achieved any classified outcome." Consequently, many signals may still be Active while only a small number remain Pending. This distinction is intentional and reflects the different objectives of Trading Mode and Quant Mode. |
Consequently, the Resolved + Pending counters represent the total number of classified and unclassified entries, not the number of closed and open signals.
See also Part 2, Q37 (Trading Mode and Quant Analysis Mode) and the Resolved and Pending entries of the Statistics Report Guide.
Q51: What do OPEN, ACTIVE and CLOSED mean on the Current Signal Panel?
The Current Signal Panel (see Part 2, Q40) shows where each signal is in its life in the Status row. There are three stages, always in this order:
| Status | What it means | What it means for you |
|---|---|---|
| OPEN | The strategy's optimal entry window is open. | This is the entry the strategy was engineered around. |
| ACTIVE | The optimal entry window has closed, but the signal has not finished yet. | A later entry is entirely your own discretionary decision. In Trading Mode your first matching trade is still recognised (see Q46). |
| CLOSED | The signal has finished. | Nothing further is tracked for it. |
How a signal moves — and where "No trade taken" fits. The status flow and the question "was a trade matched to this signal?" are two separate things:
STATUS FLOW (Status row) Signal created | v OPEN the strategy's optimal entry window is open | v the entry window closes ACTIVE window closed, signal still running | v Stop Loss, Take Profit, trailing stop or end of broker day CLOSED the signal has finished Shortcut: OPEN -> CLOSED when the signal finishes before its entry window would have closed (ACTIVE is then never shown). TRADE MATCHING (Trading Mode only - independent of the status) Was one of your trades matched to the signal? yes -> trade marker (triangle) with the ticket number no -> once the signal is CLOSED: grey marker "Signal expired / No trade taken"
"No trade taken" is not a status. A signal is never "in" that state — it only describes a CLOSED signal that was not traded. A traded and a never-traded signal pass through exactly the same OPEN → ACTIVE → CLOSED stages.
The panel footer repeats this in words — for example "Optimal entry window has closed." or "Signal closed." The Trades row shows how many of your trades the indicator has matched to the signal in Trading Mode (a dash in Quant Analysis Mode).
The panel has two sections. NOW shows the most recent live signal. PREVIOUS shows the next older signal that has not finished yet; a signal that has finished (CLOSED) is not shown there.
See also Q47, Q49, Q54 and Q55.
Q52: What ends a signal's optimal entry window — and what ends the signal itself?
These are two different events.
The optimal entry window is decided by the strategy that produced the signal, so it differs between indicators:
- Several indicators close the window when the signal's own entry candle closes.
- Some strategies close it earlier when their own conditions fail. For example, FVG First Strike closes the window of a conservative signal when the gap is fully filled or price closes beyond it, or when the selected Retest Validity period (see Q45) has run out.
- Only some strategies use a distance limit. FVG First Strike's aggressive mode, for instance, closes the window when price moves beyond a range you set in its inputs. Other strategies have no distance limit, and a fast move toward a Take Profit level does not by itself close a window.
The window never reopens, and it never prevents you from placing a trade in MetaTrader. It only marks where the strategy considers entry optimal (see Part 2, Q43).
The signal itself finishes only when Stop Loss, Take Profit or the trailing stop is reached, or when its broker day ends (see Part 2, Q40). Closing the entry window on its own does not finish the signal — the panel moves from OPEN to ACTIVE, and the signal keeps being tracked until it finishes.
Q53: What does "Signal expired — No trade taken" mean, and how is it decided?
In Trading Mode, when a signal has finished, its entry window has closed, and none of your trades was matched to it, the indicator removes its Entry, SL, RML, TP and trailing lines and leaves a single small grey marker. Hovering over the marker shows Signal expired / No trade taken (see Part 2, Q41).
How it is decided. The indicator keeps a record of which trade belongs to which signal. Trades placed by the matching EA are linked to their signal by the EA; trades you place by hand are linked by symbol, direction, entry price and timing (see Q45). "No trade taken" simply means that, by the time the signal finished, no trade had been linked to it. It is not a live search of your open orders and trade history at the moment the marker is drawn.
What it does not mean. It is not a losing trade, a cancelled or rejected order, or an error in the EA or the indicator. It only records that the signal was not traded. A trade that does not fit the matching rules — for example one placed too far from the signal's entry price — is not matched, so that signal will also show No trade taken.
In Quant Analysis Mode no trades are tracked, so every signal stays fully drawn and this marker does not appear.
Q54: Why can neighbouring signals show different states?
Every signal is tracked separately, so three signals in a row can legitimately look different. For example, the middle signal can show the grey No trade taken marker while the signals before and after it show trade markers or are still ACTIVE. The reasons:
- A trade is matched to one signal only, and only the first trade per signal is recognised (see Part 2, Q43). If two signals appear close together, your trade is matched to one of them; the other, if it finishes without a matched trade, shows No trade taken.
- Each signal's entry window closes at its own time. An older signal can still be ACTIVE while a newer one has already finished.
- A finished signal does not appear in PREVIOUS. That section shows the next older signal that has not finished; once a signal is CLOSED it leaves the panel's PREVIOUS slot, while its drawing on the chart follows the rules in Part 2, Q41.
None of these differences indicates a fault: each signal's state reflects only its own entry window, its own outcome, and whether a trade was matched to it.
See also Q46, Q47 and Q53.
Q55: What does each line and message on the Current Signal Panel mean?
The Current Signal Panel (see Part 2, Q40) is built from a NOW section — the most recent live signal — and, when one exists, a PREVIOUS section for the next older signal that has not finished (see Q51). Each section lists the same rows:
| Row | What it shows |
|---|---|
| Status | OPEN (green), ACTIVE (amber) or CLOSED (red) — see Q51. |
| Direction | BUY (bullish signal) or SELL (bearish signal). |
| Trades | How many of your trades the indicator has matched to the signal (Trading Mode). A dash (—) in Quant Analysis Mode, where trades are not tracked. |
| Entry | The signal's entry price. |
| Stop Loss | The signal's stop-loss price. |
| Signal Time | The broker-server time of the signal's entry (hours:minutes). |
| Signal Age | How long ago that entry was, counted up live — for example 5m12s or 2h5m. |
When there is nothing to show, every row reads a dash.
LIVE TRADES. In Trading Mode, every EdgityCore Indicator adds a LIVE TRADES section below the signal sections. It lists only your currently open trades; closed trades are not shown in the panel and are exported with the Export Trade History button instead. See Q58.
All Signals / Latest Only. In Trading Mode the panel also has two buttons. All Signals (the default) draws every signal on the chart; Latest Only keeps the chart focused on the latest open signal and removes the drawings of the other signals. It changes only what is drawn, and the choice is remembered for each symbol and timeframe (see Part 2, Q40).
The footer line. Under the sections the panel shows one message. The rows below are checked from the top, so only the first matching message appears (the two-line messages are one footer, shown on two lines):
| Footer message | When it appears |
|---|---|
| No active signals. | There is no signal to show. |
| EA trading — entries not tracked. | The product's companion EA is running on this symbol; entries are then managed by the EA and the panel does not track them. |
| Enter now to track this trade. (green) | The optimal entry window is still open (status OPEN) for the NOW or the PREVIOUS signal. A trade you enter now will be matched to it. |
| Signal closed. / No further entries are tracked. (orange) | The signal has finished (status CLOSED). |
| Original entry window has closed. / Further entries are discretionary. (orange) | Quant Analysis Mode, window closed, signal still running. Trades are not tracked in this mode. |
| Optimal entry window has closed. / Your entry is tracked. (orange) | Trading Mode, window closed, signal still running, and one of your trades is already matched to it. |
| Optimal entry window has closed. / A discretionary entry is still possible! (orange) | Trading Mode, window closed, signal still running, no trade matched yet. Your first matching trade is still recognised (see Q46). |
The messages are the same in every EdgityCore Indicator.
Q56: When does the indicator send an alert, and how do the alert channels work?
When an alert is sent. An alert is sent when a new signal is confirmed on the most recent bar — normally the latest closed bar.
Past signals never alert. Signals from earlier in the chart history are drawn and counted in the statistics, but they never generate an alert. Whenever an indicator loads or recalculates it detects past signals again; sending an alert for each of them would flood you with notices about trades that are long over. An alert therefore means one thing only: a new signal has just formed.
How often. Under normal operation, each qualifying signal generates a single alert. Reloading the indicator — including recompiling it, changing the timeframe or restarting MetaTrader — may generate a new alert for the latest qualifying signal.
Channels. Each channel is switched on separately in the Alerts inputs and all are off by default (see the Input Parameters Reference):
| Channel | Behaviour |
|---|---|
| Popup | A MetaTrader alert window with the message. |
| Sound | Plays the .wav file you name; the file must be in the MetaTrader Sounds folder. |
| Push | A notification to the MetaTrader app on your phone (a MetaQuotes ID must be set up). At most one push is sent every 2 seconds — a second one inside that time is not sent. |
| An email using your MetaTrader SMTP settings. The subject is the product name followed by Signal. |
What the message says. Every new-signal alert names the product, the direction (Bullish or Bearish), the symbol and a price. The exact layout and any extra lines differ slightly from product to product — see your product's page.
The Circuit Breaker notice — not a signal alert. In Trading Mode the indicator can send one other kind of notice. When the Circuit Breaker stops new signals for the rest of the broker day, it tells you so. This is not a new signal: it carries no direction, entry or price.
- Same channels. It uses the same Alerts inputs as signal alerts (popup, sound, push, email; all off by default). There is no separate switch.
- Once per broker day, today only. It is sent the first time the Circuit Breaker stops signals on the current broker day. It is not sent for earlier days when the indicator loads or recalculates, and reloading the indicator on the same day may send it again. It is never sent in the Strategy Tester.
- What it says. It is headed by the indicator's name and Circuit Breaker Activated, and reads: The Daily Circuit Breaker has been activated because the daily loss limit has been reached. No further signals will be generated today. Signal generation will automatically resume on the next trading day.
- It does not replace signal alerts. Once the Circuit Breaker has stopped signals for the day, no new-signal alert follows until the next broker day. The Circuit Breaker is described in Part 2, Q36.
Q57: Why are the Take Profit levels calculated from the Stop Loss?
Every trade starts with a Stop Loss — the price at which you accept that the trade was wrong. The distance from your entry price to that Stop Loss is the most you are prepared to lose. EdgityCore calls this distance your risk, or 1R.
A profit target only means something when compared with what you risk to reach it. A 200-point target is attractive if you risk 50 points, but unattractive if you risk 400 points. So instead of placing profit targets at arbitrary price distances, EdgityCore measures every target as a multiple of your risk (R).
For example, with a Stop Loss 100 points from entry (1R = 100 points), using the default settings:
| Level | Multiple of risk | Distance from entry |
|---|---|---|
| RML (Risk Mitigation Level) | 0.5R | 50 points |
| TP2 | 1R | 100 points |
| TP3 | 1.5R | 150 points |
| TP4 | 2R | 200 points |
| TP5 | 2.5R | 250 points |
This approach has important advantages:
- Every trade follows the same risk model.
- Results remain comparable across different markets.
- Statistics such as Net Points and Average R/R become meaningful.
- Position sizing always uses the same definition of risk.
The Stop Loss distance itself may differ between symbols, because markets move differently. But once the Stop Loss has been defined, every target automatically follows from that original risk.
In other words: risk is defined first, and the profit targets are then calculated from that risk. This is one of the fundamental principles of the EdgityCore framework.
Q58: What is the LIVE TRADES section of the Current Signal Panel, and what does Export Trade History do?
The LIVE TRADES section is part of the Current Signal Panel of every EdgityCore Indicator (see Part 2, Q40 and Part 3, Q55) and is shown in Trading Mode only. It is hidden in Quant Analysis Mode, and while the product's companion EA is running on the symbol (the EA then manages the entries).
What the panel shows. The section lists only your trades that are open right now, newest first, four lines each: ticket number with direction (BUY or SELL) and LIVE; Entry; Stop Loss; and the running profit or loss in points and R. Trades that have closed are no longer listed in the panel. The panel is a real-time monitor, so its height depends only on how many trades are open — never on how many trades you have already completed. The section stays on screen while Trading Mode is active; with no open trade it reads No live trades.
The Export Trade History button. The button sits directly below the LIVE TRADES title, so it is always within reach:
| Caption | Meaning |
|---|---|
| Export Trade History | There are no closed trades to export yet. Pressing it shows a message and creates no file. |
| Export Trade History [N] | N closed trades are available. The file will contain exactly those N trades. |
The number counts closed trades only; open trades are never counted. A trade that has just closed is counted as soon as the indicator has read its result from your broker history, so a short delay is possible if the history has not synchronised yet.
Which trades are exported — Daily and Multi-Day. The report contains the closed trades that Trading Mode currently holds:
- Daily counting (default): the trades of the current broker day.
- Multi-Day Statistics enabled (Statistic Period view of the statistics panel): all closed trades of the current counting period.
The report header states the scope (Current broker day or Multi-Day counting period). Trades older than the held window are not part of the file.
The CSV file. It is saved in MQL5\Files\<Product>\Reports\TradeHistory\ and named <Prefix>_TradeHistory_<symbol>_<timeframe>_<date>_<time>.csv , where <Product> is the folder named after your indicator and <Prefix> is its short filename prefix (both are given in your indicator's User Guide). A short header (product, symbol, timeframe, export time, scope, number of trades) is followed by one row per closed trade, in order of entry:
| Column | Content |
|---|---|
| Ticket, PositionId | Your broker's ticket number and position identifier. |
| Symbol, Timeframe | The chart the indicator ran on. |
| Session | DAY, or S1–S3 for the session of the signal. |
| Direction | BUY or SELL. |
| SignalTime | Broker time of the signal's entry bar. |
| OpenTime | When your trade was actually filled, read from your broker history. Empty if the history is not available. |
| CloseTime | When the trade closed. |
| Duration | How long the trade was open (OpenTime to CloseTime), written compactly: 42s under a minute, 31m 23s under an hour, and 1h 12m or 27h 14m from one hour on (seconds are omitted). Empty when OpenTime is empty. |
| EntryPrice, ExitPrice | Your fill price and your closing price. |
| StopLoss_Original | The signal's original Stop Loss. A stop that was later moved by trailing is not recorded here. |
| NetPoints | The result in points. |
| R | The result as a multiple of the original risk (NetPoints divided by the distance from entry to the original Stop Loss). |
| Result | WIN, LOSS or BE (break-even). |
| ExitZone | Where the trade closed relative to the Stop Loss, RML and Take Profit levels — for example Close at SL, Close RML-TP2 or Close at TP3. The report uses these twelve finer zones; the Trading Mode statistics panel groups the same exits into intervals (see Q59). Take Profit prices themselves are not stored per trade. See the Trade History Report Guide for every column. |
| Trailed | Yes when the trade closed on a stop that had been moved by trailing. |
| ManualClose | Yes when you closed the trade yourself. |
Confirmation message. After a successful export the indicator shows a dialog in two lines. The first line carries the full saved location — the product name, Trade History exported to, then MQL5\Files\ followed by the folder and the file name. The second line reads Trades exported: N. The first line is the one MetaTrader shows in the Alerts list, so the saved location is visible without opening the message. If there is nothing to export, a message says that there are no exited trades; if the file cannot be opened or written, an error message is shown instead and no success dialog appears. The Stats, Yearly, CW|CL and DD reports confirm with a single-line message that names the saved file path.
Q59: What do the sections and rows of the Trading Mode statistics panel mean?
This applies to every EdgityCore Indicator in Trading Mode. The statistics panel is organised in sections, selected with the section tabs: Historical Analysis, Performance, Active Filters, Position Sizing and, in Trading Mode only, Statistic Period Counter. In Trading Mode the outcome and performance figures describe your real closed trades, measured from your actual fill price to your actual closing price. Quant Analysis Mode describes simulated signals instead (see Q50).
Historical Analysis. Total Entries, Bullish, Bearish, Resolved and Pending count signals. Every row is shown as a dash and greyed until at least one of your trades has been matched to a signal today. The outcome rows then place each closed trade in exactly one interval, measured in multiples of the original risk (R):
| Row | Where the trade closed |
|---|---|
| Close Below SL | At or below the original Stop Loss |
| Close SL-Entry | Between the Stop Loss and the entry price |
| Close Entry-RML | From the entry price up to, but not including, the Risk Mitigation Level |
| Close RML-TP2 | From the RML up to, but not including, Take Profit 2 |
| Close TP2-TP3 | From Take Profit 2 up to, but not including, Take Profit 3 |
| Close TP3-TP4 | From Take Profit 3 up to, but not including, Take Profit 4 |
| Close TP4-TP5 | From Take Profit 4 up to, but not including, Take Profit 5 |
| Close Above TP5 | At or beyond Take Profit 5 |
| Closed Manually | Trades you closed yourself (terminal, mobile or web). These are also counted in the interval where they closed |
A count may be followed by | Trail : N — how many of those trades had the trailing stop enabled when they closed (a reporting sub-count; it does not move a trade between rows). Win Rate, W / L, Net Points, Avg/Trade, Max Drawdown, Max CW / CL, Profit Factor and Avg R/R are calculated from the same real trades, in the symbol's own points. Of that Trailing Points is the part of Net Points that came from trades with the trailing stop enabled. The Trade History export (Q58) uses finer zones, for example Close at SL or Close at RML, for the same trades.
Performance. The Performance section shows Expectancy (average result per trade, in R), Risk of Ruin, Sharpe Ratio, Sortino Ratio and Trades analyzed. In Trading Mode they are calculated from your real trades, each measured as a multiple of its own risk. Sharpe and Sortino are trade-based, with a risk-free rate of zero, and are not annualised. Risk of Ruin is an approximation based on a fixed risk per trade (the Percentage of account to risk per trade input). A metric that cannot be calculated shows N/A.
Risk of Ruin needs a reasonable sample, so in Trading Mode it is hidden until a minimum number of trades has been analysed. Until then the row reads Available after N analysed trades. The minimum is set by the input Performance View: min trades for advanced stats (10-500), default 30. It changes only what is displayed; the statistics keep accumulating.
Active Filters. This section lists the settings currently in force — for example Mode: Trading, Circuit Breaker: ON or OFF with its limit, the daily and per-session signal limits and directions, Tolerance for strategies that use a retest, and EOD: ON or OFF. It only reads your settings; it has no inputs of its own.
Statistic Period Counter. This section (Trading Mode only) sets how long the Trading Mode statistics accumulate. The button toggles between Multi-Day Statistics: DISABLED — Counting: Daily (current broker day), statistics reset each broker day — and Multi-Day Statistics: ENABLED — Counting: Multi-Day (cumulative), statistics accumulate across days from the start date shown, until you press Reset Statistics. The Trade History export follows the same setting (Q58).
Reports in Trading Mode. The Yearly button is greyed out in Trading Mode — use Quant Analysis Mode for the Yearly Report. The CW|CL button is greyed out while the Circuit Breaker is enabled, which is the default in Trading Mode (Part 1, Q15). Stats and DD remain available, and Export Trade History is available from the LIVE TRADES section (Q58).
© 2026 Marc Quentier. All Rights Reserved. This document is part of the EdgityCore Suite. No part of this publication may be reproduced, distributed or transmitted in any form or by any means without the prior written permission of the copyright holder, except as permitted by applicable copyright law.




