
Questions & Answers — Part 2
This page continues the EdgityCore indicator Q&A. It covers detailed trailing-stop behaviour, the Yearly CSV export, instrument compatibility, configuration profiles, the DD (Drawdown) export, the Daily Circuit Breaker, and Trading Mode / Quant Analysis Mode (indicator-specific), followed by the chart-line display options, the Current Signal Panel, Signal Duration and Visibility, Exit Strategy, and the Trade Window. For signal detection, session configuration, and the core statistics panel see Part 1. Manual-trade association, the signal lifecycle, alerts, and the Trade History export continue in Part 3. The terminology used throughout this page follows the EdgityCore Customer Terminology Policy (FP-041).
| # | Question | Topic |
|---|---|---|
| Q25 | Why does my TP5 Hits counter always show 0 — and is the trailing stop working correctly? | TP5 Hits = 0 with Trail Exits > 0 is correct and expected when the trail arms at TP5 and takes precedence over the fixed TP5 exit. |
| Q26 | The Yearly CSV export shows empty rows for some years — why? | Two settings must align with the batch export range: LookbackDays must be large enough, and the date range filter must cover the years being exported. |
| Q27 | A signal shows RML Hit even though price visually reached a higher TP — why? | The trail step is too tight for the symbol — causing the trailing stop to exit on normal noise before higher TPs are reached. Increase the trail step in the Strategy Panel. |
| Q28 | What does the trailing stop actually do — and how do I choose when it activates? | Plain-language explanation of all trailing configurations, the fix vs trail panel display, and how to choose the right activation objective for your instrument and session. |
| Q29 | I trade both forex pairs and indices — do I need separate configurations, and how do I switch between them efficiently? | Yes — use two .set files, one for forex/XAUUSD and one for indices. Save and load them from the Inputs tab in MT5. |
| Q30 | Which instrument types does EdgityCore support — and does it work on cryptocurrencies? | Forex pairs, XAUUSD, indices, and commodities/metals with Digits=2 are supported. Cryptocurrencies are not supported. Always verify the Digits value in MT5 Symbol Specification before configuring a new instrument. |
| Q31 | What does the DD export contain and how do I use it? | The DD button exports a drawdown depth and recovery analysis — four sections covering the summary, top 5 events, recovery profile, and risk context. |
| Q32 | How is a drawdown event defined in the DD report? | A drawdown starts at the equity peak and ends when cumulative equity returns to or exceeds that peak. Duration is measured in calendar days from peak to recovery. |
| Q33 | Why does the DD report show a high number of Total DD Events? | Every decline below a prior equity peak is recorded as a separate event — including short, shallow dips after new equity highs. This is correct and expected for a strategy with a high win rate. |
| Q34 | What is the difference between Average DD Duration and Average Recovery Time? | DD Duration measures peak to recovery. Recovery Time measures trough to recovery. They answer different questions about drawdown behaviour. |
| Q35 | What do the Representativeness and Recovery Profile assessments mean in the DD report? | Both use transparent, data-driven thresholds applied to measured ratios — no subjective judgement. The exact rules are documented below. |
| Q36 | What is the Daily Circuit Breaker and what happens when it is triggered? | Once the Daily Loss Limit is reached, the indicator stops creating new signals for the rest of the broker day. Existing signals are not changed, and signal creation resumes at the next broker day. |
| Q37 | What are Trading Mode and Quant Analysis Mode? | Trading Mode is for live trading — analysis window pinned to today onward. Quant Analysis Mode is for historical research, with a choice between the unrestricted Raw Strategy and Strategy with Circuit Breaker. |
| Q38 | Why are the SL and TP lines on some signals drawn in grey? | Grey marks a completed losing signal — one that hit its stop loss without ever reaching a profit milestone. The entry arrow keeps its direction colour so you can still read bull vs bear at a glance. |
| Q39 | What does "Extend lines until each level is hit" do, and how do I stop the chart filling with lines? | With it on, each SL/TP/trailing line stretches to the exact bar where price reached that level. "Extend last N trades (0 = all)" limits that behaviour to the most recent N signals. |
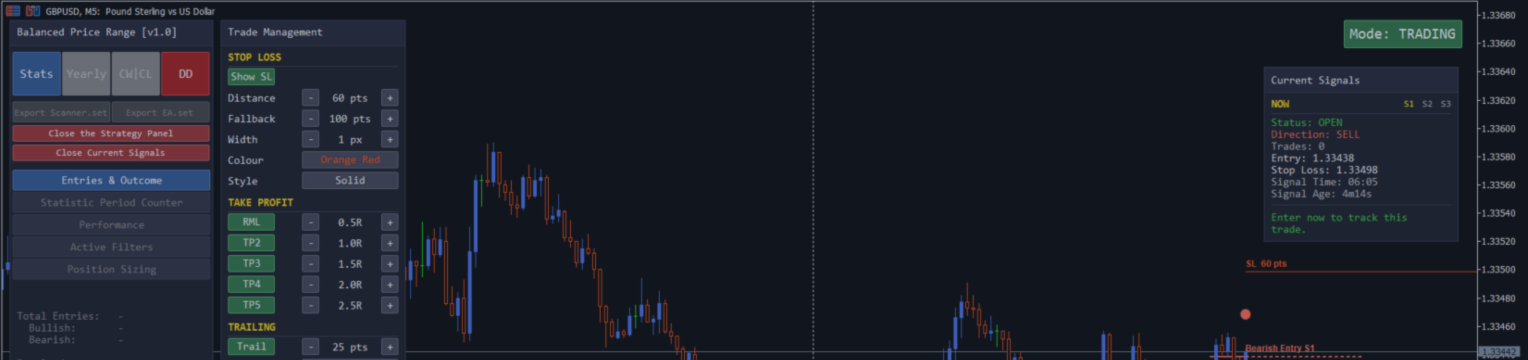
| Q40 | What is the Current Signal Panel? | An optional small on-chart panel (separate toggle, default hidden) that surfaces the most recent live/active signal at a glance, without scrolling to find it on the chart. In Trading Mode it also hosts LIVE TRADES and the All Signals / Latest Only buttons. |
| Q41 | What do Signal Duration and Signal Visibility control? | The Trade Window marks the signal's engineered optimal-entry period; a first manual trade is recognised for as long as the signal has not closed (see Q43). In Trading Mode, a completed signal with no trade taken is reduced to a single grey marker; traded signals keep their normal drawing. Neither setting affects detection, statistics, or export. |
| Q42 | What is Exit Strategy, and what do the Entry / Retest / Breakout / Pullback labels mean? | Exit Strategy selects the exit-management ladder (currently one: RML/TP2-5). The Entry-line label is the Execution Label — it names how that indicator's own strategy executes (e.g. immediate Entry vs a Retest of a level), fixed per indicator. |
| Q43 | What is the Trade Window? | A per-signal period marking the strategy's engineered optimal entry. It never restricts what you can actually execute in MetaTrader. A matching manual trade is recognised for Trading Mode statistics for as long as the signal has not closed — including after the optimal-entry window has passed — and only the first trade is recognised (see Part 3, Q44). |
Q25: Why does my TP5 Hits counter always show 0 — and is the trailing stop working correctly?
Yes — TP5 Hits = 0 with Trail Exits > 0 is correct and expected behaviour with the default settings. It is not a bug. Here is why.
This answer describes the Quant Analysis Mode panel. In Trading Mode the panel counts your own closed trades in interval rows, with the trailing stop shown as a Trail sub-count (see Part 3, Q59).
By default, TP5 and the trailing stop activation are set to the same level: 2.5R. When price reaches 2.5R, the indicator has to choose one outcome — and the trail always takes priority over TP5. The trail wins because it can potentially capture far more than TP5 if price keeps running.
Think of it this way: TP5 is the point where the trail arms, not a fixed exit. Once the trail is active, the trade has no fixed ceiling — it runs until price reverses by one trail step.
Three concrete examples
Example 1 — Default settings, trail captures more than TP5
SL=200 pts, TP5=2.5R (+500 pts), trailing Activation = TP5, trail step=25 pts. Price reaches +500 pts → trail arms. Price continues to +620 pts → trail stop locks at +595 pts. Price reverses → trade exits at +595 pts. Panel records: Trail Exit +1, TP5 Hits=0. Net points=+595 — more than TP5 would have given.
Example 2 — Default settings, trail exits below TP5
Price reaches +500 pts → trail arms at +500 pts, trail stop set to +475 pts. Price immediately reverses → trade exits at +475 pts. Panel records: Trail Exit +1, TP5 Hits = 0. Net points = +475 — slightly less than TP5, but the RML already moved the SL to entry so there was no loss risk.
Example 3 — Trailing stop turned off, TP5 closes the trade
Turn the trailing stop off in the Strategy Panel. Price reaches +500 pts → trade is recorded as closed at TP5. Panel records: TP5 Hits +1, Trail Exits = 0. Net points = +500 — fixed exit every time.
Which configuration should I use?
| Goal | Configuration | What you will see |
|---|---|---|
| Let the trail run and capture extended moves | Leave the Strategy Panel defaults — trailing on, Activation = TP5. | TP5 Hits = 0. Trail Exits = N. Net points vary per trade. |
| Fixed exit at TP5 every time | Turn the trailing stop off in the Strategy Panel. Price reaching TP5 is recorded as a TP5 hit and the trade closes. | TP5 Hits = N. Trail Exits = 0. Net points fixed at 2.5R per winning trade. |
| Trail arms earlier than TP5 | In the Strategy Panel, set the trailing Activation to TP2. The trail takes over from TP2 onwards. | TP2 Fix/Trail counts appear. Higher TP levels show trail counts. Net points reflect the actual trail exit price. |
The default configuration — trail arms at TP5 — is the one validated across historical data for each instrument and produced the historical performance metrics documented for the validated test configuration. TP5 Hits showing 0 is simply the statistical signature of a correctly configured trailing stop.
For a full explanation of what Fix and Trail mean in the panel, and how to choose the right trail step distance for your instrument, see the Statistics Panel reference.
Q26: The Yearly CSV export shows empty rows for some years — why?
The Yearly export reads directly from the in-memory entry cache — it does not re-scan bars at export time. If a year shows empty rows or zeros, it means that year's entries were never loaded into the cache. Two independent settings control what ends up in the cache, and both must align with your batch export range.
Issue 1 — LookbackDays is too small
The Days of history to scan and draw setting limits how far back the cache build goes. If set to 365, only the last year of bars is processed — entries from earlier years are never loaded, regardless of what the Statistic Export Range says.
Example: LookbackDays=365 → only the most recent year in cache, all earlier rows empty. LookbackDays=4500 (default) → all years from 2015 populated for forex pairs (11 years), all years from 2018 populated for indices (7 years).
Fix: Keep LookbackDays at 4020 or higher for a full export.
Issue 2 — Date range filter excludes the export years
If Restrict signals and statistics to this date range is enabled, only days within the configured start and end dates are accepted into the cache. Days outside that window are skipped even if LookbackDays is large enough to reach them.
Example: date range set to 2026.01.01–2026.12.31 → all prior years empty in the export. Date range set to 2015.01.01–2025.12.31, or filter disabled → all years populated.
Fix: Before clicking the Yearly button, either disable the date range filter or set it to match the full export period (e.g. 2015.01.01 – 2025.12.31). After the export, restore your live trading date range.
The correct setup for a full Yearly export
- LookbackDays = 4020 or higher
- Restrict signals and statistics to this date range = false, OR set start date and end date to match the full export period
- Statistic Export Range: Yearly export first year and last year set to the desired range (e.g. 2015–2025 for forex, 2018–2025 for indices)
All three must be consistent. The Statistic Export Range defines what you want. LookbackDays and the date range filter define what is actually available in the cache. If they conflict, the export silently returns zeros for the missing years.
Q27: A signal shows RML Hit even though price visually reached a higher TP — why?
A common cause is that the trailing stop step distance is too tight for the symbol you are trading.
Here is what happens in detail. When the trailing Activation is set to a TP level (for example TP2), the trail arms the moment price reaches TP2. From that point, the trailing stop follows price at a distance of one trail step. If the trail step is very small relative to the symbol's normal volatility, even a minor pullback — well within normal noise — will fire the trail exit before price has a chance to reach TP3, TP4, or TP5.
How the statistics record it: when the trail is armed at TP2 and subsequently fires, the outcome is recorded as TP2 Hit — not RML Hit, not Trail Exit. The TP level reached is permanently stamped the moment the trail arms, so the statistics correctly reflect the highest level reached regardless of the exit mechanism.
If you are seeing a lower level recorded than the one price visually reached, increase the trail step distance in the Strategy Panel. The recommended value for XAUUSD is 150 pts; for standard forex pairs on M15, 25 pts is appropriate. A step that is too tight exits on noise rather than on a genuine reversal.
Q28: What does the trailing stop actually do — and how do I choose when it activates?
The trailing stop is a dynamic exit mechanism. Instead of closing a trade at a fixed price target, it follows price as it moves in your favour — and only closes the trade when price reverses by a defined amount (the trail step). This allows winning trades to run further than any fixed TP level would allow.
The only decision you need to make is at which objective the trailing stop starts following price. This is the Activation setting in the Strategy Panel's Trailing section — RML, TP2, TP3, TP4 or TP5.
No trail (trailing turned off in the Strategy Panel) — every winning trade closes at a fixed TP level, whichever price reaches first. TP5 is the final ceiling. Use this when you want predictable, fixed exits. Panel shows: TP5 Hits populated.
Activation = TP5 (default, recommended) — the trail arms when price reaches TP5 (2.5R). Instead of closing at the fixed TP5 price, the trail follows price upward and only closes when price reverses by one trail step. TP5 becomes the starting gun rather than the exit. Panel shows: TP5: 0 fix / N trail (+avg pts). Historical testing showed this to be the strongest-performing default configuration across the validated instrument portfolio.
Activation = TP2, TP3, or TP4 — the trail arms earlier, at the chosen TP level. Protects profit sooner but also risks being stopped out on a normal pullback before price reaches bigger moves. With Activation = TP3, the panel shows for example: TP3: 2 fix / 986 trail (+736 avg), TP4: 0 fix / 129 trail (+1253 avg). Always backtest your specific symbol and session before choosing an earlier activation over the default.
Activation = RML — arms at the earliest possible point (0.5R). Maximum protection but highest risk of being stopped out on noise. Only use if backtest data clearly shows it outperforms later activation objectives on your specific setup.
| Activation | Trail arms at | Can capture | Panel shows |
|---|---|---|---|
| No trail | Never | Up to TP5 (2.5R) — fixed | TP5 Hits populated |
| TP5 | TP5 (2.5R) | Beyond 2.5R — unlimited | TP5: 0 fix / N trail (+avg) |
| TP4 | TP4 (2.0R) | Beyond 2.0R — unlimited | TP4/5: fix / trail counts |
| TP3 | TP3 (1.5R) | Beyond 1.5R — unlimited | TP3/4/5: fix / trail counts |
| TP2 | TP2 (1.0R) | Beyond 1.0R — unlimited | TP2/3/4/5: fix / trail counts |
| RML | RML (0.5R) | Beyond 0.5R — unlimited | RML/TP2/3/4/5: fix / trail counts |
For a full explanation of what Fix and Trail mean in the panel, and how to choose the right trail step distance for your instrument, see the Statistics Panel reference.
Q29: I trade both forex pairs and indices — do I need separate configurations, and how do I switch between them efficiently?
Yes. Forex pairs and index instruments require different indicator configurations — at minimum the SL point multiplier (1 for forex/XAUUSD, 100 for indices with Digits=2) and the per-symbol SL table differ between the two instrument types. Session times may also differ if you trade index instruments during their own market open windows rather than the standard London and New York sessions.
Reconfiguring these inputs manually each time you switch instrument type is slow and error-prone. The clean solution is to save two separate .set files in MT5 and load the appropriate one in two clicks. A .set file covers the Inputs; Trade Management (stop loss, RML, Take Profit, trailing) is a separate Strategy Profile ( .str ) saved from the Strategy Panel.
How to save a .set file
- Attach the indicator to a chart and configure the inputs for your forex/XAUUSD profile — multiplier=1, your forex per-symbol SL table entries, forex session times.
- In the Inputs tab, click Save and name the file EdgityCore_Pairs.set.
- Reconfigure for your indices profile — multiplier=100, your index per-symbol SL table entries in trader points, index session times if different.
- Click Save again and name it EdgityCore_Indices.set.
MT5 saves .set files in the MQL5\Presets folder inside your data folder (File → Open Data Folder to access it).
How to load a .set file
- Double-click the indicator in the Navigator, or right-click the chart and select Indicators List → Edit.
- In the Inputs tab, click Load and select the profile you need.
- Click OK — all parameters update instantly and the panel recalculates.
| Setting | EdgityCore_Pairs.set | EdgityCore_Indices.set |
|---|---|---|
| SL point multiplier | 1 | 100 |
| Per-symbol SL distances | EURUSD=200, GBPUSD=300, XAUUSD=500, etc. | UK100=100, DAX40=150, JPN225=200, etc. (in trader points) |
| Session times | London 07:00–10:00, New York 13:00–16:30 | Adjust to match each index's market open if needed |
The trailing step distance is part of Trade Management, not the .set file — set it in the Strategy Panel (25 pts default, 150 for XAUUSD; validate per instrument via backtest) and save it as a Strategy Profile.
Always run the statistics panel on a new index instrument before going live — verify win rate, profit factor, and max drawdown under the index configuration the same way you would for a new forex pair.
Q30: Which instrument types does EdgityCore support — and does it work on cryptocurrencies?
EdgityCore indicators support any instrument where the broker's point size maps cleanly to one of the two available multiplier values (1 or 100). The determining factor is the Digits value in the MT5 symbol specification — not the instrument category name.
| Digits value | Multiplier to use | Typical instruments | Supported |
|---|---|---|---|
| 5 | 1 | Forex pairs (EURUSD, GBPUSD, USDCAD…), XAUUSD on most brokers | ✓ |
| 3 | 1 | JPY pairs (GBPJPY, EURJPY…) | ✓ |
| 2 | 100 | Indices (UK100, DAX40, JPN225, US30, NAS100, SP500), commodities and metals quoted with 2 decimal digits (WTI, XAGUSD, etc. — broker-dependent) | ✓ |
| 0 or 1 | No valid multiplier | Cryptocurrencies (BTCUSD, ETHUSD…) on most brokers | ✗ Not supported |
Why cryptocurrencies are not supported
Crypto instruments on most brokers have Digits=0 or Digits=1 — neither multiplier value (1 or 100) produces correct internal point calculations. Beyond the point size issue, the fixed-SL model used by EdgityCore indicators is a poor fit for the extreme volatility of crypto markets, and the session-based logic (London open, New York open) has no equivalent meaning on instruments that trade 24 hours a day, 7 days a week. Cryptocurrency support has not been validated and would require dedicated testing together with a purpose-built configuration.
Digits are broker-dependent — always verify
The same instrument can have different Digits on different brokers. XAGUSD (Silver) may be Digits=3 on one broker and Digits=2 on another. WTI Crude Oil may be Digits=2 or Digits=3. Never assume — always check the symbol specification in your MT5 terminal before configuring a new instrument.
How to check Digits in MT5: right-click the symbol in the Market Watch window → Specification. The Digits field is listed in the specification table.

If your instrument has Digits=2 → set the multiplier to 100 and enter SL values as you see them on screen (trader points). If Digits=5 or Digits=3 → set the multiplier to 1. If Digits=0 or Digits=1 → the instrument is not supported.
Q31: What does the DD export contain and how do I use it?
The DD button (red, fourth button in the top panel row) exports a drawdown depth and recovery analysis. The file is saved automatically to MQL5\Files\<ProductName>\Reports\DD\ with the filename format <prefix>_DD_SYMBOL_TF_timestamp.csv (see Part 1, Q14 for the full file-path convention).
This report is calculated from historical market data using your current strategy configuration. It measures the historical drawdown behaviour of the strategy's detected signals and is intended for quantitative strategy analysis — it does not represent the drawdown of an actual trading account. When the Daily Circuit Breaker is enabled, only the historical signals permitted under the configured Circuit Breaker rules contribute to the calculations.
It is structured in four sections:
Drawdown Summary — six headline metrics: Total DD Events, Max Drawdown (in points and as a multiple of the SL distance), Median Drawdown, Average Drawdown, Longest DD Duration, and Average DD Duration — all in calendar days.
Top 5 Drawdown Events — the five deepest drawdowns in the backtest ranked by depth, each showing Start Date, Trough Date, Recovery Date (or "Open" if unresolved), Depth in points, Duration in calendar days, number of signals that occurred during the drawdown, and recovery status.
Recovery Analysis — Average Recovery Time and Longest Recovery Time in calendar days (measured from trough to recovery, for recovered events only), plus the count of open drawdowns at the end of the test with a plain-English assessment.
Risk Context — the three largest drawdowns side by side with both their point depth and dollar value at the current DD-based lot size, a Representativeness assessment, and a Historical DD Impact line showing the max drawdown as a percentage of your configured account size.
Use the DD report to answer questions like: "What was the worst historical drawdown on GBPUSD M15 and how long did it take to recover?" or "Is the largest drawdown an isolated outlier or typical of this strategy's normal risk profile?"
Q32: How is a drawdown event defined in the DD report?
A drawdown event begins at the moment cumulative equity falls below its previous peak and ends when cumulative equity returns to or exceeds that peak. All measurements are based on the cumulative points equity curve — the running sum of all classified entry outcomes.
Duration is measured in calendar days from the equity peak (drawdown start) to the recovery date. Same-day peak-and-recovery events are recorded as 0 days — this is mathematically correct and avoids inflating duration statistics.
Open drawdowns at the end of the test are included in all averages using their duration up to the last signal date. Excluding them would systematically understate average duration, particularly if the test ends during a prolonged drawdown. Open events are flagged clearly in the Top 5 table with status "Open" and a recovery date of "Open".
Recovery time is measured separately from duration — it runs from the trough (deepest point of the drawdown) to the recovery date, not from the peak. This answers the question "how long did it take to climb back from the worst point?" which is distinct from the total time underwater.
Why a drawdown period can still be net profitable
A common source of confusion: if you isolate the exact date window of a drawdown event and examine the statistics panel, you will often find that the strategy was net profitable during that same period. This seems contradictory — how can equity be in drawdown while the signals are making money?
The answer lies in what the drawdown is measuring. The cumulative equity curve accumulates every classified entry since the beginning of the backtest. A drawdown event begins when that long-running cumulative total falls below its previous all-time high. That gap to the previous peak may have been created partly by losses that occurred before the event start date.
Think of it like a loan balance. The drawdown depth is the outstanding balance — the gap between the current equity level and the previous peak. That balance may have built up over weeks or months before the event window begins. The signals within the event window are the repayment activity — they may be profitable in isolation while still working to close a gap that existed before they started.
This is also why the Recovery Analysis section matters. A short Average Recovery Time means the gap to the previous equity peak closes quickly — the strategy does not stay underwater for long once it starts recovering.
Q33: Why does the DD report show a high number of Total DD Events?
Every decline below a prior equity peak is recorded as a separate drawdown event — including very short, shallow dips that occur after a new equity high is set. This is intentional: the report captures the full picture of drawdown behaviour without filtering or smoothing.
For a strategy with a high win rate, a large number of DD events is structurally expected. Every loss that occurs when equity is at or near its peak starts a new drawdown. Since a portion of signals are losses, equity frequently dips below the previous high before recovering on the next winning signal. Most of these events are brief — Average DD Duration across validated instruments is typically 2–4 days.
The meaningful metrics are not the event count but the depth and duration figures. A strategy with many DD events and a short average duration is behaving very differently from a strategy with few events and a long average duration — even though the second looks "cleaner" on paper. The DD report gives you the complete picture to make that distinction.
Refer to your indicator's documentation for instrument-specific DD event counts, average durations, and example drawdown windows with full panel analysis.
Q34: What is the difference between Average DD Duration and Average Recovery Time?
They measure two different phases of a drawdown:
| Metric | Measured from | Measured to | What it answers |
|---|---|---|---|
| Average DD Duration | Equity peak (DD start) | Recovery date | How long is the account typically underwater? |
| Average Recovery Time | Trough (deepest point) | Recovery date | How long does it take to climb back from the worst point? |
Both are measured in calendar days. Average Recovery Time will always be less than or equal to Average DD Duration — recovery time is a sub-period of the full drawdown duration.
A strategy with Average DD Duration = 3.2 days and Average Recovery Time = 0.9 days is telling you that drawdowns typically last about 3 days in total but that the worst point is usually recovered within 1 day — meaning most of the drawdown period is a shallow drift rather than a steep decline. This is a healthy profile consistent with a high win rate, fast-recovery strategy.
Q35: What do the Representativeness and Recovery Profile assessments mean in the DD report?
Both assessments follow a fully transparent, data-driven framework — fixed thresholds applied to measured ratios. Every assessment can be reproduced manually from the raw values in the report.
Representativeness (Risk Context section)
Answers: is the largest drawdown an isolated outlier or broadly consistent with the rest of the history?
| Ratio (1st DD / 2nd DD) | Label | Meaning |
|---|---|---|
| < 1.30 | Representative | The largest drawdown is broadly consistent with other major drawdowns. |
| 1.30 – 1.75 | Elevated | The largest drawdown is noticeably larger than other major drawdowns. |
| ≥ 1.75 | Outlier | The largest drawdown is a significant outlier relative to the rest of the history. |
Recovery Profile (Recovery Analysis section)
Answers: how quickly does the strategy typically recover from a drawdown trough?
| Average Recovery Time | Label | Meaning |
|---|---|---|
| ≤ 3 days | Rapid Recovery | Historical drawdowns have generally recovered quickly. |
| 4 – 10 days | Moderate Recovery | Historical drawdowns typically recover within a reasonable timeframe. |
| > 10 days | Slow Recovery | Historical drawdowns have historically required extended recovery periods. |
Historical DD Impact (Risk Context section)
Answers: how large was the maximum historical drawdown relative to the configured account size?
| Max DD as % of account | Label | Meaning |
|---|---|---|
| < 5% | Conservative | Historical drawdown remained relatively small compared with account size. |
| 5 – 10% | Moderate | Historical drawdown represents a meaningful but manageable portion of account size. |
| 10 – 20% | Significant | Historical drawdown consumed a substantial portion of account capital. |
| ≥ 20% | Aggressive | Historical drawdown represented a large percentage of account capital. |
All dollar values in the Risk Context section are calculated at the DD-based lot size shown in the report. Apply your broker or prop-firm rules separately before drawing conclusions about capital requirements.
Q36: What is the Daily Circuit Breaker and what happens when it is triggered?
The Daily Circuit Breaker protects you from a bad day getting worse. While it is enabled, it monitors the outcome of completed signals during the current broker day. Each completed signal that reaches its Stop Loss before reaching the Risk Mitigation Level adds one to the consecutive-loss count, and a signal that reaches the Risk Mitigation Level or a Take Profit resets the count to zero. Open signals do not contribute to the count.
What exactly happens when the Circuit Breaker reaches the Daily Loss Limit? When the consecutive-loss count reaches the configured Daily Loss Limit, the indicator stops creating new signals for the remainder of the current broker day. No new signal is drawn, counted in the statistics, exported or sent as a signal alert. Signals that already exist are not removed or modified: they stay on the chart and continue to follow their own Stop Loss and Take Profit levels. The count restarts at the next broker day and signal creation resumes automatically.
Which switch controls it? The Circuit Breaker has two independent switches: Circuit Breaker (Trading Mode) (on by default) and Circuit Breaker (Quant Mode) (off by default). Both use the same Circuit Breaker Daily Loss Limit, and setting that limit to 0 turns the Circuit Breaker off.
Will I be told? In Trading Mode, yes. The first time the Circuit Breaker stops signals on the current broker day, the indicator sends one notice through the alert channels you switched on in the Alerts inputs (popup, sound, push, email). It is headed by the indicator's name and Circuit Breaker Activated, and reads: The Daily Circuit Breaker has been activated because the daily loss limit has been reached. No further signals will be generated today. Signal generation will automatically resume on the next trading day. The notice is for today only: it is not sent for earlier days when the indicator loads or recalculates, and reloading the indicator on the same day may send it again.
Statistics computed while the Circuit Breaker is enabled restart their own consecutive-streak counters at the same broker-day boundary.
Disabling the Circuit Breaker removes this restriction entirely — every signal is eligible, and statistics (including Max CL) reflect the true unrestricted historical behaviour. See Q37 for how this is controlled through Trading Mode and Quant Analysis Mode.
When using the Indicator together with the Scanner or EA, keep the Circuit Breaker configuration (enabled/disabled state and maximum daily loss-streak setting) aligned wherever comparable behaviour is expected. Trading Mode and Quant Analysis Mode are Indicator-specific analytical concepts and do not exist on the Scanner or EA.
Important: The Circuit Breaker is a strategy risk-control feature. It does not replace broker, prop-firm, or account-level drawdown rules, which must be applied separately.
Q37: What are Trading Mode and Quant Analysis Mode?
The Indicator operates in one of two modes, selected by input or by the on-panel mode button:
Trading Mode (default) — intended for live trading.
- The Circuit Breaker is on by default and has its own switch, Circuit Breaker (Trading Mode). The Daily Loss Limit sets the maximum daily consecutive-loss threshold and is shared with Quant Analysis Mode, where the switch is Circuit Breaker (Quant Mode) (off by default). The CW|CL export is available in Trading Mode only while the Circuit Breaker is disabled.
- The analysis window is forced to start from the current broker day and stays open-ended (no end date).
- Statistics describe your own trades, matched to signals, for the current broker day onward (see Part 3, Q59).
- The Performance section hides advanced figures such as Risk of Ruin until the minimum number of trades set by Performance View: min trades for advanced stats (default 30, range 10-500) has been analysed. Quant Analysis Mode always shows them.
- The Statistic Period Counter can count several days together (Multi-Day) instead of the current broker day, and the Active Filters section confirms the mode and the settings in force.
- The Current Signal Panel adds a LIVE TRADES section with Export Trade History, and the All Signals / Latest Only buttons (see Q40).
Quant Analysis Mode — intended for historical research over a custom date range, with a further choice:
- Raw Strategy — Circuit Breaker disabled. All historical signals are included, and statistics represent the unrestricted strategy. Maximum Consecutive Losses represents the true historical worst-case losing streak.
- Strategy with Circuit Breaker — Circuit Breaker enabled at your configured threshold. Only signals eligible under that Circuit Breaker belong to the analysed strategy. Statistics are computed exclusively from those eligible signals.
- Every completed signal stays on the chart, your trades are not matched, and there is no LIVE TRADES section or All Signals / Latest Only choice.
The two modes also measure different things: Trading Mode shows the signal lifecycle, while Quant Mode classifies each entry by the highest performance level achieved so far — see Part 3, Q50.
For a complete plain-language explanation of both modes, see EdgityCore - Understanding Trading Mode and EdgityCore - Understanding Quant Analysis Mode.
Q38: Why are the SL and TP lines on some signals drawn in grey?
Grey is the completed-loss presentation. A signal's stop loss, take-profit and trailing lines — together with its retest reference line — turn grey once that signal has resolved as a clean loss: the stop loss was hit and no profit milestone (RML or any higher TP) was ever reached first.
Signals that reached at least one profit level before any later reversal keep their normal bull or bear colours, even if price later returned to the original stop price — under the Signal Lifecycle these resolve at the highest level reached, and the statistics count them as wins, so their lines stay coloured to match.
In every case the entry arrow keeps its direction colour (green for a bullish entry, red for a bearish entry). Direction stays readable at a glance regardless of how the signal resolved; only the level lines change state.
This behaviour is controlled by Display losing trades in gray (on by default). Turn it off to keep every signal's lines in their normal colours.
Q39: What does "Extend lines until each level is hit" do, and how do I stop the chart filling with lines?
Extend lines until each level is hit (off by default) changes how the stop-loss, take-profit and trailing-activation lines are drawn. With it off, every line runs a fixed number of bars forward from entry (TP/SL line length (bars), default 50). With it on, each line instead stops at the exact bar where price first reached that level — so the drawing shows you precisely where each stop or target was mitigated. A level that has not been reached yet keeps the fixed length until it is.
The search now runs all the way to the level's real hit bar or to the end of chart data — it is no longer capped at the fixed bar count, so a target hit long after entry is still drawn to the correct bar.
Because, with it on, every historical signal is drawn this way, a chart with a long history can accumulate a lot of extended lines. Extend last N trades (0 = all) limits the extend-to-hit behaviour to the most recent signals:
- 0 (default) — every signal extends its lines to the actual hit bar.
- 5 — only the five most recent signals extend to the hit bar; older ones fall back to the fixed forward length.
This is a presentation setting only. It does not affect signals, entries, outcomes, statistics, or exports, and it never changes the entry arrow.
Which levels are drawn. Separately from the line length, the Completed Trades row of the Strategy Panel chooses what the chart shows of a signal's levels: All levels (the default), or only the Reached Levels (the entry, the Stop Loss and the Take Profit levels that price has actually reached). It applies in both modes and, in Trading Mode, to the levels of your LIVE TRADES as well.
Q40: What is the Current Signal Panel?
The Current Signal Panel is a small, optional on-chart panel — a separate toggle button, hidden by default — that surfaces the most recent live or active signal at a glance: direction, entry price, current SL/TP levels and status, without needing to scroll the chart to find it. A signal stays on the panel for as long as it remains valid — including after its trading session has ended — until it closes (Stop Loss, Take Profit or trailing stop reached) or its broker day ends.
It is a pure presentation convenience. It reflects the same signal data the main statistics panel and every chart drawing already use; showing or hiding it never changes signal detection, statistics, or export.
In Trading Mode the panel also contains a LIVE TRADES section, which lists your open trades and carries the Export Trade History button (see Part 3, Q58), and two buttons, All Signals and Latest Only. All Signals (the default) draws every signal on the chart; Latest Only keeps the chart focused on the latest open signal and removes the drawings of the other signals. It changes only what is drawn, and the choice is remembered for each symbol and timeframe. In Quant Analysis Mode the panel has neither: every signal is always drawn.
Q41: What do Signal Duration and Signal Visibility control?
Signal Duration refers to the Trade Window (see Q43) — the per-signal period marking the strategy's engineered optimal entry.
The Signal Visibility After Close (bars, 0 = unlimited) input needs no action — it can be left at its default. How a completed signal is drawn is decided automatically:
Trading Mode
- Completed, with an associated trade — the trade visualization remains available according to the normal Trading Mode presentation: the trade marker with its ticket, and the trade's levels.
- Completed, no associated trade — once the signal has resolved and its Trade Window has closed without any associated trade, its Entry, SL, RML, TP and trailing levels are removed from the chart. The signal is represented by a single small grey marker at its entry marker position. Hovering over the marker displays:
Signal expired
No trade taken - Still active — a signal that has not yet resolved keeps its full drawing.
Quant Analysis Mode — every completed signal remains drawn with its entry marker and all its levels.
The grey marker keeps the chart readable when several signals expire untraded, while preserving a visual record that each signal existed. It does not mean a losing, cancelled or rejected trade — it only records that the signal expired without a trade. (For grey SL/TP lines on a traded loss, see Q38.)
In Trading Mode the Latest Only button (see Q40) goes one step further and keeps only the latest open signal's drawings on the chart.
Neither setting affects signal detection, signal creation, the Trade Window itself, statistics, or export — they only relate to what stays drawn on the chart.
Q42: What is Exit Strategy, and what do the Entry / Retest / Breakout / Pullback labels mean?
Exit Strategy selects which exit-management ladder governs how a signal's Stop Loss, Risk Mitigation Level, Take Profit levels and trailing stop are evaluated. Today there is one policy — the RML/TP2-5 ladder configured from the on-chart Strategy Panel — kept as a selector so a future policy can be added without changing how existing signals are evaluated.
The Execution Label is the word shown on the entry line at the chart (for example "Entry", "Retest", "Breakout", or "Pullback"). It is not a setting you configure — it is fixed per indicator and describes how that specific strategy actually executes: some indicators create the signal the instant a level is retested, others execute immediately on their own signal, and others confirm via a breakout or pullback. Refer to your indicator's User Guide to see which label applies and why.
Q43: What is the Trade Window?
The Trade Window is a per-signal concept: the period that represents the strategy's engineered optimal entry (the panel shows it as OPEN).
It is not an execution restriction and it does not decide whether your trade is counted. You can execute a trade at any time. While the signal is valid — that is, it has not closed — the first matching manual trade is recognised for Trading Mode statistics, whether you entered during the optimal-entry window or later at your own discretion; once the signal has closed (Stop Loss, Take Profit or trailing stop reached), no further trade is recognised. Whether the Trade Window is open or closed is independent of when the signal's own SL/TP/trailing outcome ultimately resolves — a Trade Window can close well before a signal finishes resolving. Judging whether a later discretionary entry still offers an acceptable risk-to-reward profile remains entirely the trader's responsibility.
© 2026 Marc Quentier. All Rights Reserved. EdgityCore Suite and all related materials may not be reproduced or redistributed without permission.




