Why Bar Closing Time Matters in Trading — and How to Track It in MT5

A bar timer may look like a very simple trading tool. It only shows how much time remains before the current candle closes.
But in practice, the transition from one candle to the next can be an important moment in the market.
Many discretionary traders focus mainly on price, order flow, volume, volatility or indicators. Time itself is often treated as secondary. However, every candle close is a precise time boundary at which one set of market data becomes final and a new bar begins.
For traders who use bar-based strategies, automated systems or Market Profile, this transition can matter much more than it first appears.
Why the end of a candle matters
A candle is not only a visual representation of price movement. Its Open, High, Low and Close values are used by a large number of indicators, trading systems and automated strategies.
While the current candle is still forming, its final values are not known yet. At the moment the bar closes, those values become final and can be used for calculations and trading decisions.
Many systematic and algorithmic strategies are synchronized with bar closes or bar opens.
Some systems evaluate conditions when the current candle closes. Others use the completed candle and act at the beginning of the next one.
This means that the transition between two candles is not just a visual change on the chart. It is also a precise point in time when multiple automated processes can react.
Around these boundaries, trading activity and volume can sometimes increase very quickly.
Of course, not every increase in activity at a candle close is caused by algorithms. Scheduled news, exchange openings, fixing times, institutional execution schedules and other factors can also affect volume.
But from a practical point of view, it is useful to know exactly when the next important time boundary is approaching.
Not all candle closes are equally important
The significance of a bar transition can depend heavily on the timeframe.
A new M1 candle begins every minute, so these transitions are very frequent.
A new M30 or H1 candle occurs less often and can represent a more important synchronization point.
The reason is simple: higher-timeframe boundaries often coincide with the closing of several lower timeframes.
For example, at the top of the hour, an H1 candle closes and a new H1 candle begins.
At the same moment, M30, M15, M5 and M1 bars also reach their boundaries.
That means that multiple bar-based calculations can become final at exactly the same time, and strategies operating on different timeframes may evaluate their conditions simultaneously.
This is one reason why an H1 boundary can be much more important than an ordinary M1 transition.
A bar timer therefore does more than show how much time remains in the current candle. It helps you anticipate when a potentially important market time boundary is about to occur.
Why M30 boundaries are especially interesting
Thirty-minute intervals deserve special attention.
Traditional Market Profile and TPO analysis divide the trading session into 30-minute periods.
Each new half-hour period is represented by a new TPO letter.
Because of this structure, every M30 transition also marks the beginning of a new Market Profile period.
So the start of a new M30 candle can be interesting for two different reasons.
It is a normal bar boundary for M30-based trading systems, but at the same time it is also the start of a new TPO period for traders using Market Profile.
This makes the half-hour boundary a natural point to watch for changes in participation, activity and volume.
Time boundaries can change market activity
One of the main reasons to watch a bar timer is to know exactly when the market is approaching a new time boundary.
Many automated and systematic strategies are synchronized with bar closes and bar opens. Some calculations are finalized only when a candle closes, while other systems may initiate new decisions as the next candle begins.
Because many strategies can react at the same time, trading activity can change very quickly around these transitions.
This becomes especially interesting when several timeframes align.
For example, at the top of the hour, a new H1 bar begins together with new M30, M15, M5 and M1 bars.
That creates a much more significant time boundary than an ordinary M1 transition.
A bar timer therefore helps me anticipate these moments before they happen, rather than noticing them only after the new candle has already started.
Indicators also depend on candle close
The same principle applies to technical indicators.
Many indicators calculate their current value using the still-forming candle.
RSI, moving averages, oscillators and many custom indicators can continue changing until the current bar closes.
A signal visible during the candle may therefore look different once the bar is completed.
For strategies that use completed-bar confirmation, knowing exactly how much time remains can be useful.
The timer gives immediate context about whether the current candle has just started or is only a few seconds away from becoming final.
Timing decisions around a new candle
Some trading approaches intentionally wait for the current candle to close before making a decision.
Others are interested in what happens immediately after a new candle opens.
Without a bar timer, the trader has to watch the clock or wait until the chart visibly prints the next candle.
A countdown makes the transition predictable.
When only a few seconds remain, the trader knows that the next time boundary is approaching and can pay closer attention to changes in volume, order flow or price behavior.
This can be especially useful around M30 and H1 transitions.
Why I wanted a floating bar timer
A timer can be useful, but it should not become another large panel occupying valuable chart space.
Many bar timer indicators are permanently fixed in one corner of the chart.
That may be fine for some layouts, but not every trader organizes charts the same way.
Some use indicators in the upper-left corner. Others use trading panels, labels, market-depth tools or several charts at once.
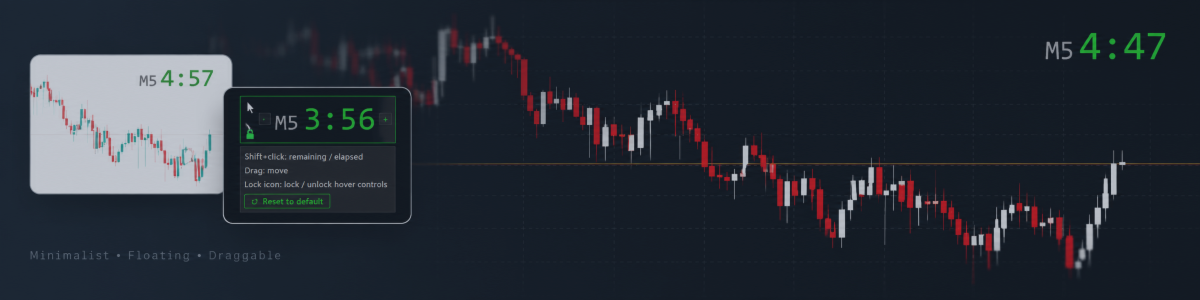
That was the main idea behind Floating Bar Timer for MetaTrader 5.
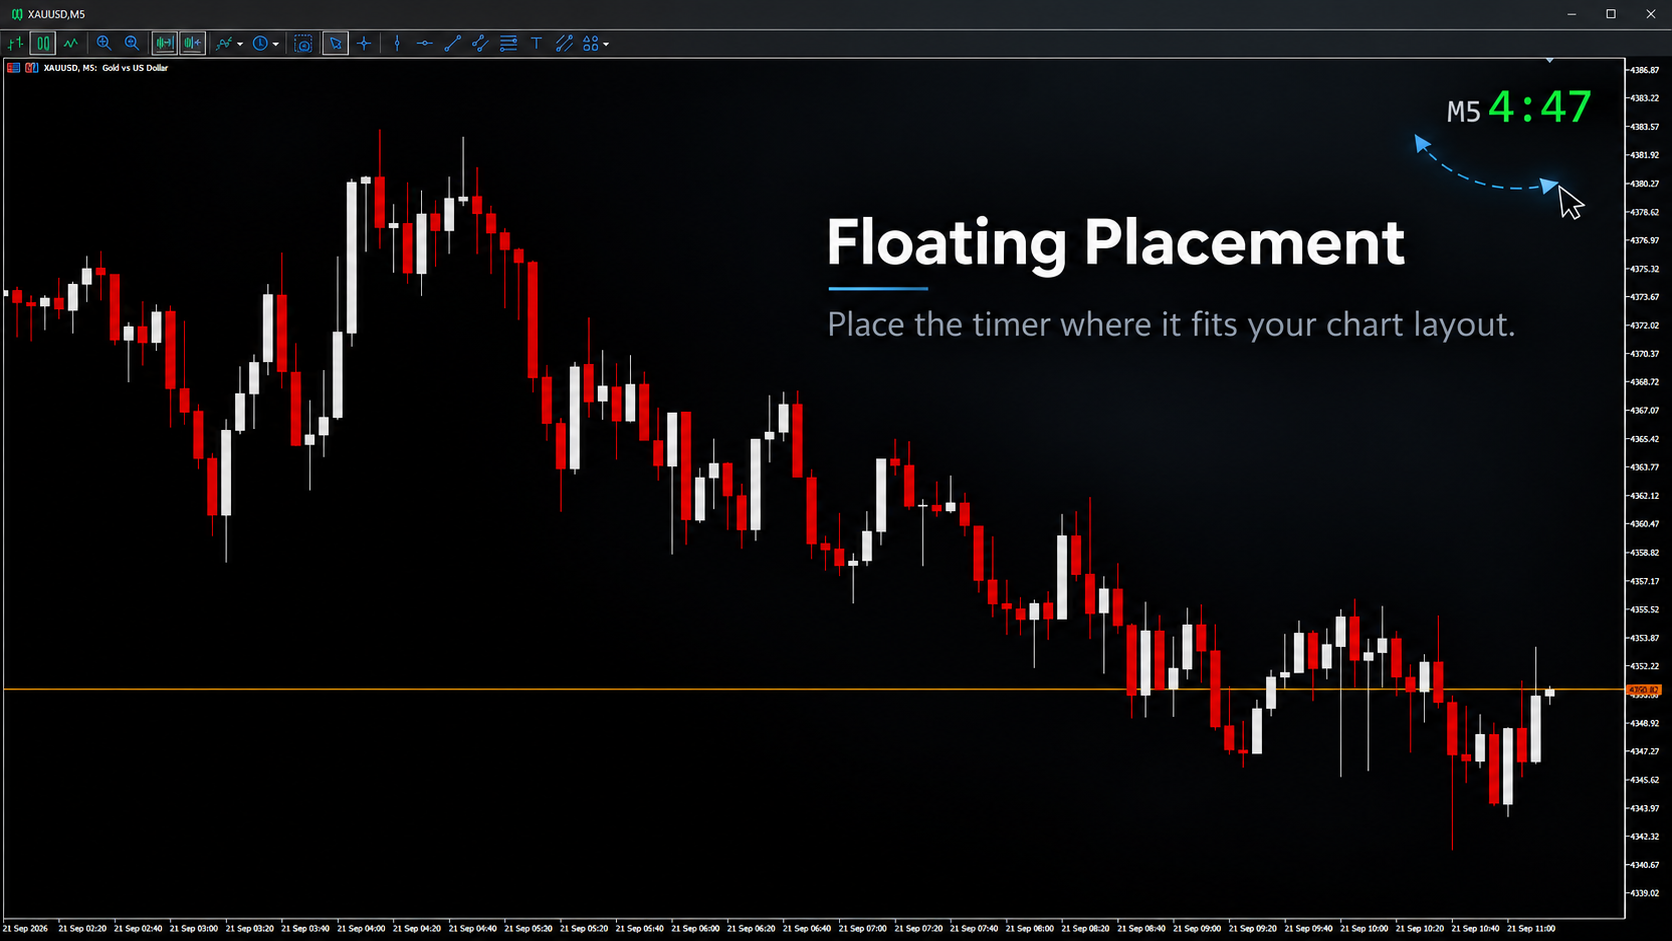
I wanted the timer to remain visible without forcing the chart layout to adapt to it.
The timer can simply be dragged anywhere on the chart and placed where it fits best.
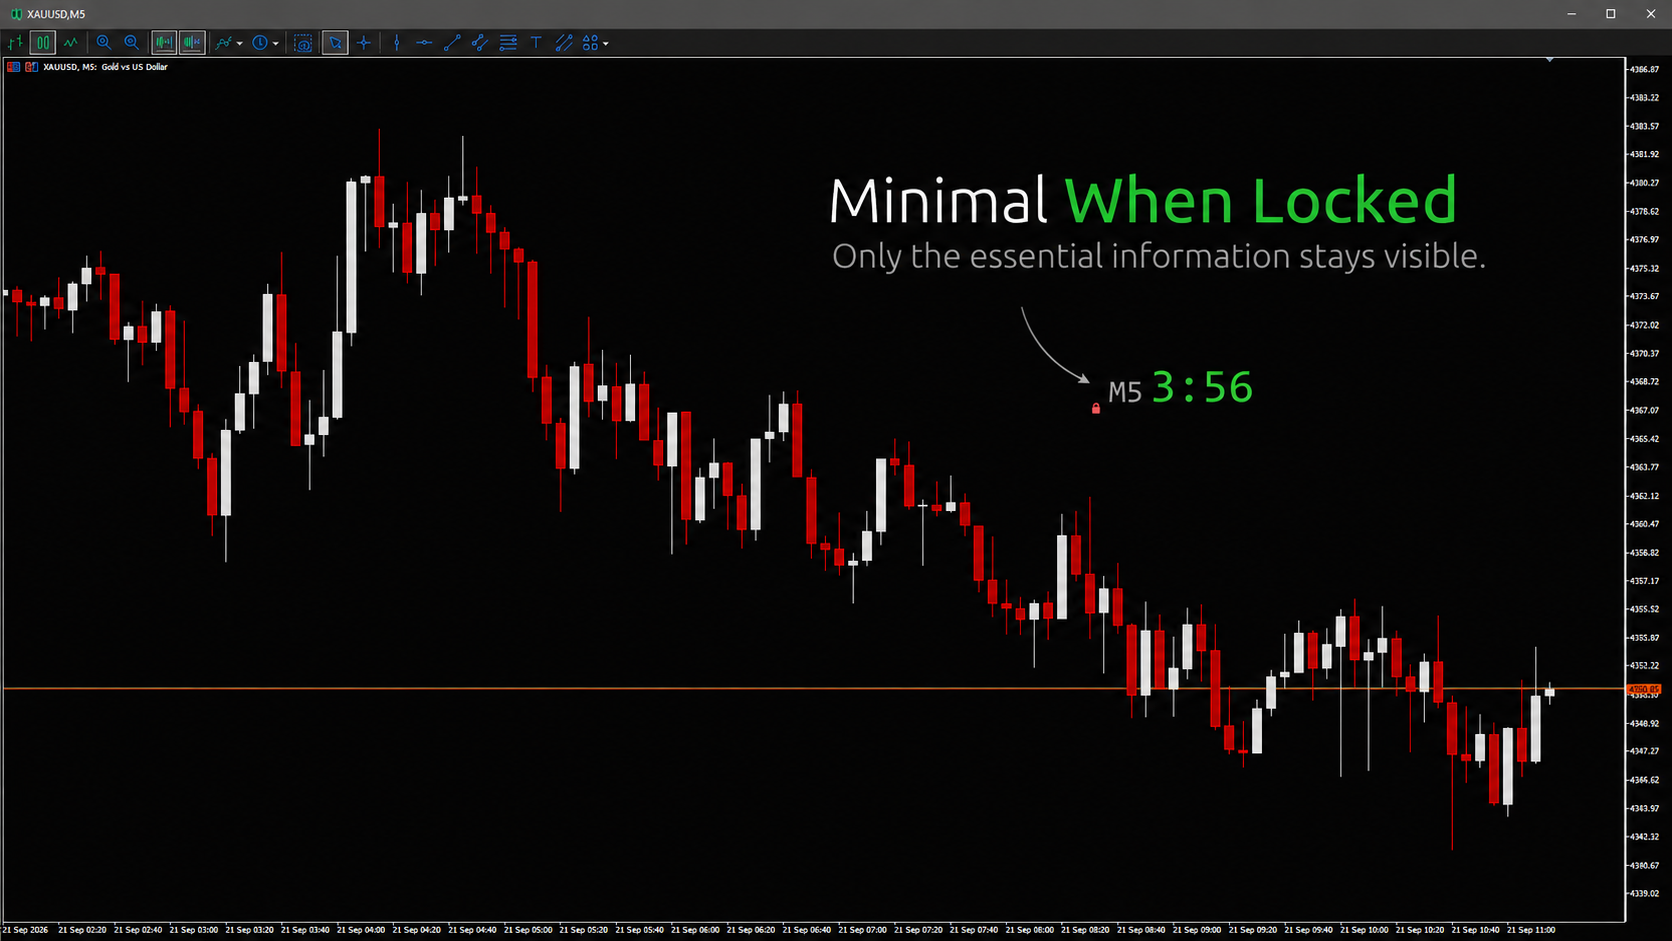
Its design is intentionally minimal. During normal use, only the timeframe and the current timer need to remain visible.
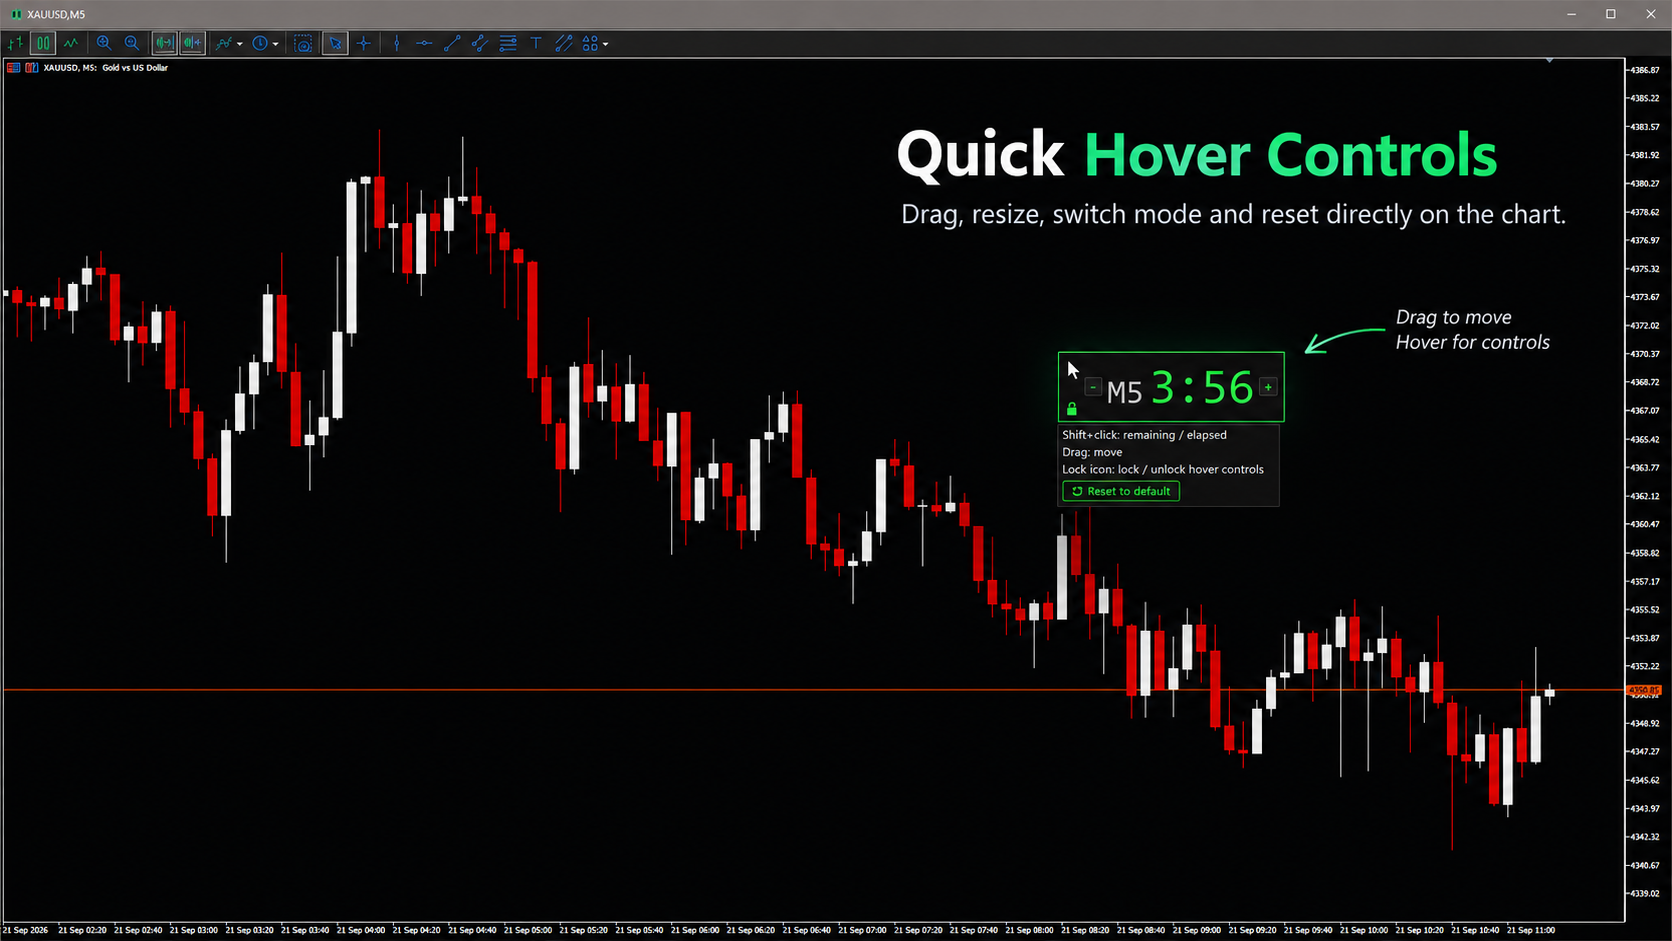
Hovering over the timer reveals additional controls only when needed.
Floating Bar Timer features
Floating Bar Timer is built around a small set of practical functions:
- freely draggable floating placement anywhere on the chart
- remaining-time or elapsed-time display
- optional timeframe label
- adjustable font size and text style
- quick hover controls
- optional locking to prevent accidental movement
- automatic color adaptation for dark and light chart backgrounds
- minimalist design intended to stay out of the way
The goal is not to turn a simple timer into a complicated trading system.
The goal is to make an important piece of timing information available without adding unnecessary visual clutter.
Final thoughts
A bar timer does not provide a trading signal by itself.
It does not tell you whether to buy or sell.
What it provides is timing context.
For traders who pay attention to candle closes, automated strategy behavior, Market Profile periods, indicators calculated on completed bars or higher-timeframe boundaries, that timing context can be surprisingly useful.
Personally, I find the transition between the old candle and the new one particularly important.
It is a precise point where multiple calculations can become final, automated strategies may react and market activity can change very quickly.
And the higher the timeframe boundary, the more interesting that moment can become.
That is the main reason I prefer to keep a bar timer visible on my chart.
Download Floating Bar Timer for MT5 - Free
If you find it useful, you can also check my other MT5 indicators on my MQL5 profile.