A backtest with an 8% maximum drawdown tells you what happened along one historical path. It does not establish an 8% limit on future losses. Even the same set of trades can produce a different interim drawdown when losses arrive in a different order.
Monte Carlo analysis helps examine that path dependence. To interpret it, you need to know what was varied and how the resulting drawdowns compare with the original figure—not just how many simulations were run.
Start with the path the backtest actually took
For a simple illustration, hold each closed trade's monetary result fixed and use every trade exactly once, changing only the order. Total profit and the ending balance remain the same, while the size and timing of balance drawdowns can change. This does not reconstruct floating equity drawdown while positions are open. Resampling with replacement or recalculating position sizes answers a different question and need not preserve the ending balance.
An analysis based on a historical maximum DD of 8% might generate 1,000 paths with maximum drawdowns of 6%, 8%, 10%, 13%, 16% and other values. These are illustrative figures, not test results for the products discussed elsewhere in this series.
The original 8% still matters. It is the maximum observed under the original period, assumptions and sequence. The simulations ask what other sequences could have produced under their own stated assumptions.
The figure below uses a separate, smaller calculation so the mechanism is visible: start at 1,000 and reorder three gains of 100 and two losses of 100. Both paths finish at 1,100, but their maximum balance drawdowns are 15.38% and 9.09%. It is a constructed example, not a sample from a trading account.
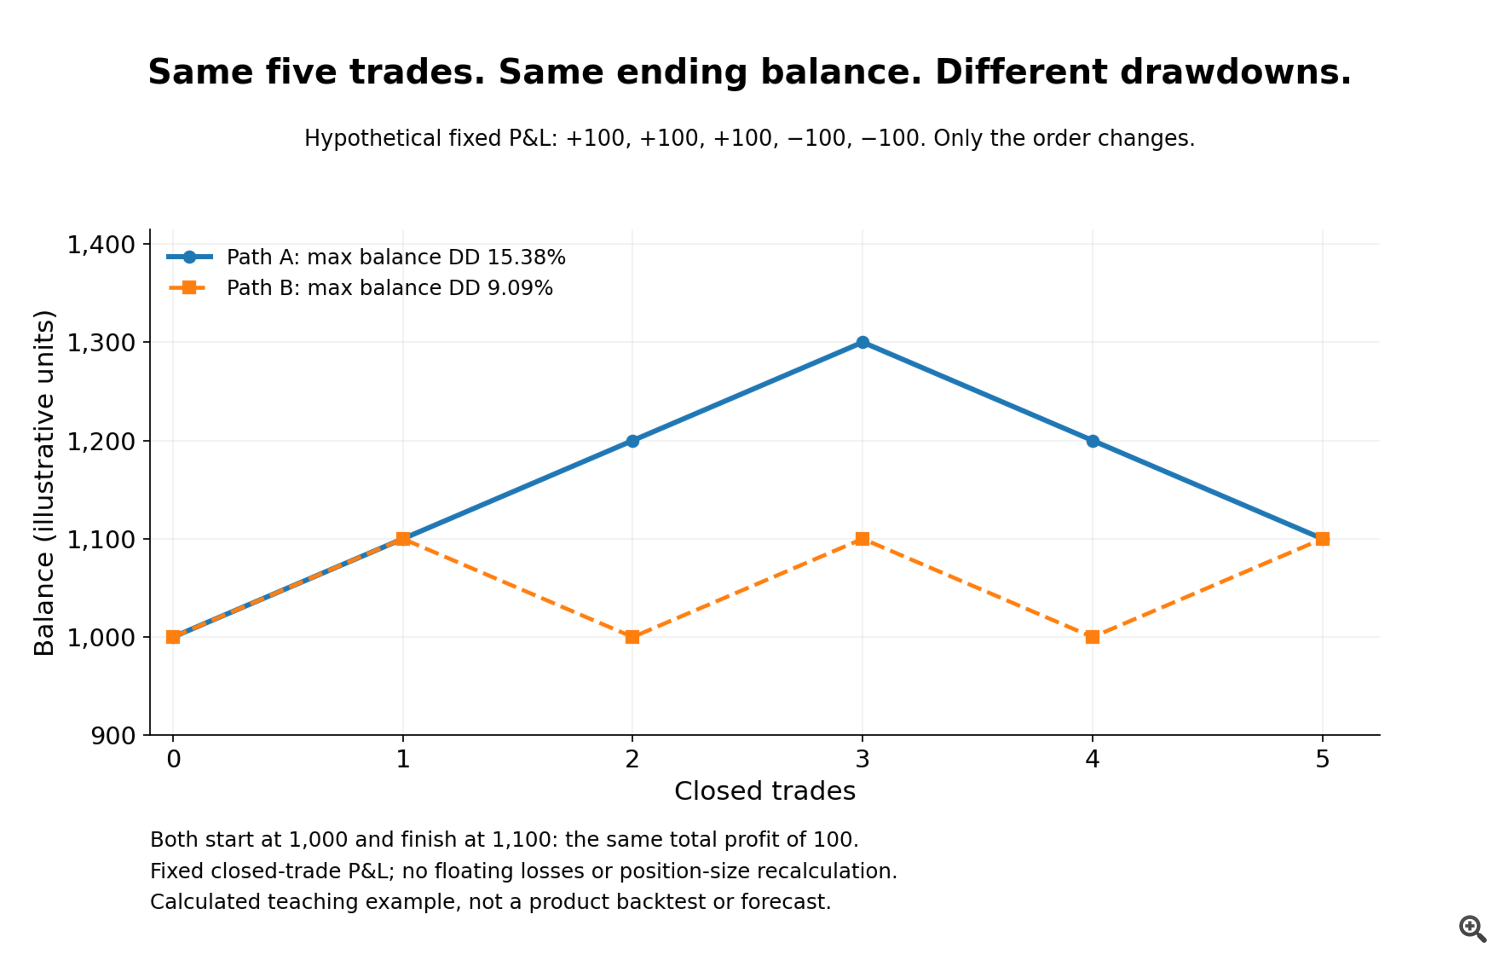
Calculated hypothetical example: the same five P&L outcomes, both ending at 1,100. These are not product trades.
Keep sample size separate from simulation count
It is possible to run 1,000 simulations on 50 trades, 500 trades or 5,000 trades. The identical run count does not make the underlying evidence equivalent.
Compare 50 historical trades used for 10,000 simulations with 5,000 historical trades used for 1,000 simulations. The first analysis generates more paths, but continues to work from the smaller set of original observations. Repeating those 50 trades even 100,000 times would not supply the market information from thousands of additional trades.
More simulations can make estimates of the simulated distribution less coarse. They do not resolve a limited or unrepresentative source sample. Nor should a large trade count be assumed to mean that every observation is independent; related trades and concentrated market conditions still matter.
Interpret p95 and p99 as simulated drawdown percentiles
Suppose the maximum drawdowns from 1,000 paths have a median of 9%, a p95 of 14% and a p99 of 18%. These figures describe the distribution of the paths' maximum drawdowns, not the proportion of days the account spent below a particular level.
The median gives the middle result. At p95, approximately 95% of simulated maximum drawdowns are at or below that level and 5% are worse. With 1,000 paths, that leaves about 50 beyond p95. At p99, roughly 10 paths are worse.
That tail is relevant to risk, but its small size also calls for care. The percentile is an estimate within the simulated world, not a precise future ceiling. A reported p99 of 18% does not establish a 99% guarantee that future losses will stay below 18%.
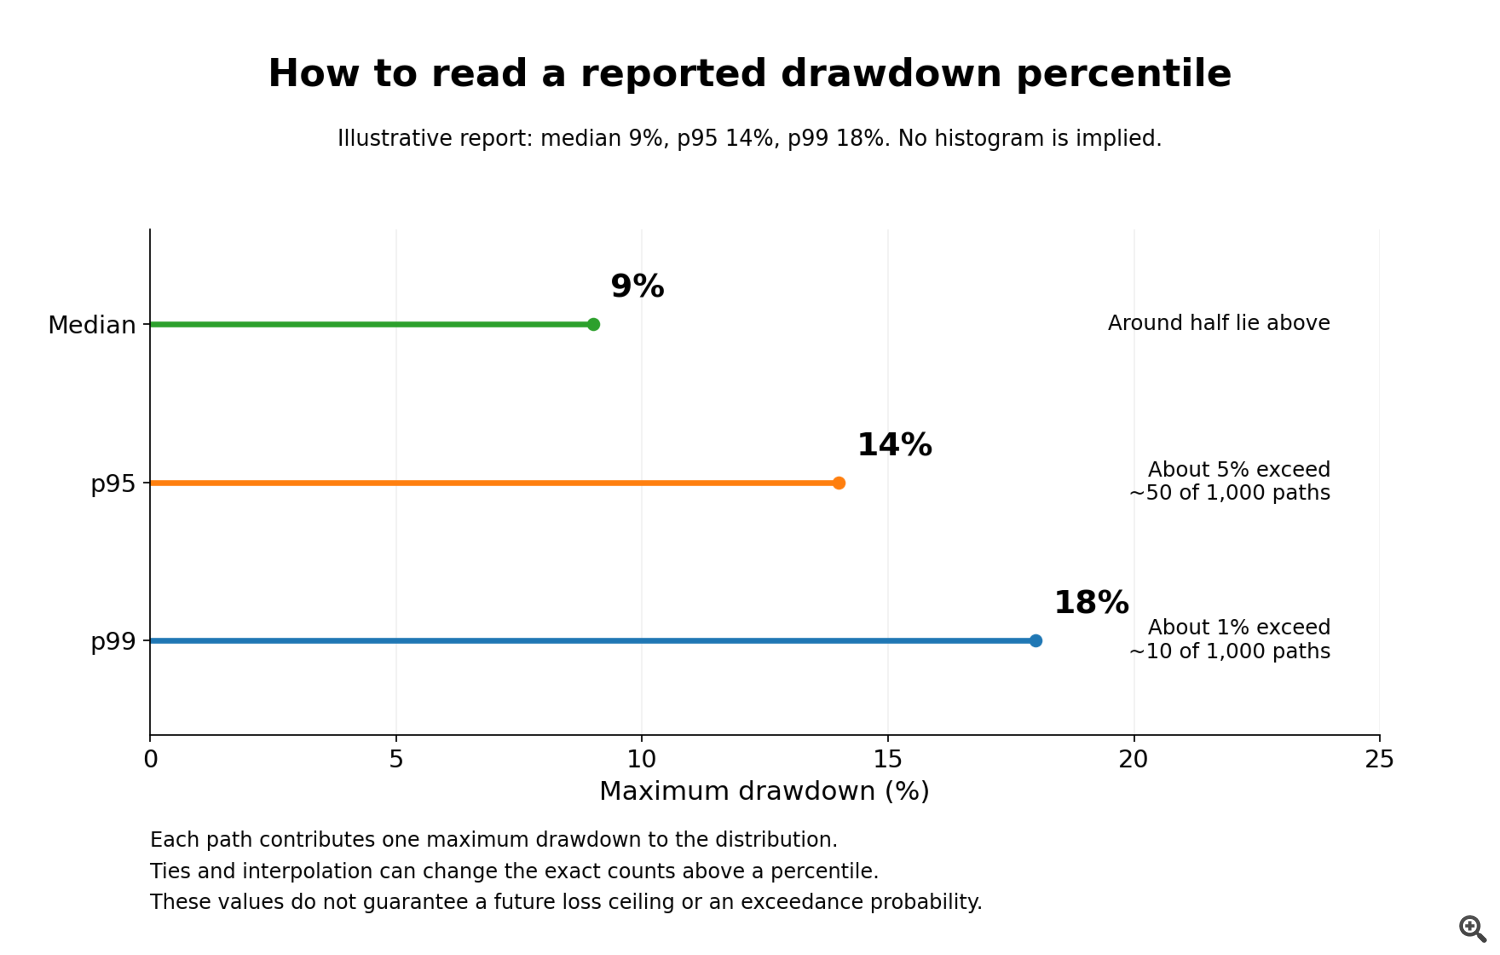
Illustrative percentiles from the text, not a distribution calculated from the five-trade example above and not product measurements.
Increasing the run count to 10,000 would put roughly 100 paths in the worst 1%, rather than 10. That can help estimate the tail more clearly, but it does not add new historical trades or remove the assumptions of the model.
Check what the randomization leaves out
A Monte Carlo result depends on the source trades, what was randomized, how resampling was performed, the treatment of dependence and the run count. A simple shuffle may be a poor representation of an EA whose losses naturally cluster within particular regimes, because it can break the relationships that produced the cluster.
It also does not automatically create a future market regime, extreme gap, liquidity shock, unusual broker execution or strategy decay that was absent from the source sample. A detailed-looking distribution can still describe a limited set of possibilities.
Historical drawdown and simulated drawdown therefore have different jobs. The former records the path in the historical test; the latter explores alternatives under defined assumptions. Neither should be mistaken for a maximum permitted future loss.
What a useful Monte Carlo report should contain
When reviewing an EA, ask for the original trade count, simulation count, randomization method, reported percentile and main assumptions together. “1,000 simulations” becomes much more informative when those details are present.
EdgeDriven Algo emphasizes this distinction when discussing risk: the historical maximum is an observation, not a promised limit. Showing the source sample and the bad side of the simulated distribution alongside it makes the risk easier to evaluate.
Product details and testing conditions
When reviewing our products, read any reported drawdown in the context of its data, calculation method and risk settings.
Specifications, published historical results and operating limits: EdgeDriven Gold Portfolio — XAUUSD · EdgeDriven Dollar Yen Portfolio — USDJPY.
The examples in this article explain evaluation methods; they are not test results for those products. Historical simulations do not guarantee future results. Leveraged trading can cause substantial losses.