
|


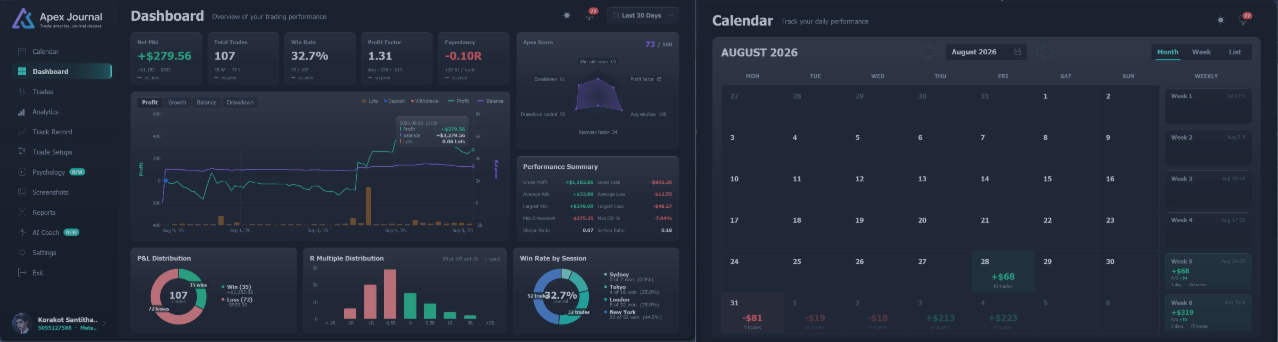
ApeX Journal is a full trading journal, statistics engine and trade review tool that lives inside MetaTrader 5.
It reads your closed trades straight out of the terminal, stores them in its own database, and gives you eleven pages to look at them with — calendar, dashboard, trade table, analytics, track record, setups, psychology, screenshots, reports, an AI coach and settings.
Nothing is typed in by hand. Nothing is uploaded anywhere.
━━━━━━━━━━━━━━━━━━━━━━━━━━━━━━
Getting started
- Drag ApeX Journal onto any chart. It is an indicator, not an Expert Advisor — it does not trade and never sends an order.
- The first time it runs it reads your account history and builds its database. This takes a moment on a large account and happens only once — after that it keeps itself up to date by itself.
- A small bar appears on the chart: /_\ ApeX journal.
- Click the Calendar chip on the bar. The full-screen journal window opens.
- Press ESC, or Exit at the bottom of the left menu, to close it again.
One purchase, one program. ApeX Journal works completely on its own. If you also run ApeX Trading Console, extra things light up (the Trade Setup card, screenshots taken at entry, your planned SL/TP and the plan-versus-actual figures) — but every page below works without it.
━━━━━━━━━━━━━━━━━━━━━━━━━━━━━━
The bar


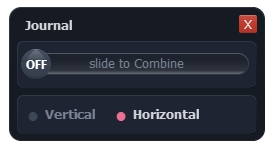
One small draggable bar, the only thing ApeX Journal leaves on your chart when the window is closed.
- 1.1 /_\ ApeX journal — Drag anywhere on the bar to move it. Its position is remembered per chart, including across timeframe changes.
- 1.2 ☰ — Opens the small menu (below).
- 1.3 Calendar — Opens or closes the full-screen journal on the Calendar page.
- 1.4 Dashboard — Same, but straight to the Dashboard. This chip appears only when the bar is in vertical layout; horizontally there is not enough room.
2. The ☰ menu
- 2.1 Vertical / Horizontal — Which way the bar lies on the chart.
- 2.2 Trade Setup — Shows or hides the Trade Card on the right of the chart (see the last section). This row is only present when ApeX Trading Console is running on the terminal — without it there is no plan to show.
━━━━━━━━━━━━━━━━━━━━━━━━━━━━━━
The journal window
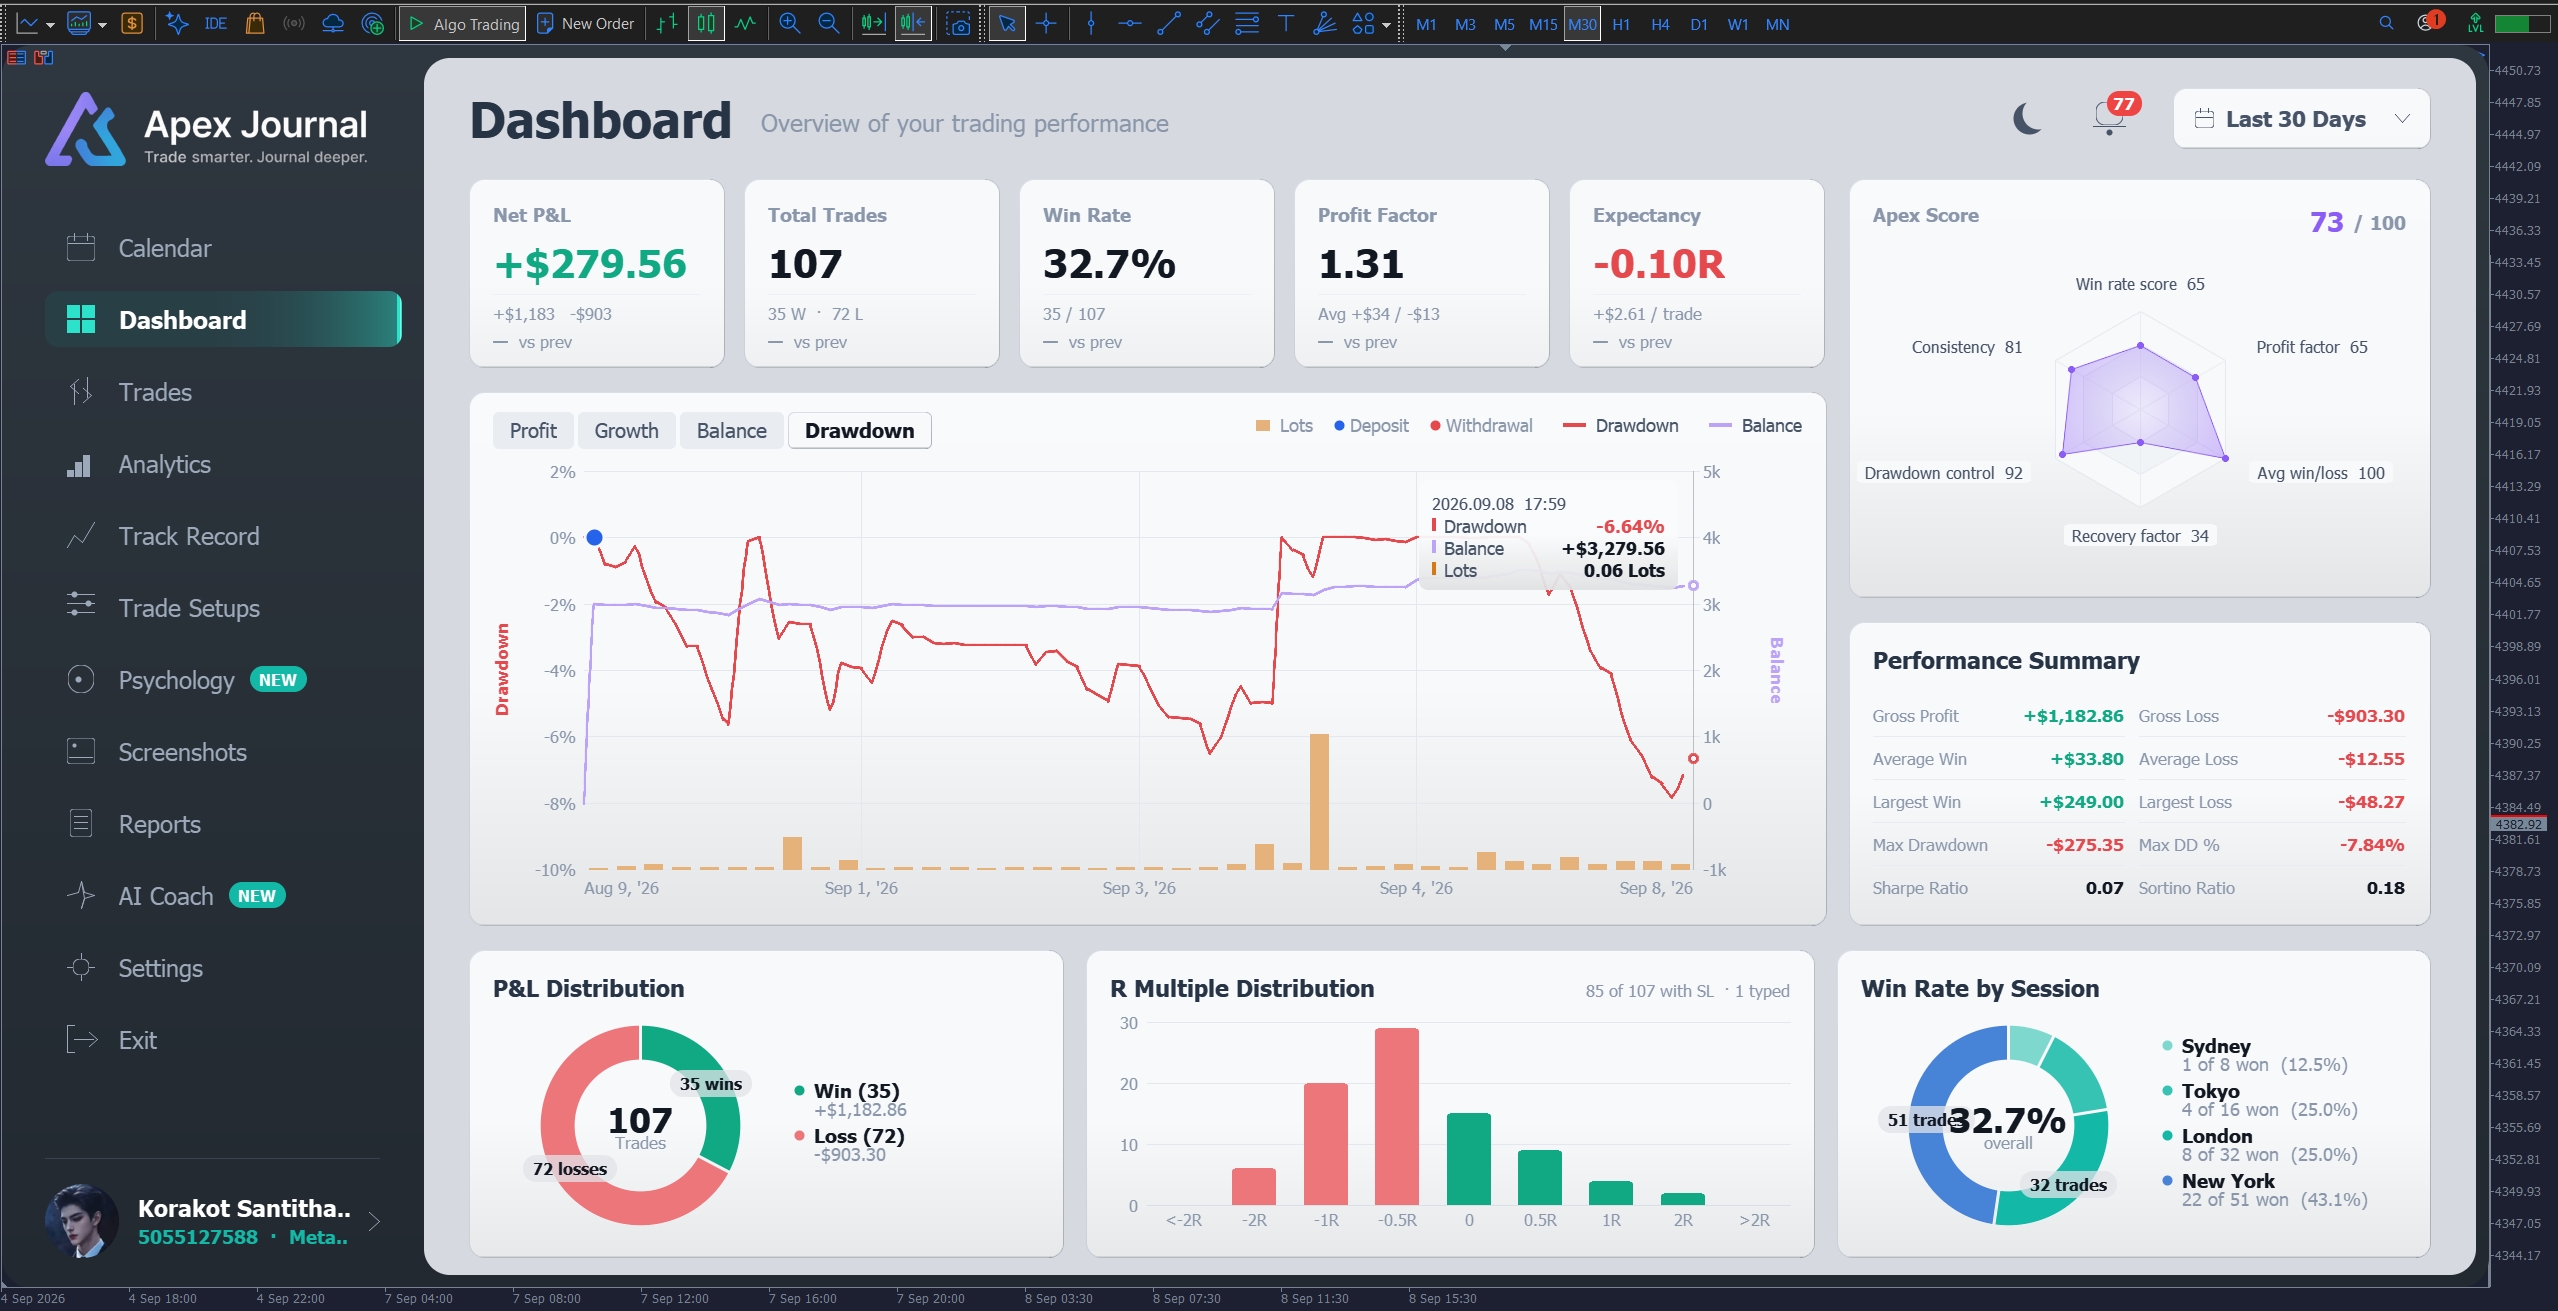
Almost full screen, with a dark menu column on the left and the page itself on the right.
- 3.1 Left menu — Eleven pages plus Exit. The page you are on is highlighted; a small caption under each name says what it answers.
- 3.2 Header — The page title, its caption, and on most pages the buttons that belong to it: the date-range button, Export, and Back when you have gone into a sub-page.
- 3.3 ESC — Closes the window from anywhere. So does Exit.
- 3.4 Language — English and Thai, switched on the Settings page. The first run picks the language of your terminal.
━━━━━━━━━━━━━━━━━━━━━━━━━━━━━━
1. Calendar
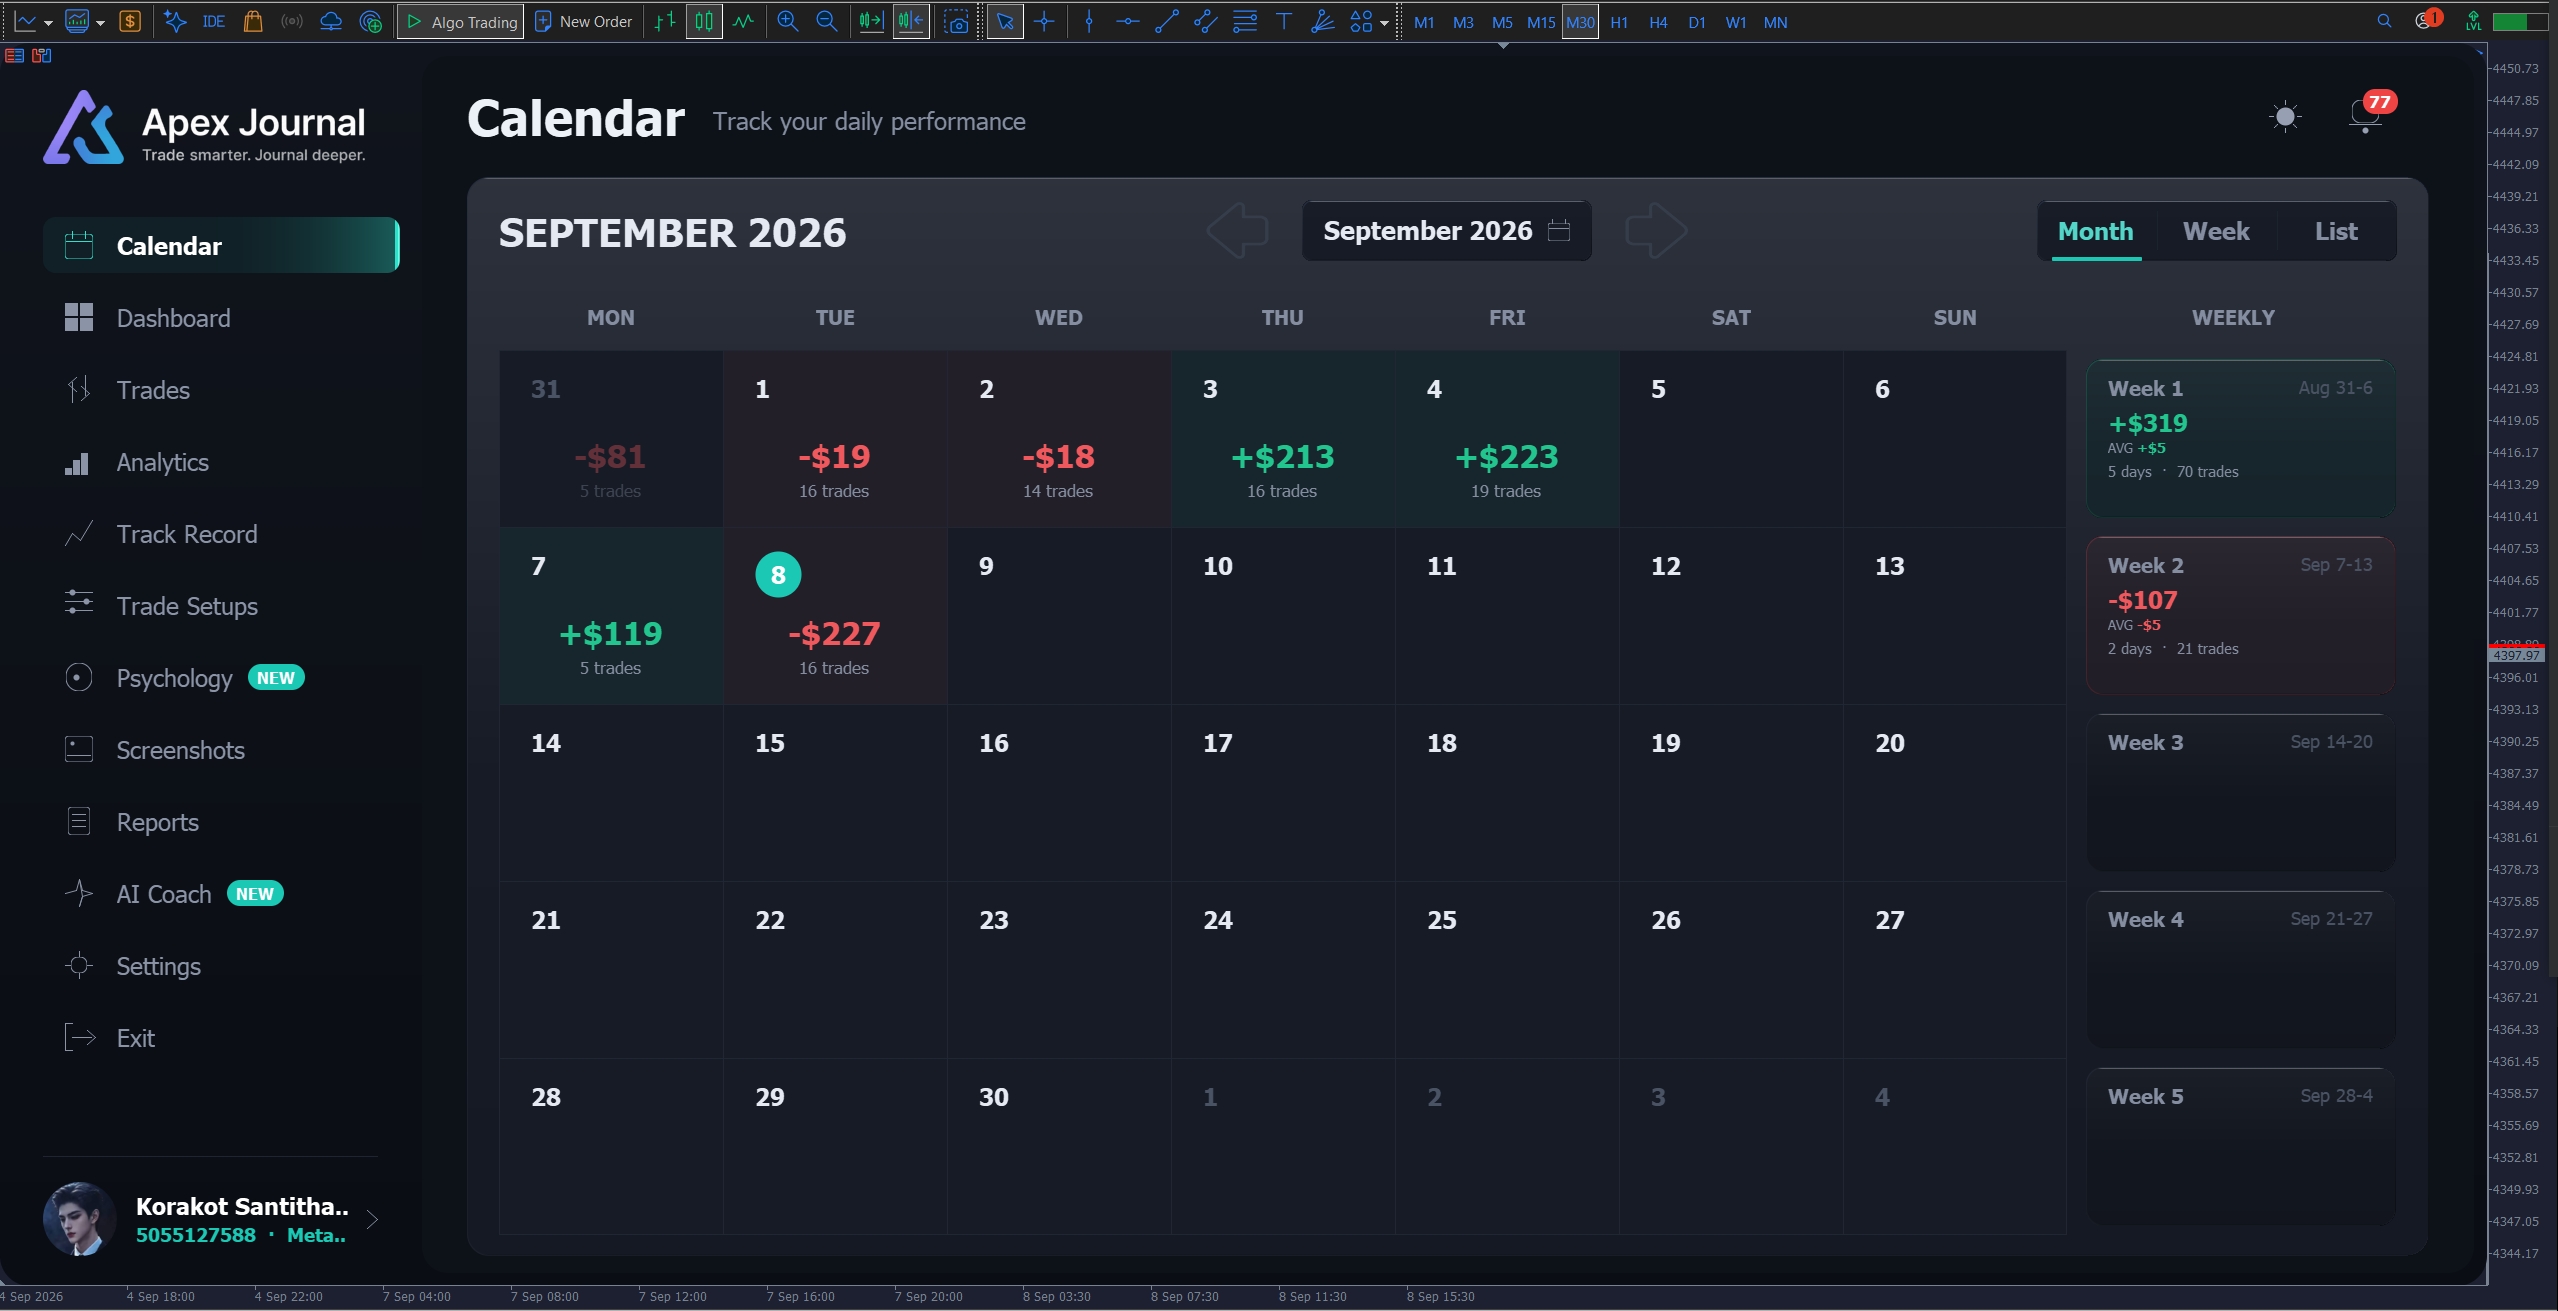
Track your daily performance.
A month of trading at a glance, with a panel on the right for whatever day or week you click.
1. Views
- 1.1 Month — The classic grid, starting on Monday. Each cell shows the day number, the result of that day and how many trades it took. Today is marked. Press Month again at any time and the calendar jumps back to the current month.
- 1.2 Week — One week at a time, in more detail. Week jumps to the current week.
- 1.3 List — Every day of the month as a sortable table: Date, Trades, Best, Worst. Sort by date or by number of trades.
- 1.4 ‹ › — Move to another month or week.
- 1.5 WEEKLY column — A summary column down the right of the month grid: the week's result, its trade count and its best day. It can be switched off, and widened, from the indicator inputs.
- 1.6 MONTH TOTAL — The bottom strip: the month's net result, win rate and trade count.
2. Selected Day panel
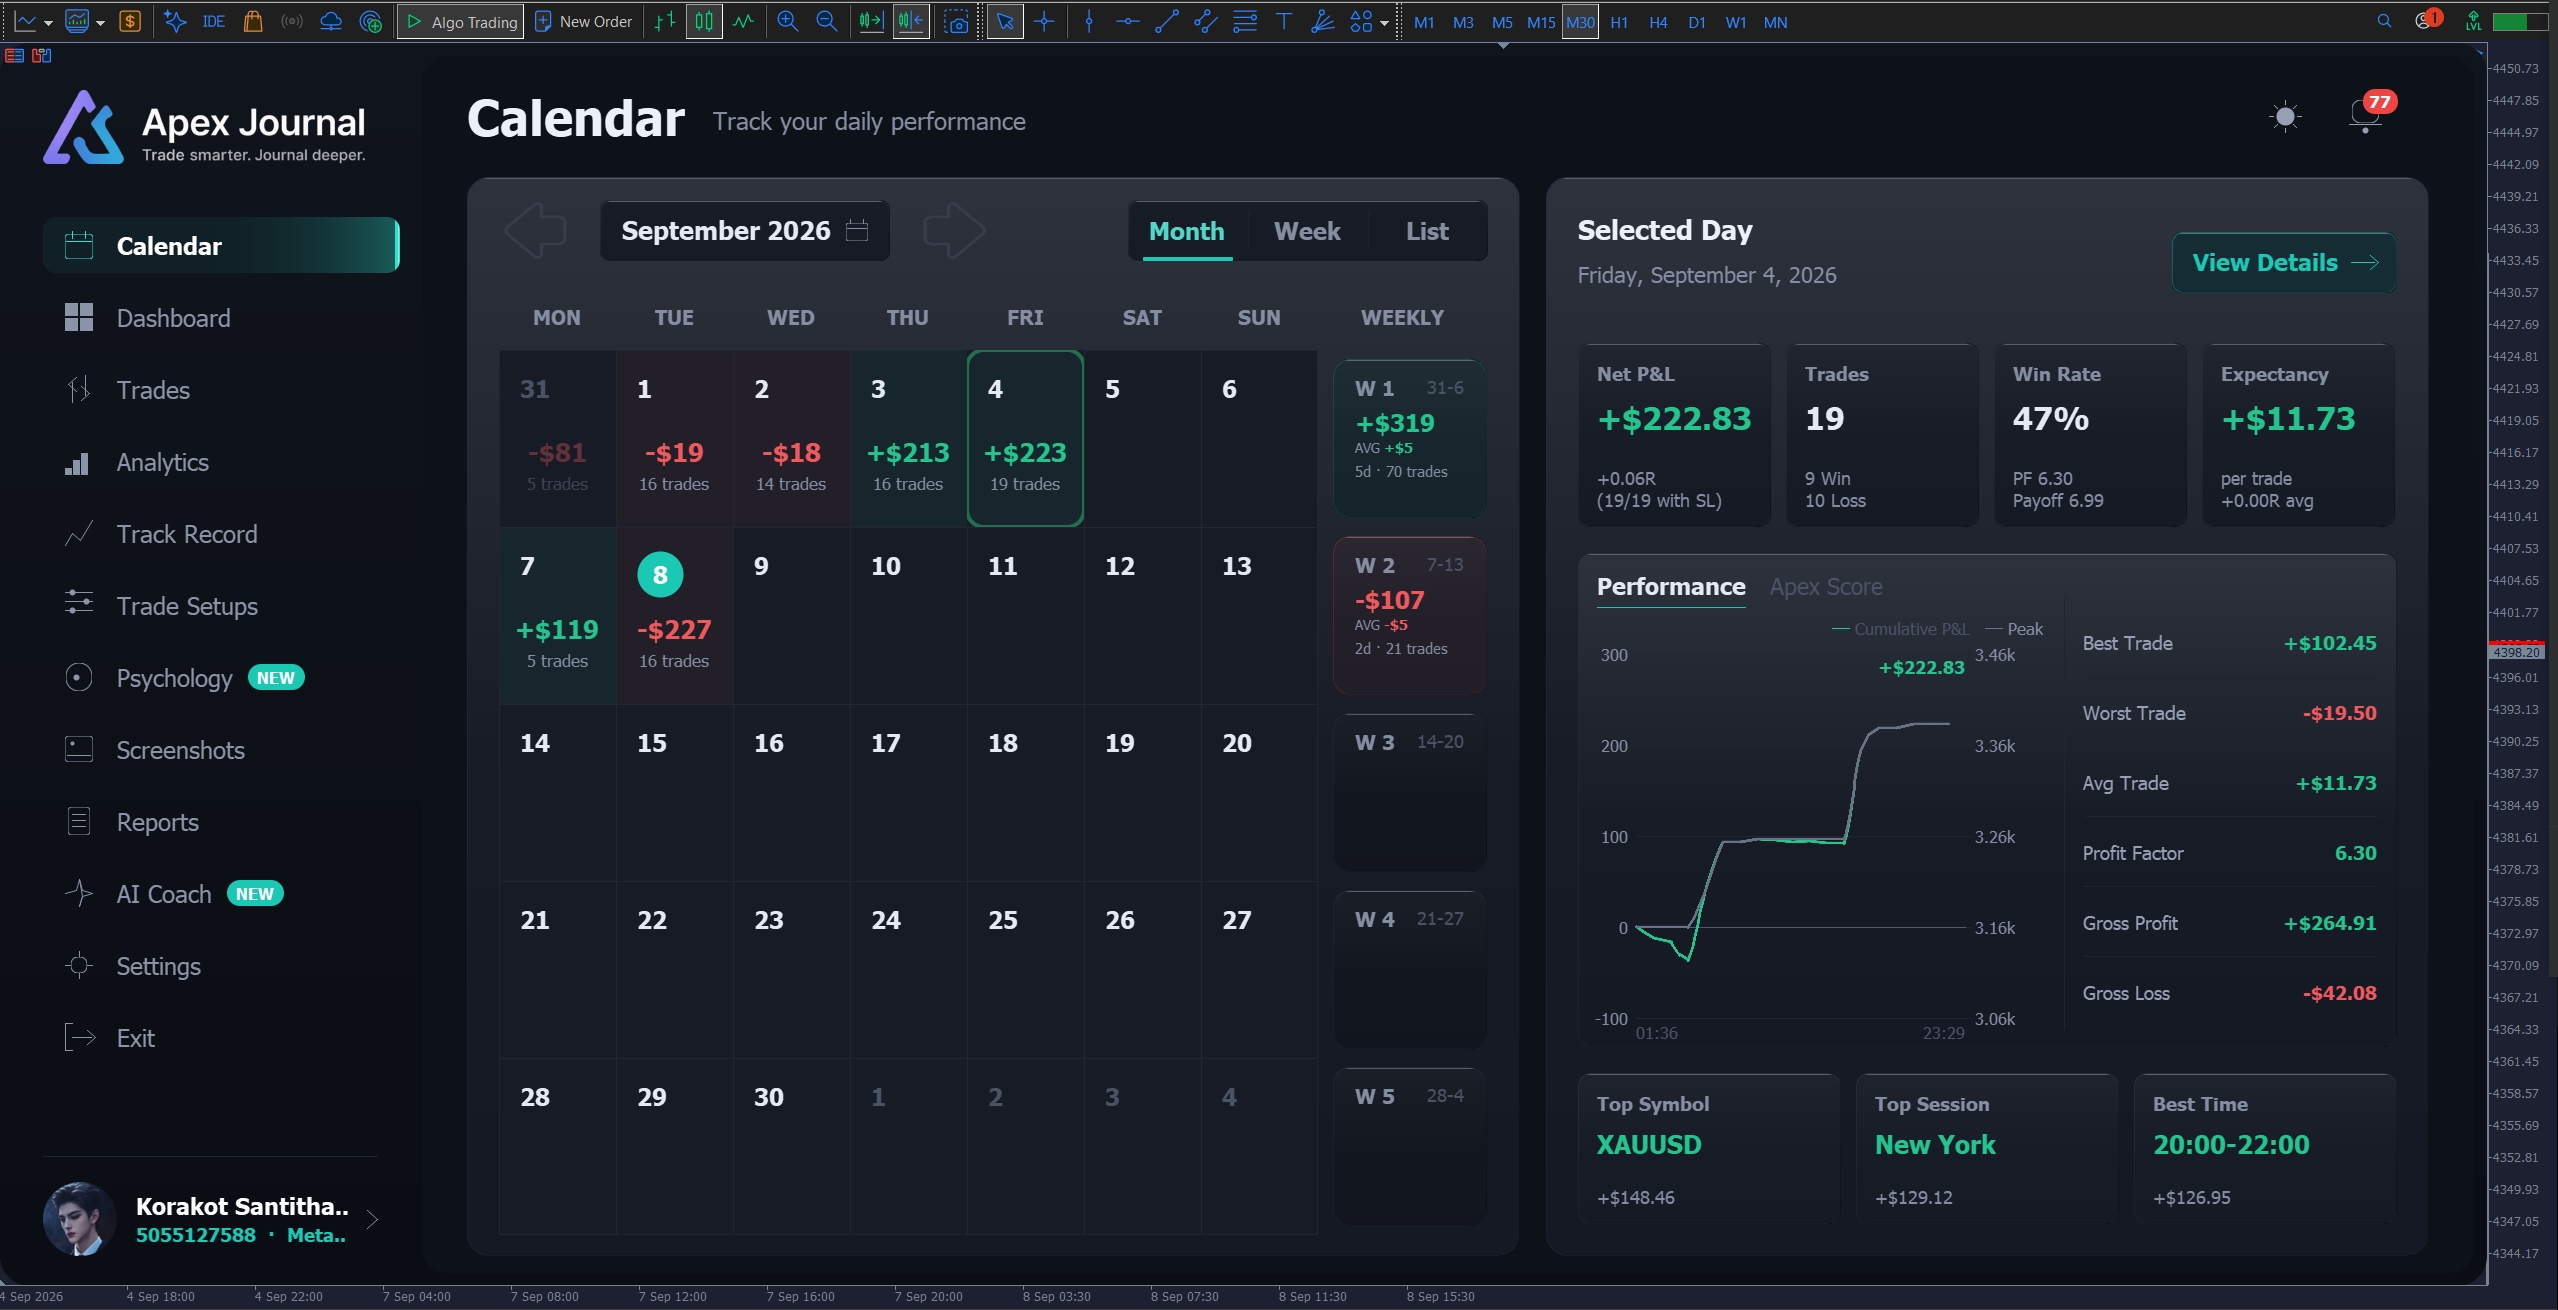
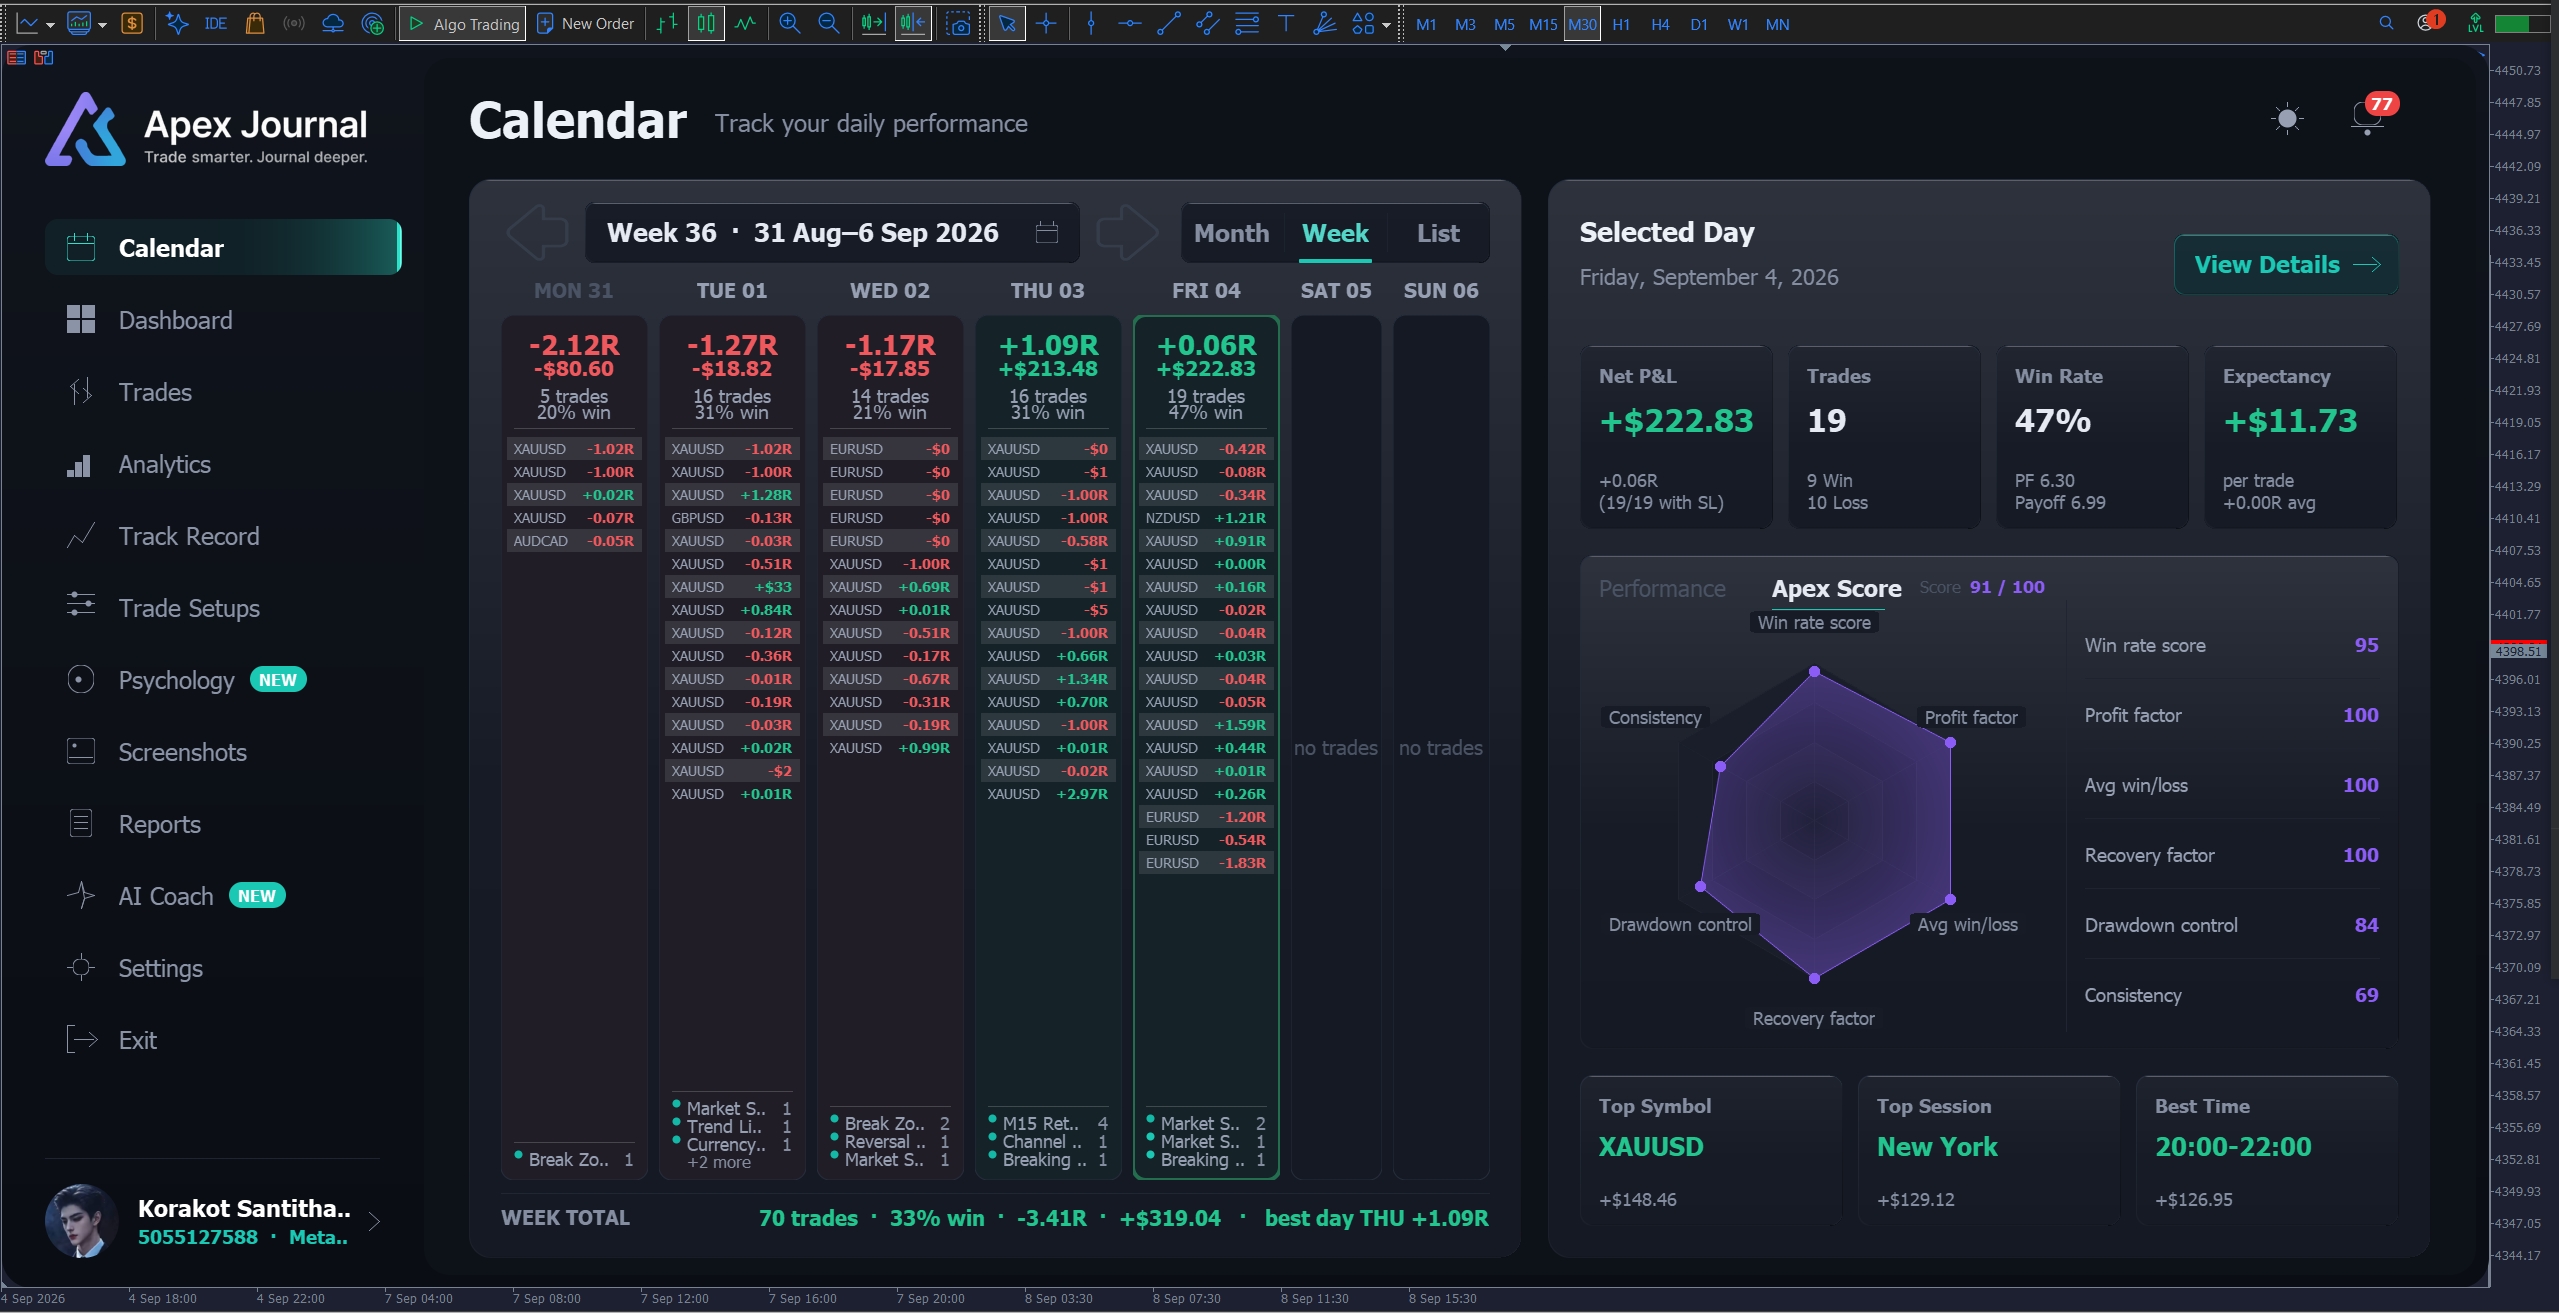
Click any day (or any week, in Week view) and the calendar shrinks to make room for it.
- 2.1 Score — A score out of 100 for that day, drawn as a six-axis Apex Score radar: win rate, profit factor, average win/loss, recovery factor, drawdown control and consistency. Days with too few trades are left unscored rather than given a faint number.
- 2.2 Net / Trades / Win / Loss / Payoff — The day in numbers, with the R average when the trades had a stop loss.
- 2.3 Cumulative line — How the day's result built up trade by trade, with its peak marked. Hover any point to read it.
- 2.4 Best / Worst / Avg trade, Gross profit, Gross loss — The spread of the day.
- 2.5 Top Symbol / Top Session / Best Time — Where the day's money actually came from.
- 2.6 View Details — Jumps to the Trades page filtered to that one day, with every other filter cleared. The date button in the header expands to show the day you are looking at, so you always know what is being filtered.
Days with no stop loss. Any figure quoted in R is calculated only from trades that actually had a stop. If none of a day's trades had one, the panel says so instead of quietly showing zero.
━━━━━━━━━━━━━━━━━━━━━━━━━━━━━━
2. Dashboard
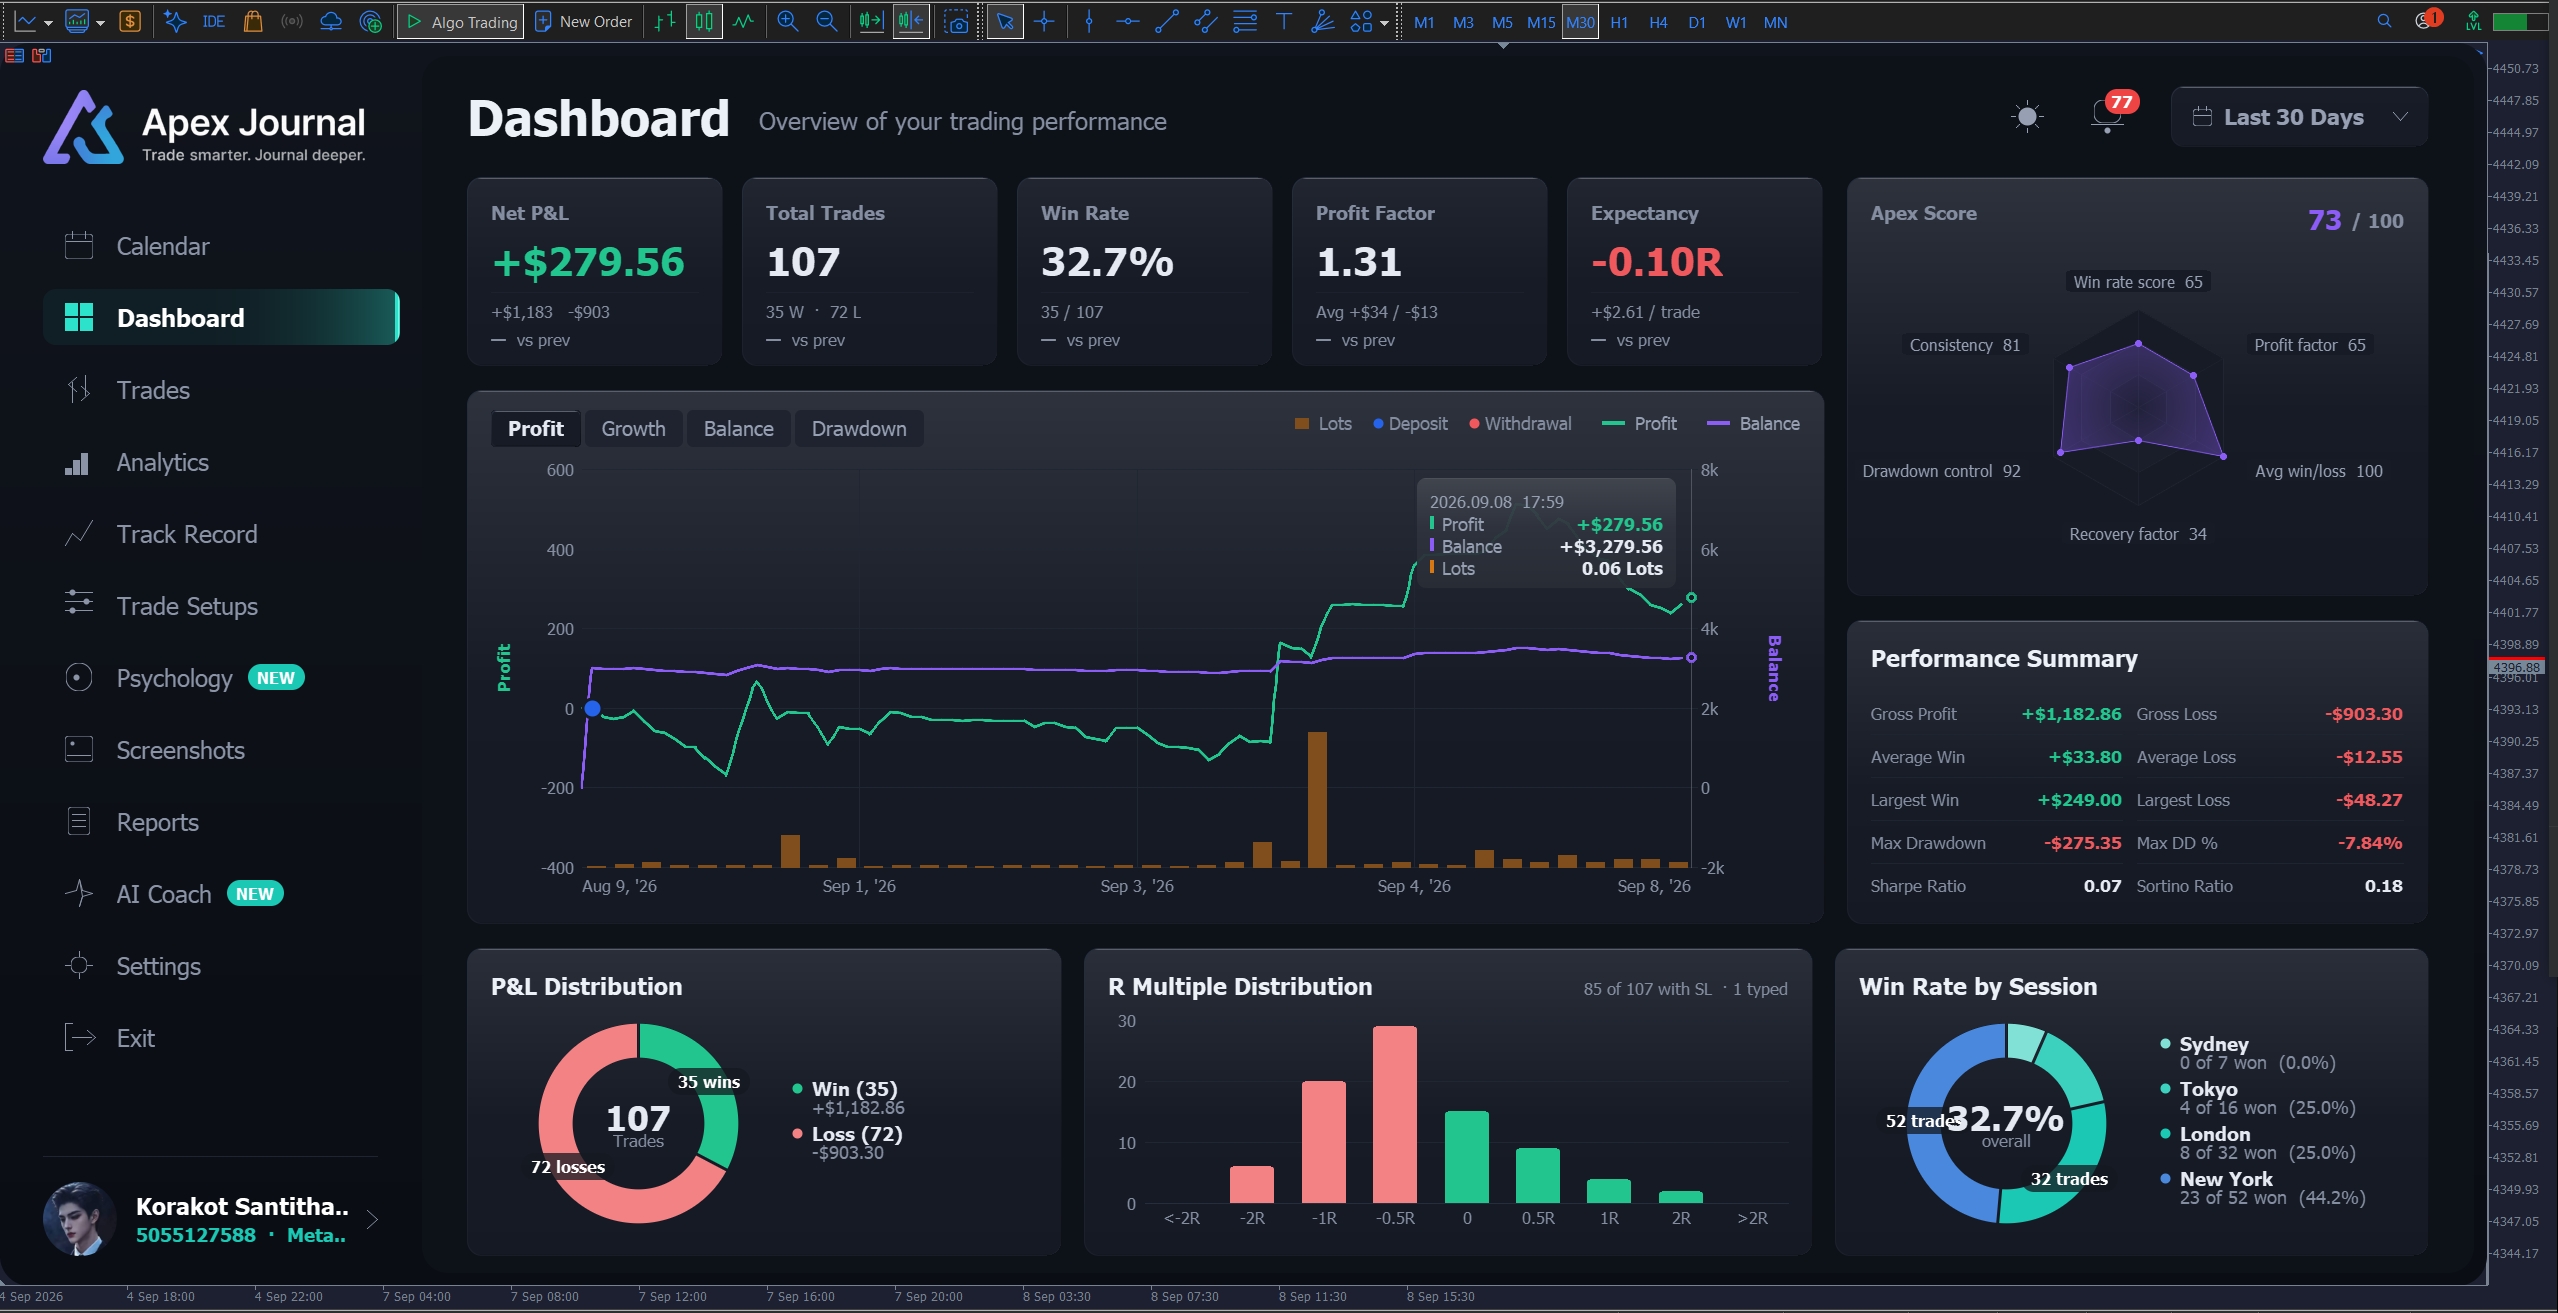
Overview of your trading performance.
A rolling window — "how am I doing right now". For fixed calendar periods use Reports instead.
- 2.1 Range button — Last 30 Days, This Month, This Year, All Time. It sits in the header and is shared with Analytics and Psychology, each keeping its own choice.
- 2.2 KPI tiles — Net result, total trades, win rate, profit factor, expectancy and average R, each with the same figure for the previous window of the same length underneath. All Time has no previous window, so no comparison is shown — not a zero.
- 2.3 Performance Summary — Gross profit and loss, average win and loss, largest win and loss, maximum drawdown in money and percent, and Sharpe and Sortino ratios.
- 2.4 Growth chart — Your balance over the period with the drawdown shaded underneath, and deposits and withdrawals marked. Switch the tab to Profit to see result per trade instead.
- 2.5 P&L Distribution — Winners against losers as a donut.
- 2.6 R Multiple Distribution — How your trades are spread across R. Trades without a stop loss cannot have an R and are counted separately, with the count shown.
- 2.7 Trades by Session — Sydney, Tokyo, London, New York. The size of each slice is the number of trades, not the win rate — two winning trades must not draw a bigger arc than two hundred.
Two things worth knowing before you quote these numbers.
- The growth chart is balance, not equity. MetaTrader keeps no history of floating profit and loss, so an equity curve cannot be reconstructed after the fact by anyone. Deposits and withdrawals are included, which is what makes the drawdown figure honest.
- Sharpe and Sortino here are per trade — no risk-free rate, not annualised. They are useful for comparing your own periods against each other, and should not be compared with a fund's published figures.
━━━━━━━━━━━━━━━━━━━━━━━━━━━━━━
3. 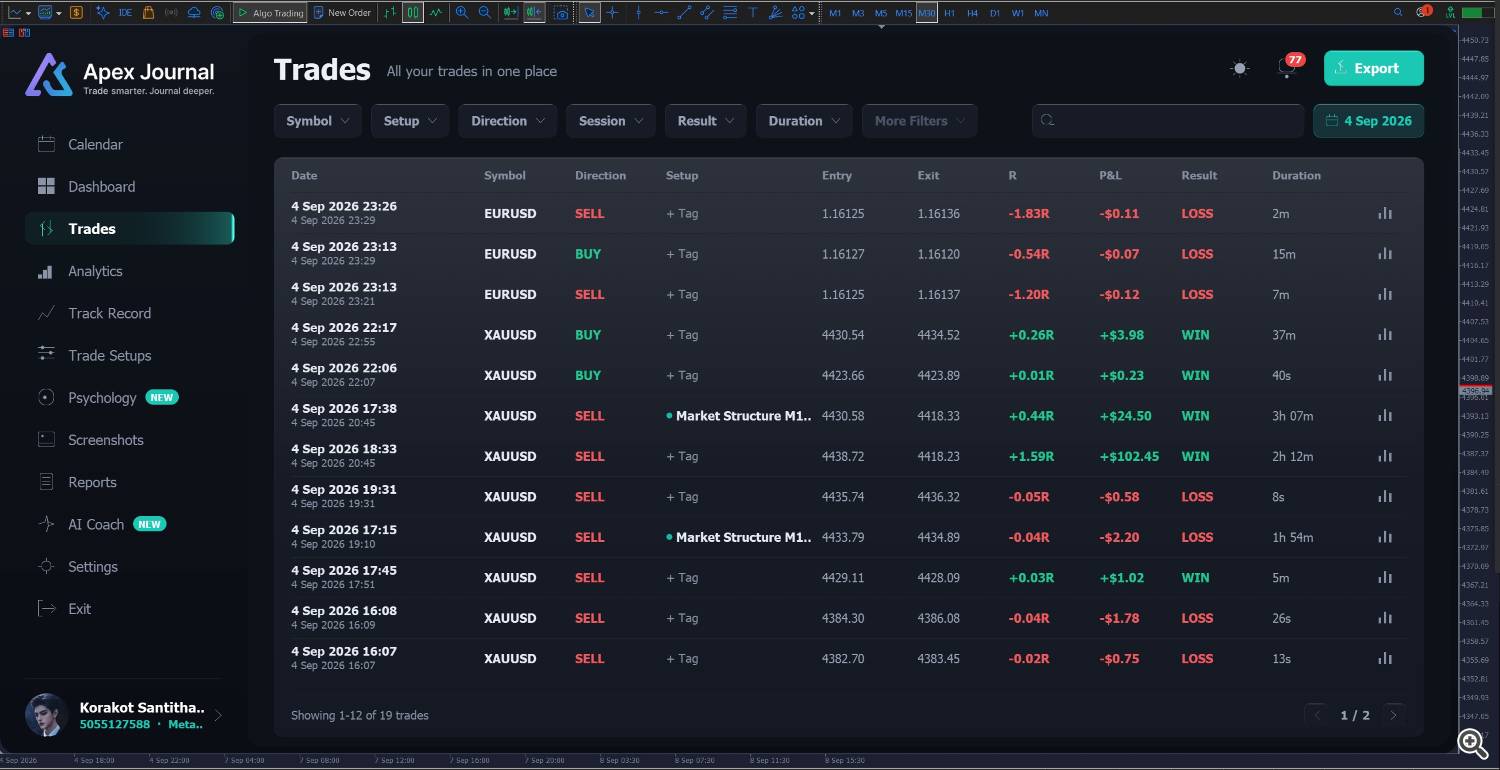
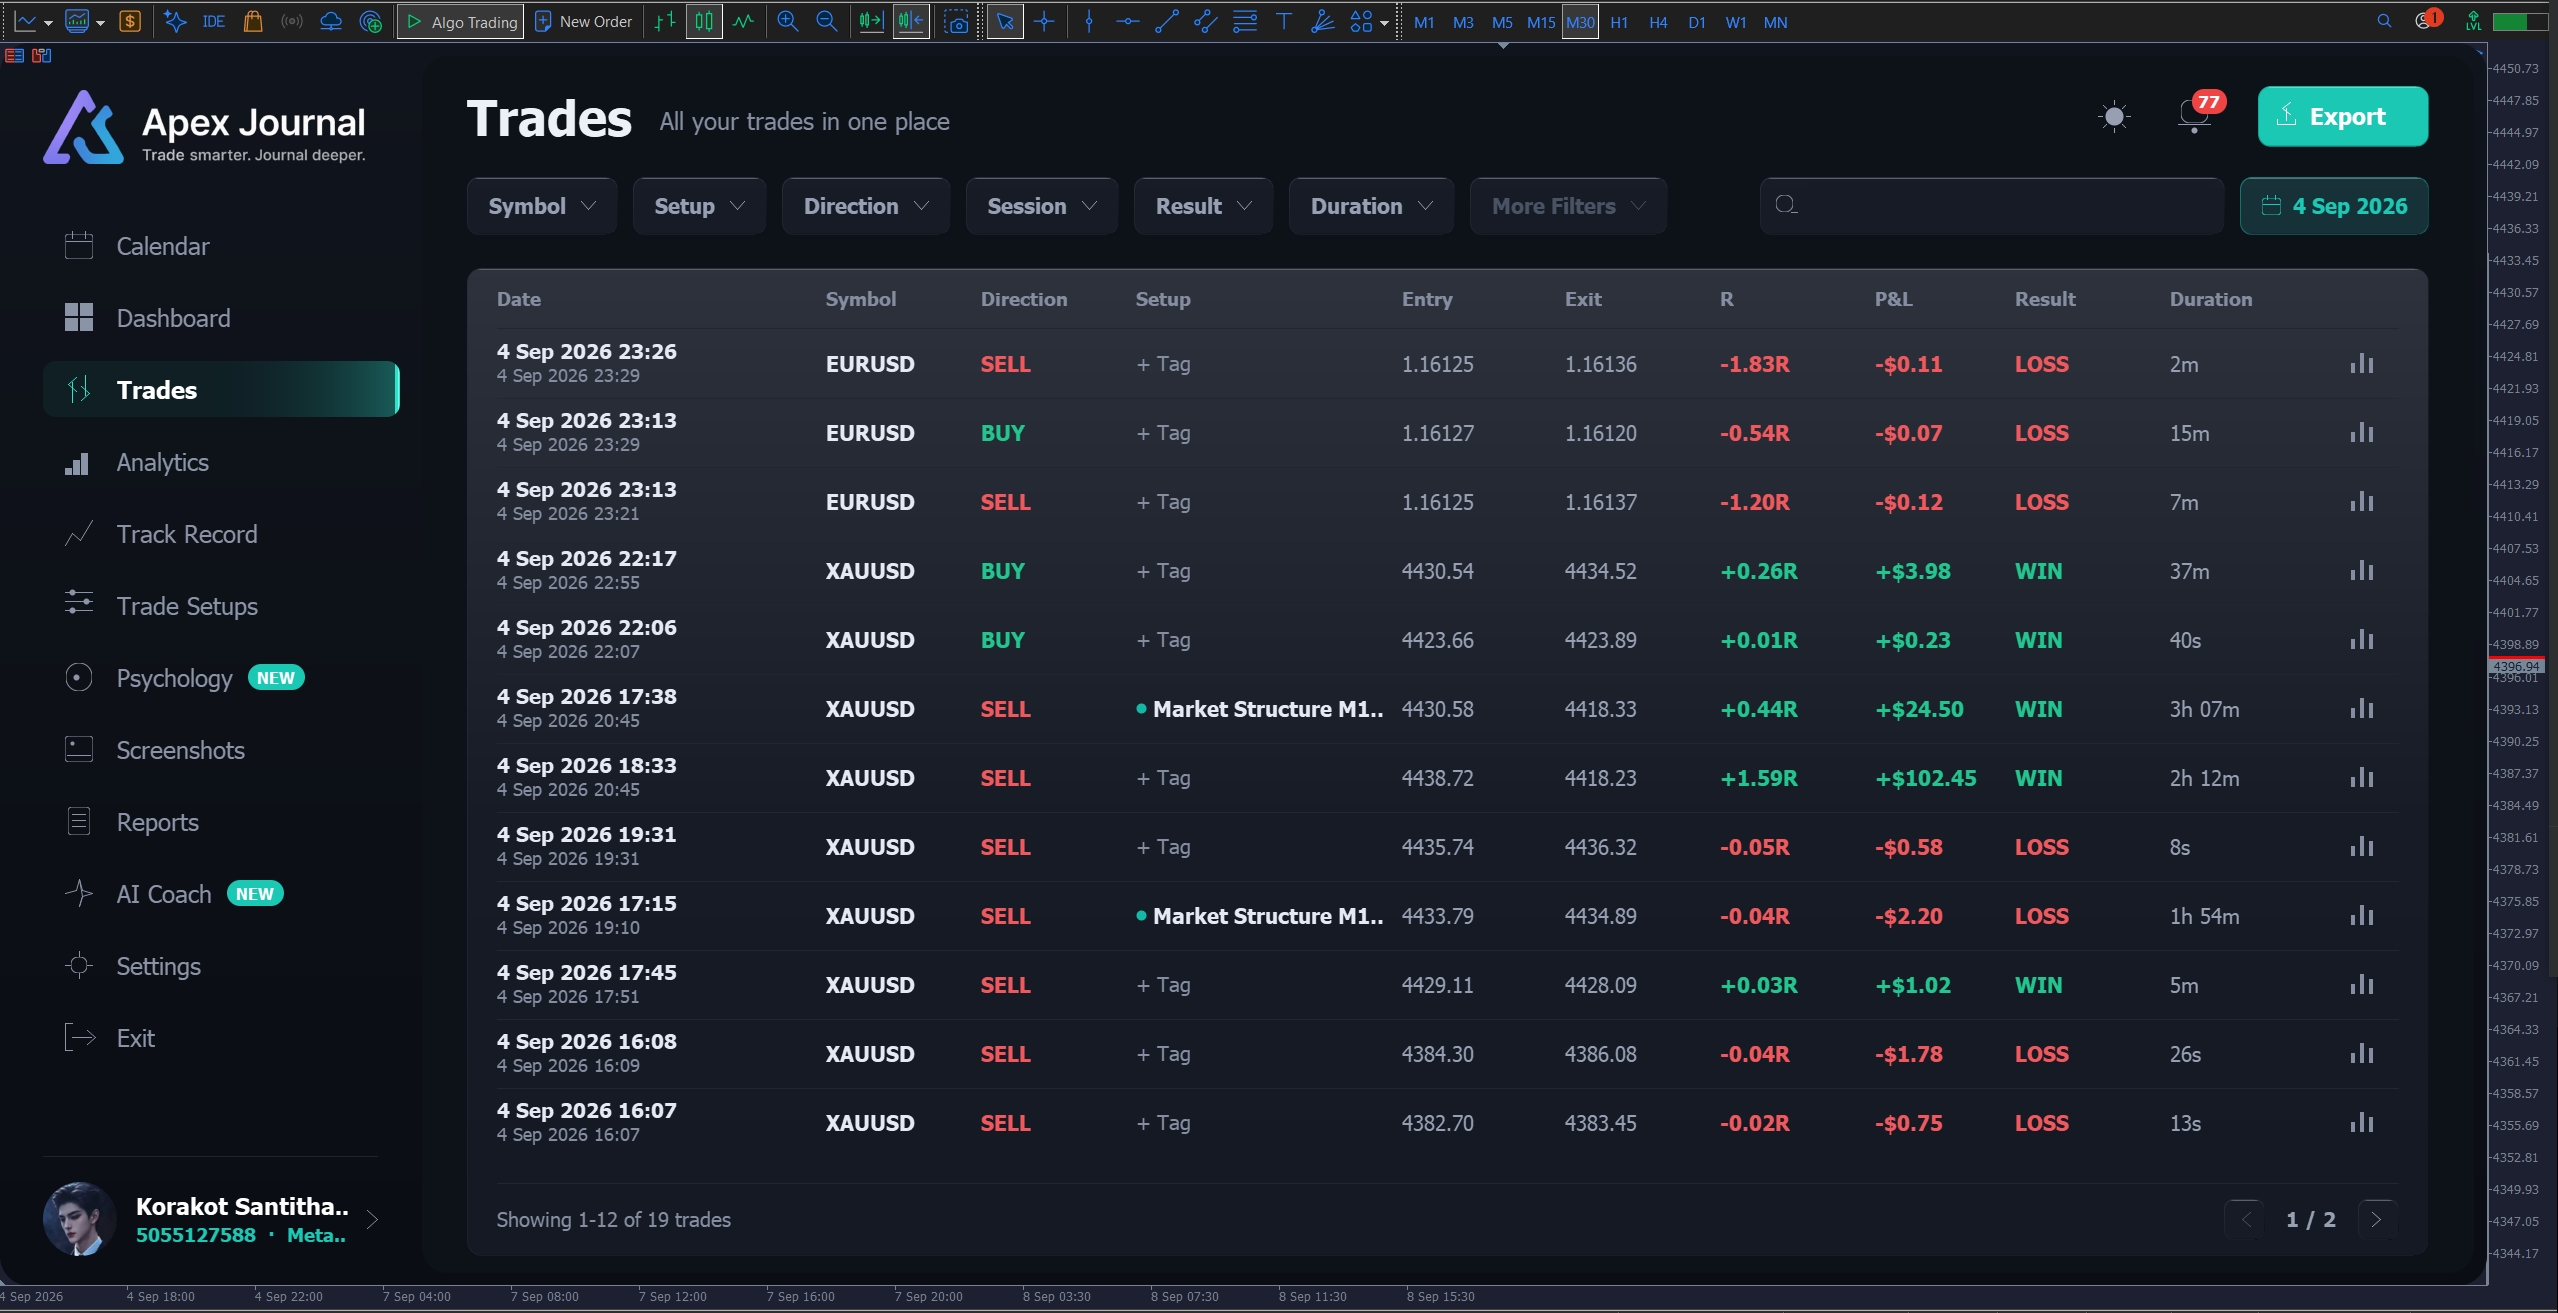
All your trades in one place.
Every closed trade as a filterable, searchable table.
1. Filtering
- 1.1 Date range — All time, This month, Last 30 days, This year. When you arrive from a calendar day it shows that single date instead, so the button never claims "All time" while something is filtered.
- 1.2 Chips — Symbol, Direction, Session, Result, Setup, Hold time and More Filters. Each opens a list; the first entry is always "all".
- 1.3 Search — Type to search the table. On a narrow window the chips are dropped from the right so the date button stays reachable.
2. The table
- 2.1 Columns — Date, Symbol, Direction, Entry, Exit, Setup, R, P&L, Result and Duration. Narrow windows drop columns from the least important rather than squeezing them.
- 2.2 Setup cell — The trade's primary setup, or + Tag if it has none. Trades with support tags show +n after the name.
- 2.3 Rows per page — Worked out from the real height of the window, so a taller window simply shows more.
- 2.4 Export — Writes the filtered list to CSV, ready for Excel. The window then tells you the exact path — a program sold on the MQL5 Market is not allowed to open a folder for you.
- 2.5 Click a row — Opens Trade Detail.
━━━━━━━━━━━━━━━━━━━━━━━━━━━━━━
Trade Detail
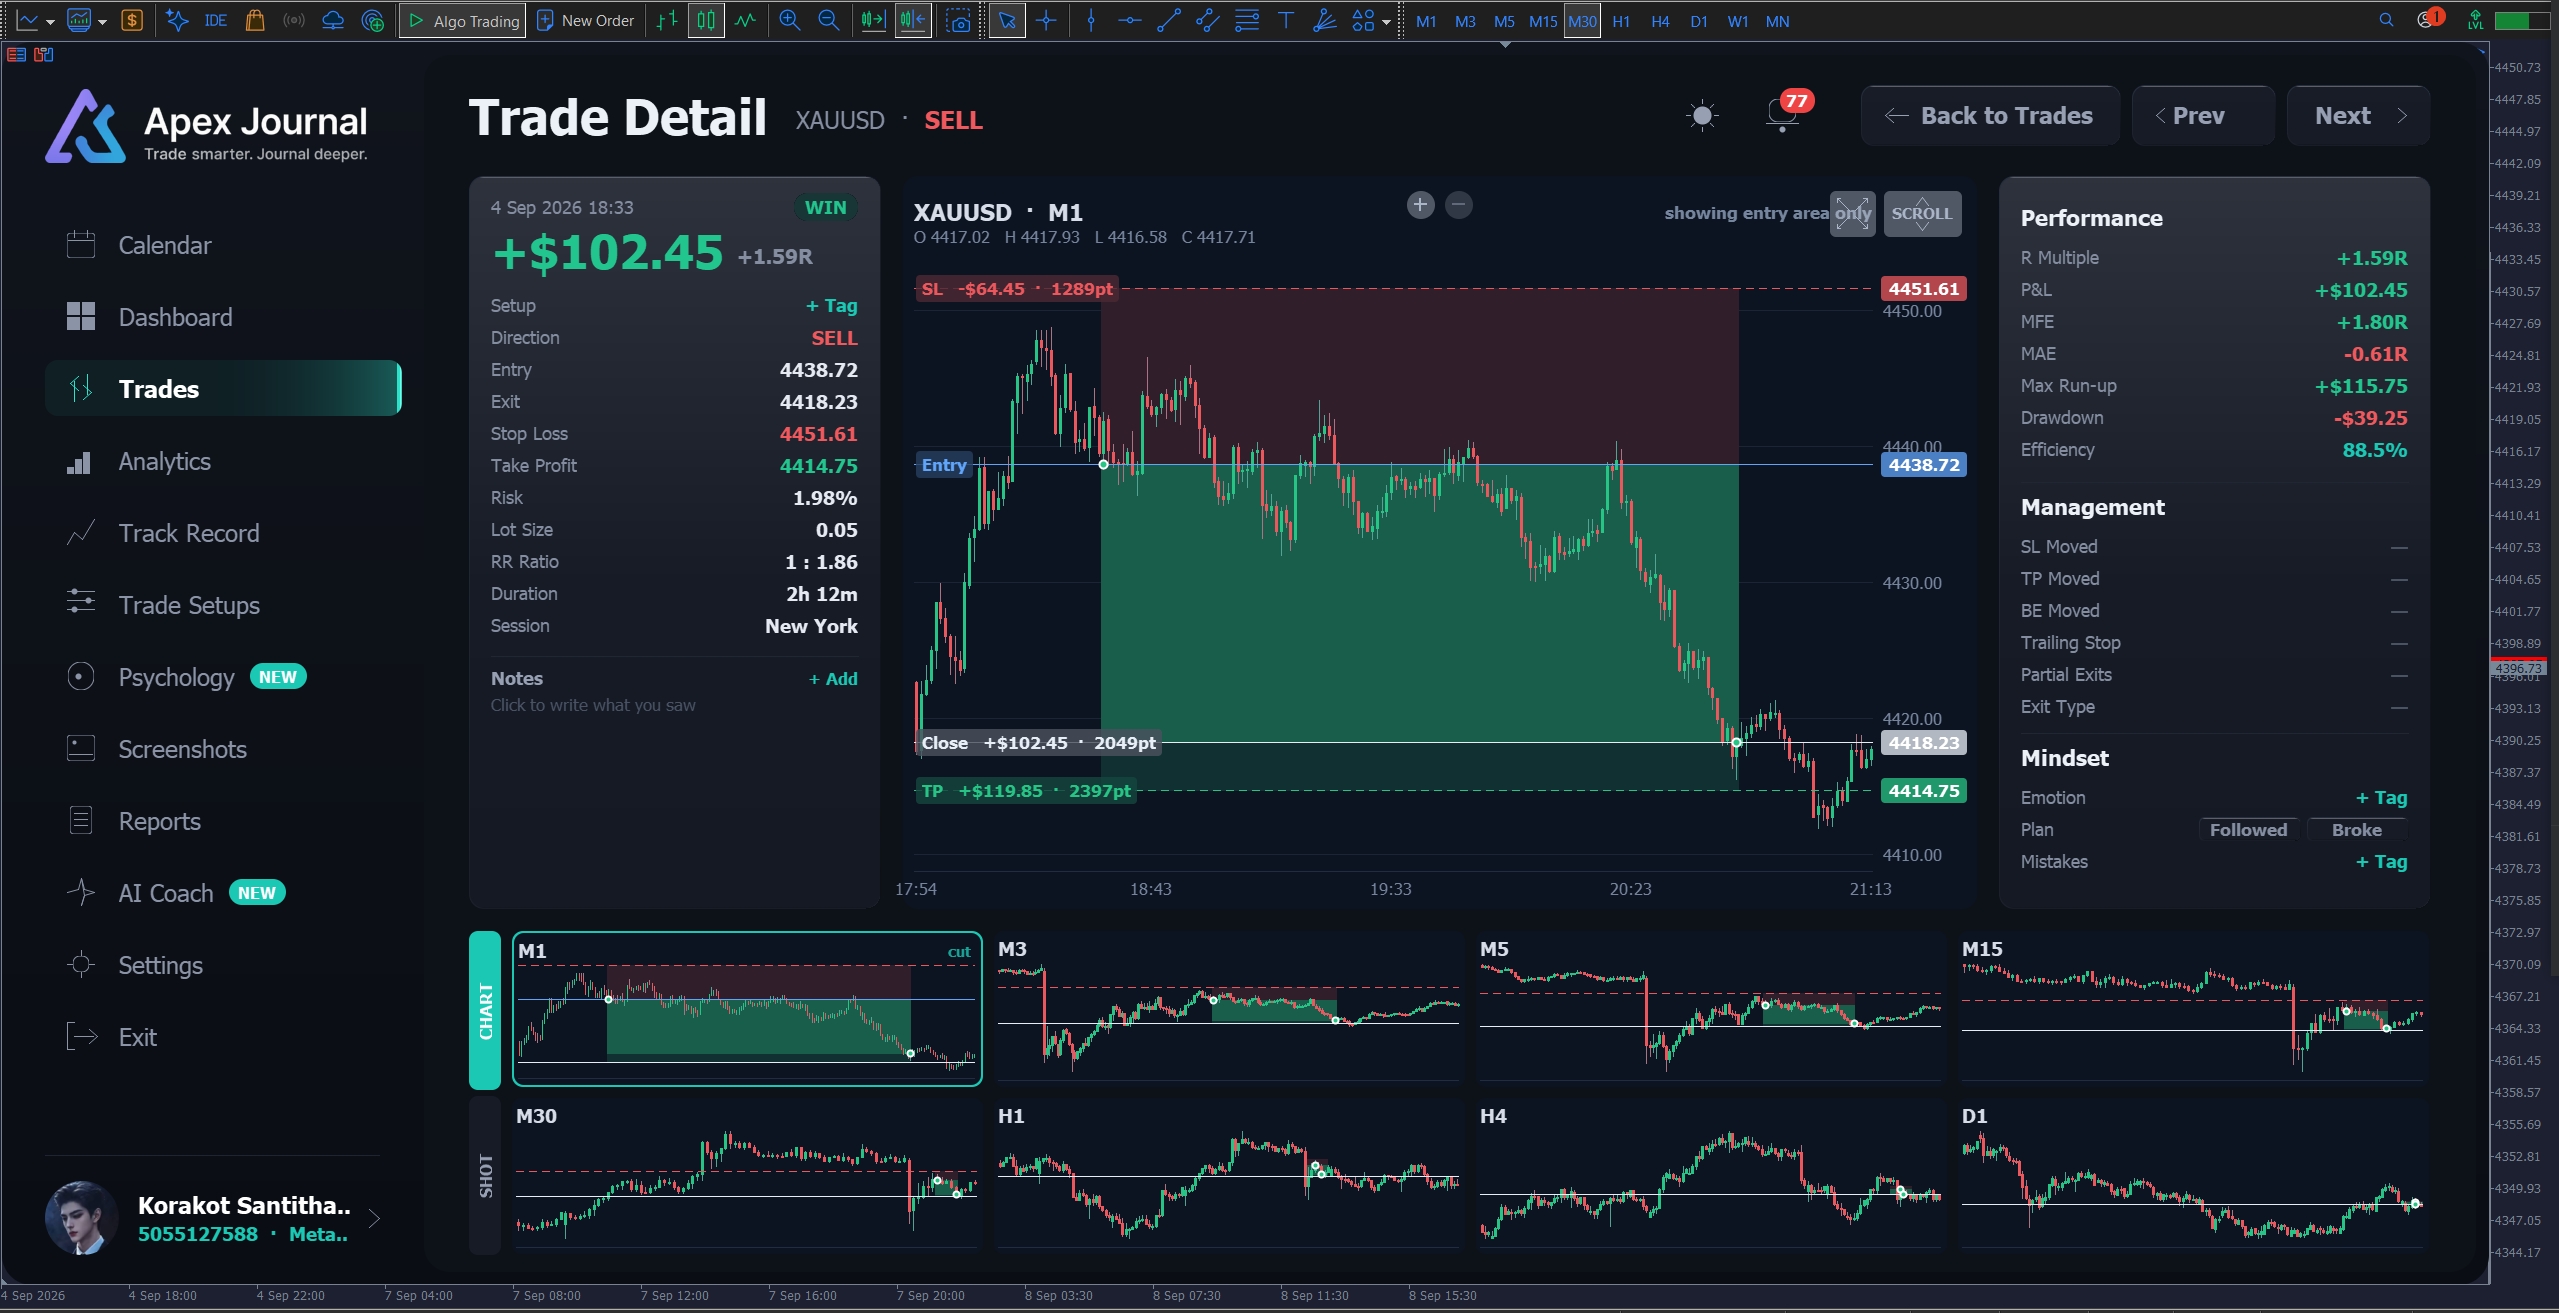
One trade, in full. Reached from the Trades table, from the Screenshots page, or from a chart card. Prev and Next walk through the filtered list and cross page boundaries; Back to Trades returns you where you were.
- 4.1 Chart — The trade drawn on real candles, with entry, exit and the levels it had. The timeframe is chosen from how long the trade lasted, so you always get a readable number of candles rather than a fixed period. If the terminal is still downloading history the chart says loading and fills in — that is not an error.
- 4.2 SHOT tab — Screenshots attached to this trade, if any.
- 4.3 Risk / Lot Size / R:R — What the trade risked, in money and in lots.
- 4.4 R Multiple, Max Run-up, Efficiency — What the trade actually made against what was on the table. Run-up and efficiency are measured from real price history, so they are available even for trades taken years ago.
- 4.5 Exits — Every partial close with its lot and its share of the position.
- 4.6 Partial Exits / Exit Type — Whether the position was scaled out of, and how the last piece left: manual, from the phone, from the web terminal, by an Expert Advisor, a stop out or a rollover.
- 4.7 BE Moved / Trailing Stop — Whether the stop was moved to break even, and how many times it was trailed. These are read from the recorded events; where nothing was recorded the field shows an em dash with the reason — MetaTrader keeps no history of stop loss and take profit changes, so a trade managed outside ApeX simply cannot be reconstructed.
- 4.8 SL / TP History — The full list of level changes for the trade, with the time, what moved and by how much. Available for trades ApeX was watching.
- 4.9 + Set — Where a stop loss or take profit was never on the server, you can type the one you actually had in mind. It is stored as your own figure and labelled typed everywhere it is used, so a number you supplied is never mistaken for one the broker reported. This is what lets an account traded without server-side stops still produce R statistics.
- 4.10 Checklist — The rules of the trade's setup, with what you answered. Ticks made before entry and ticks made afterwards are both kept.
- 4.11 Notes — Free text: what you saw and why you took it. The editor scrolls, takes any keyboard layout, and has Copy, Paste and Insert.
- 4.12 Mindset — The emotion you tagged, whether you Followed or Broke your plan, and any mistakes flagged.
━━━━━━━━━━━━━━━━━━━━━━━━━━━━━━
4. Analytics
Analyze trade management quality.
Four tabs, each answering one question about how you trade rather than how much you made. All four obey the range button in the header.
1. MFE / MAE
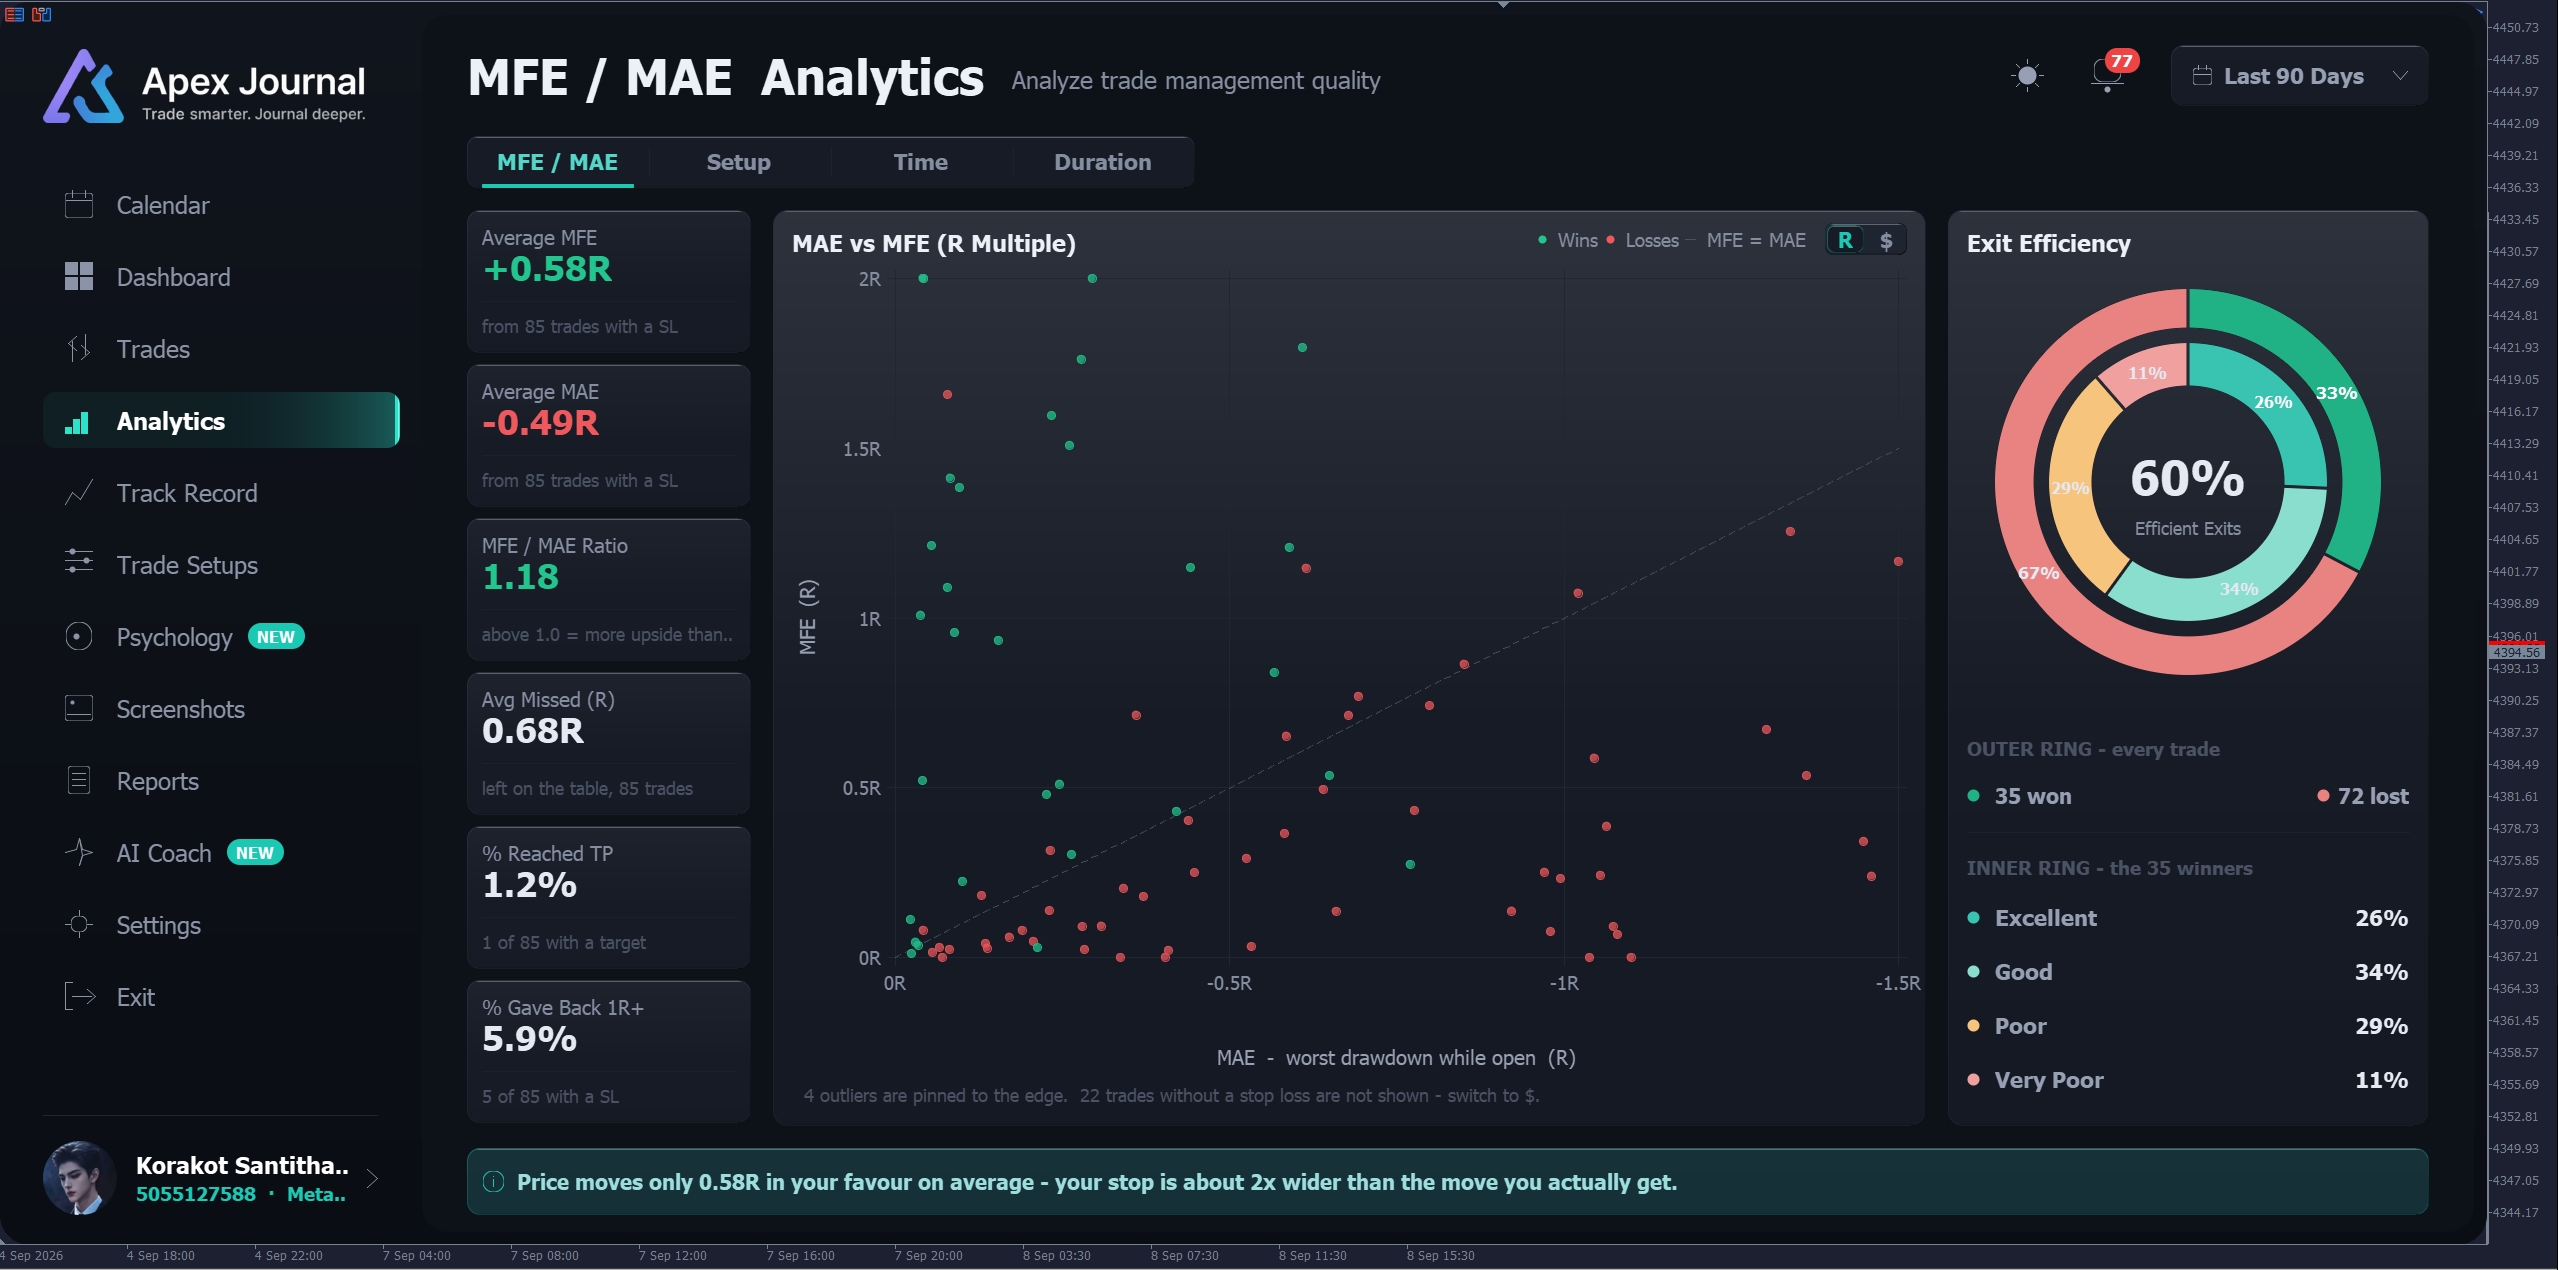
How far price went your way, and how far it went against you, while each trade was open.
- 1.1 Scatter — Every trade plotted as run-up against drawdown, winners and losers separated, with the break-even diagonal drawn. Shown in money or in R.
- 1.2 Tiles — Average MFE and MAE, their ratio, average missed move, the share of trades that reached their target, and the share that were up 1R or more before closing at a loss.
- 1.3 Exit Efficiency donut — Winners rated Excellent, Good, Poor or Very Poor by how much of the available move they captured. The outer ring is every trade, the inner ring only the winners.
- 1.4 Insight line — One plain sentence about what the numbers say: stops too wide for the move you actually get, winners cut early, targets too far out, or profit given back. If there is not enough data it says so instead of guessing.
2. Setup
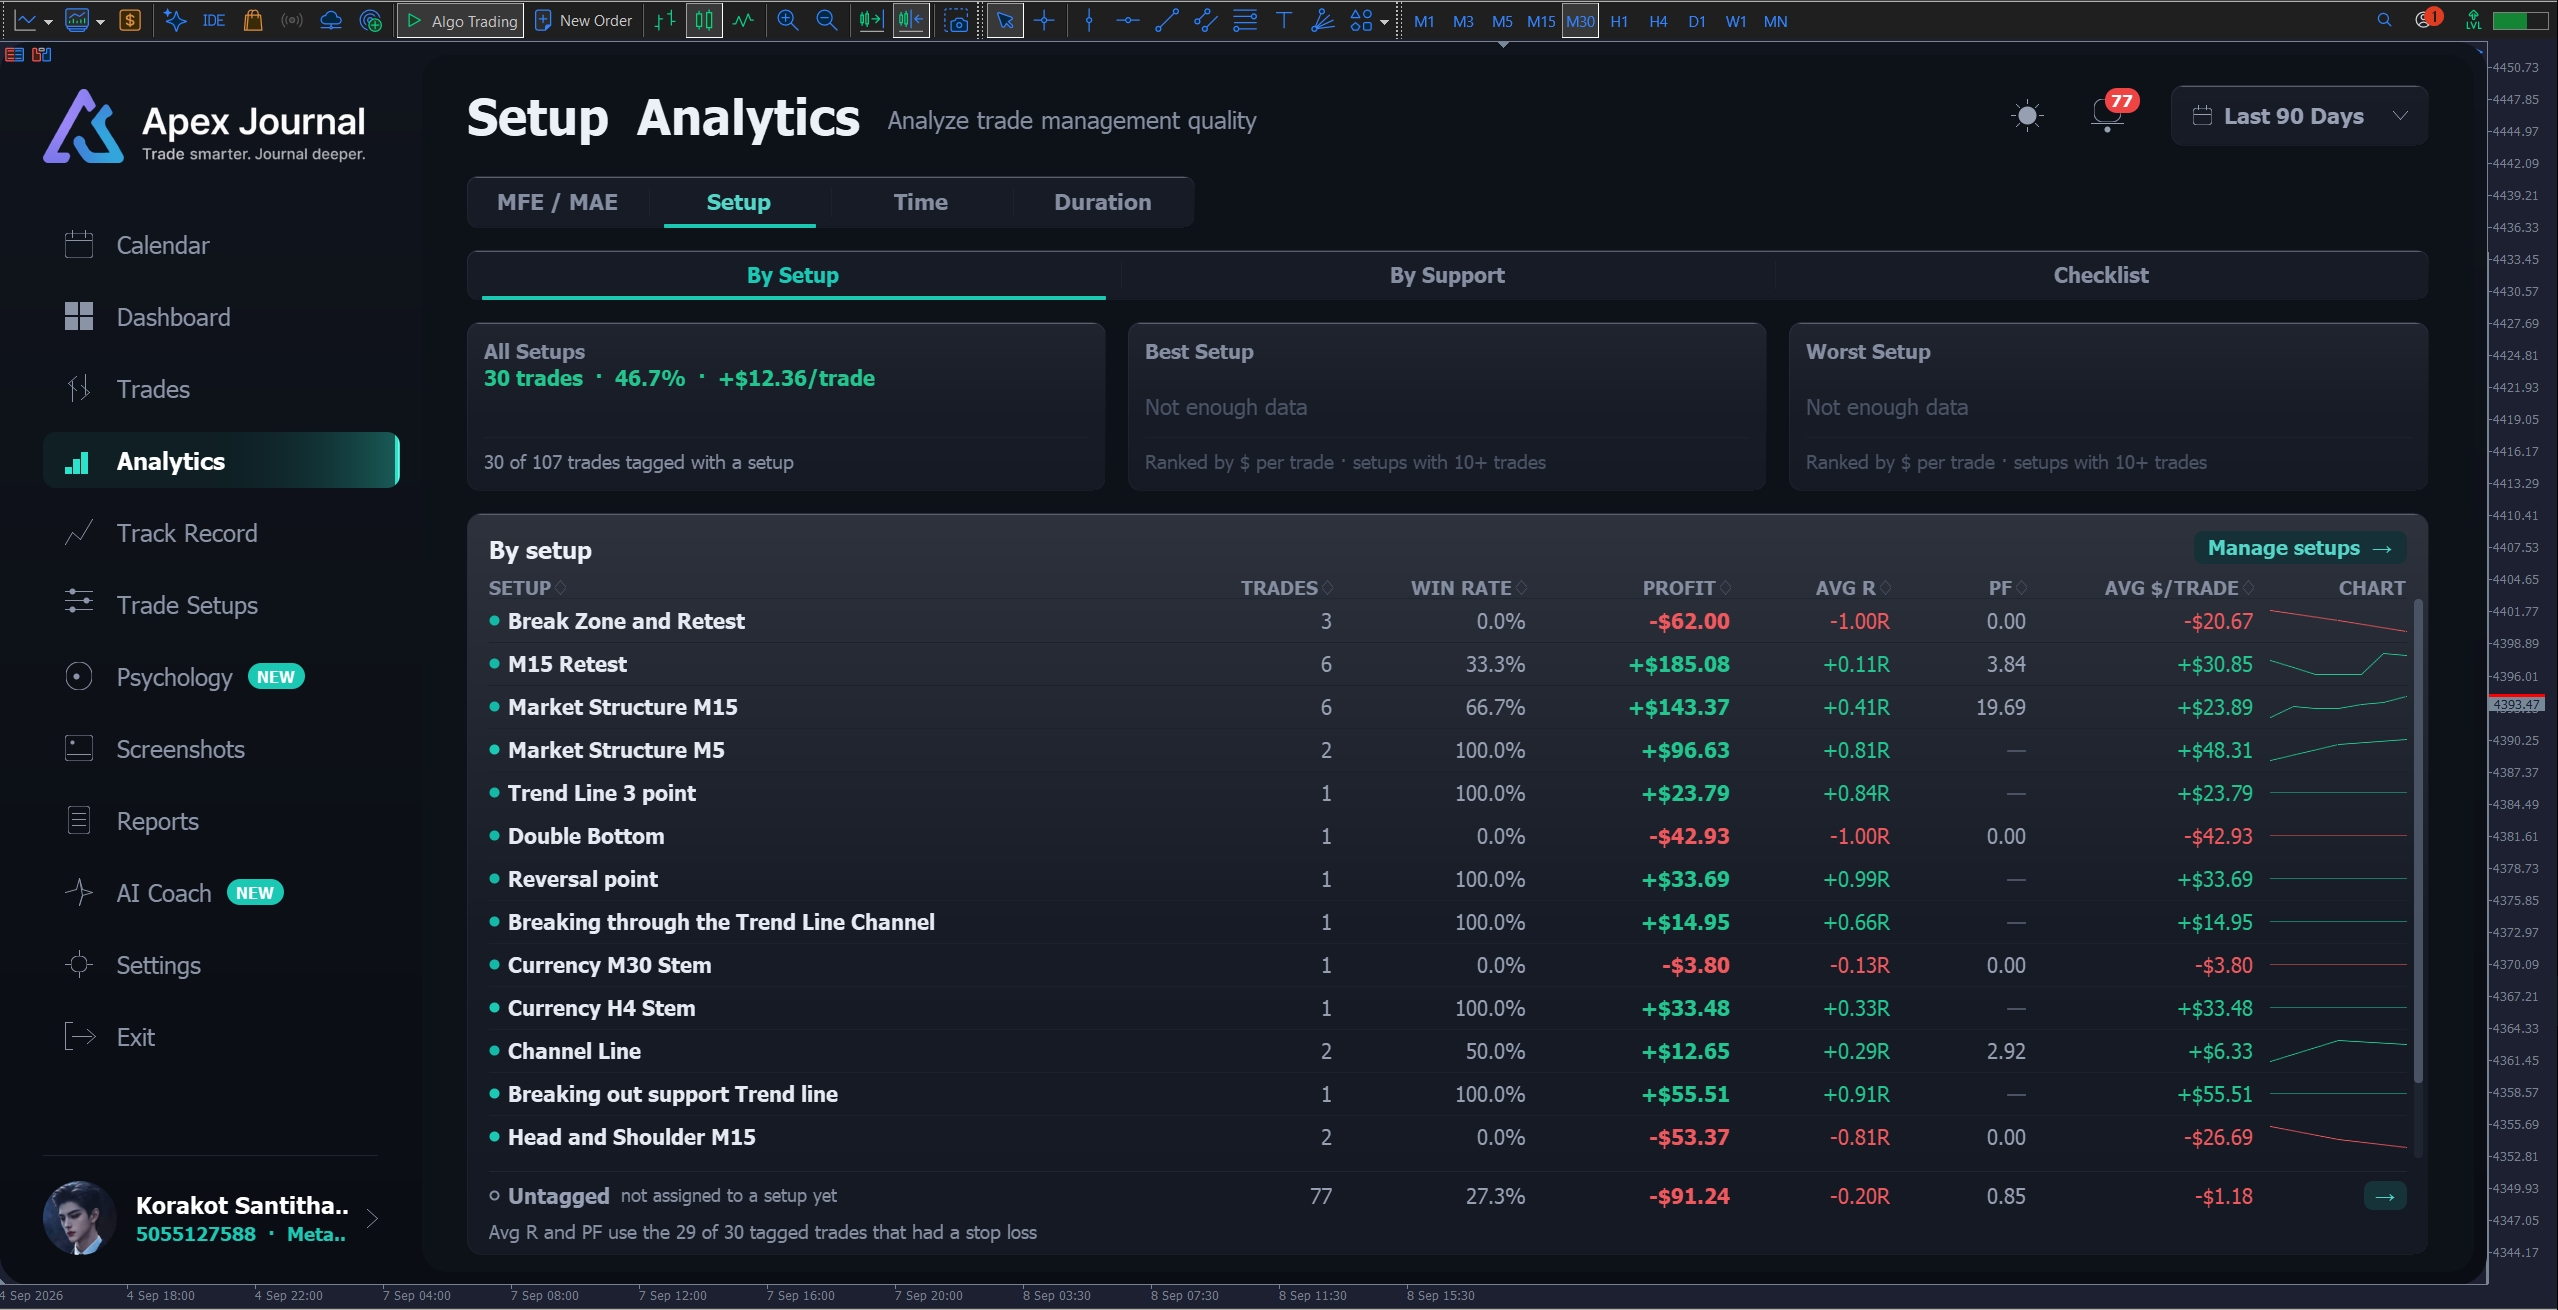
- 2.1 By Setup — A sortable table of your setups ranked by result per trade, with the best and worst named. Only setups with at least ten trades are ranked — below that the page says there is not enough data rather than showing a faint number.
- 2.2 By Support — What happens to a base setup when a second tag is also present. One trade can appear in several rows on purpose: the question is "trades that also had this tag", not a split of your trades.
- 2.3 Checklist — Per checklist item: how often it was answered, how often it was kept, and the average R when kept against when missed. Rules marked Required are separated out, and the page reminds you that rules are usually missed together, so one line is not proof of causation.
3. Time
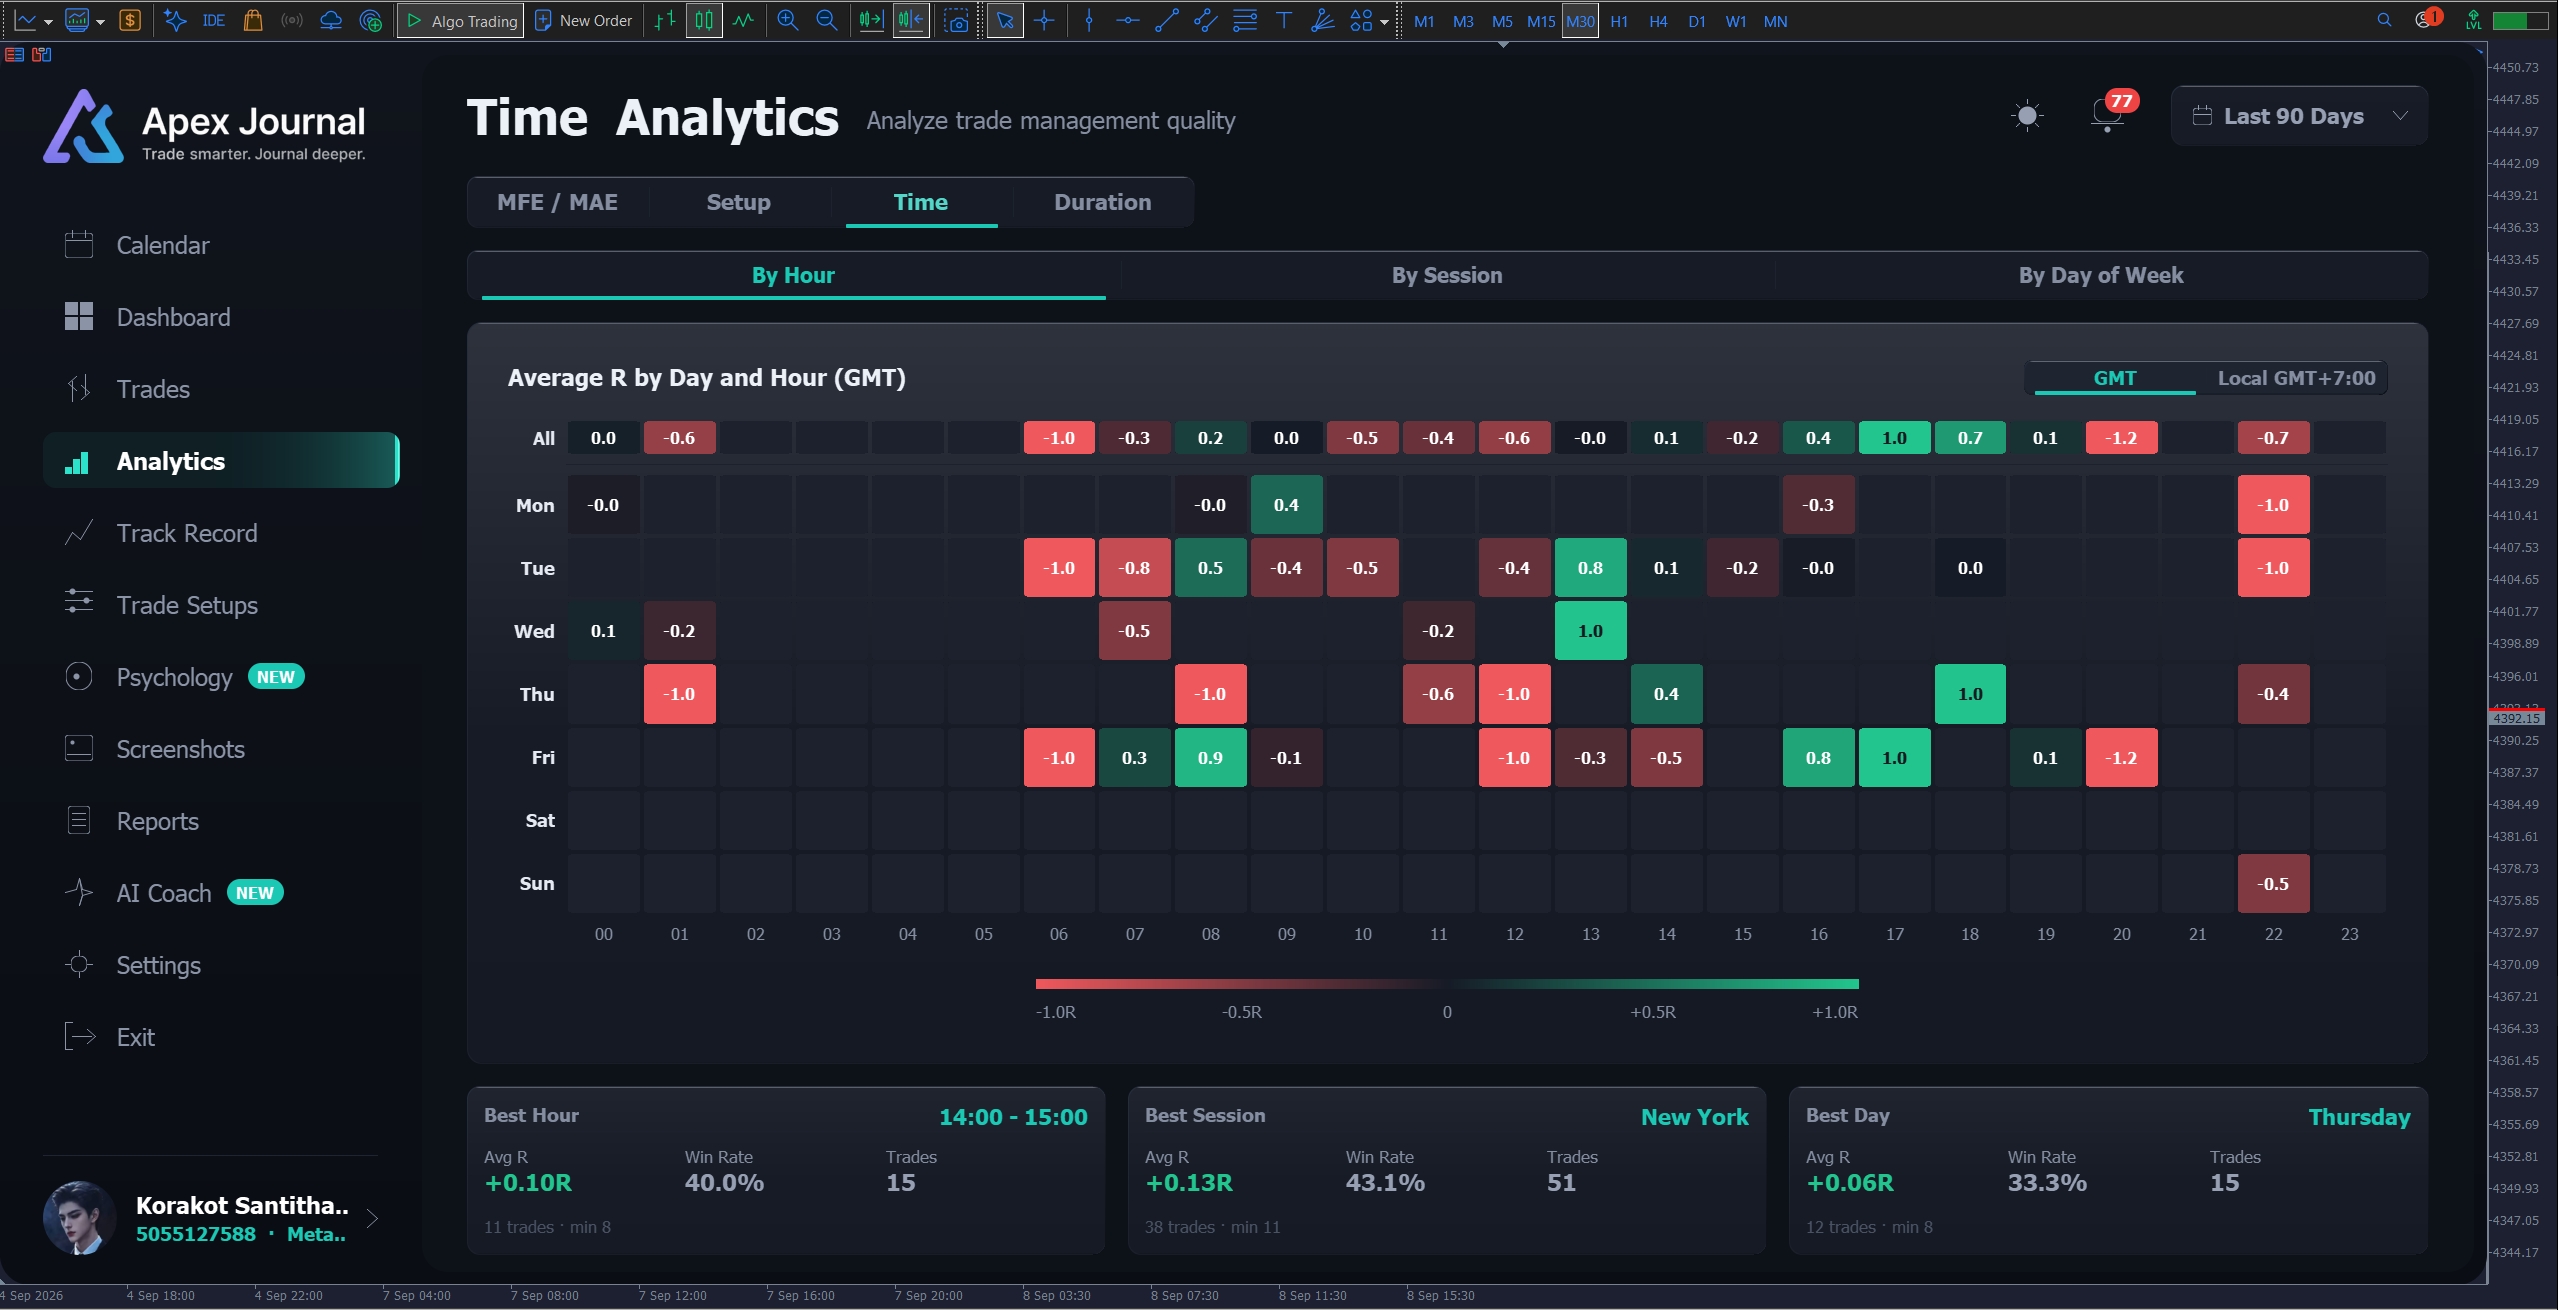
- 3.1 By Hour — A 7 × 24 heatmap of average result by day and hour, with a 24-hour bar underneath. Shown in your local time or GMT.
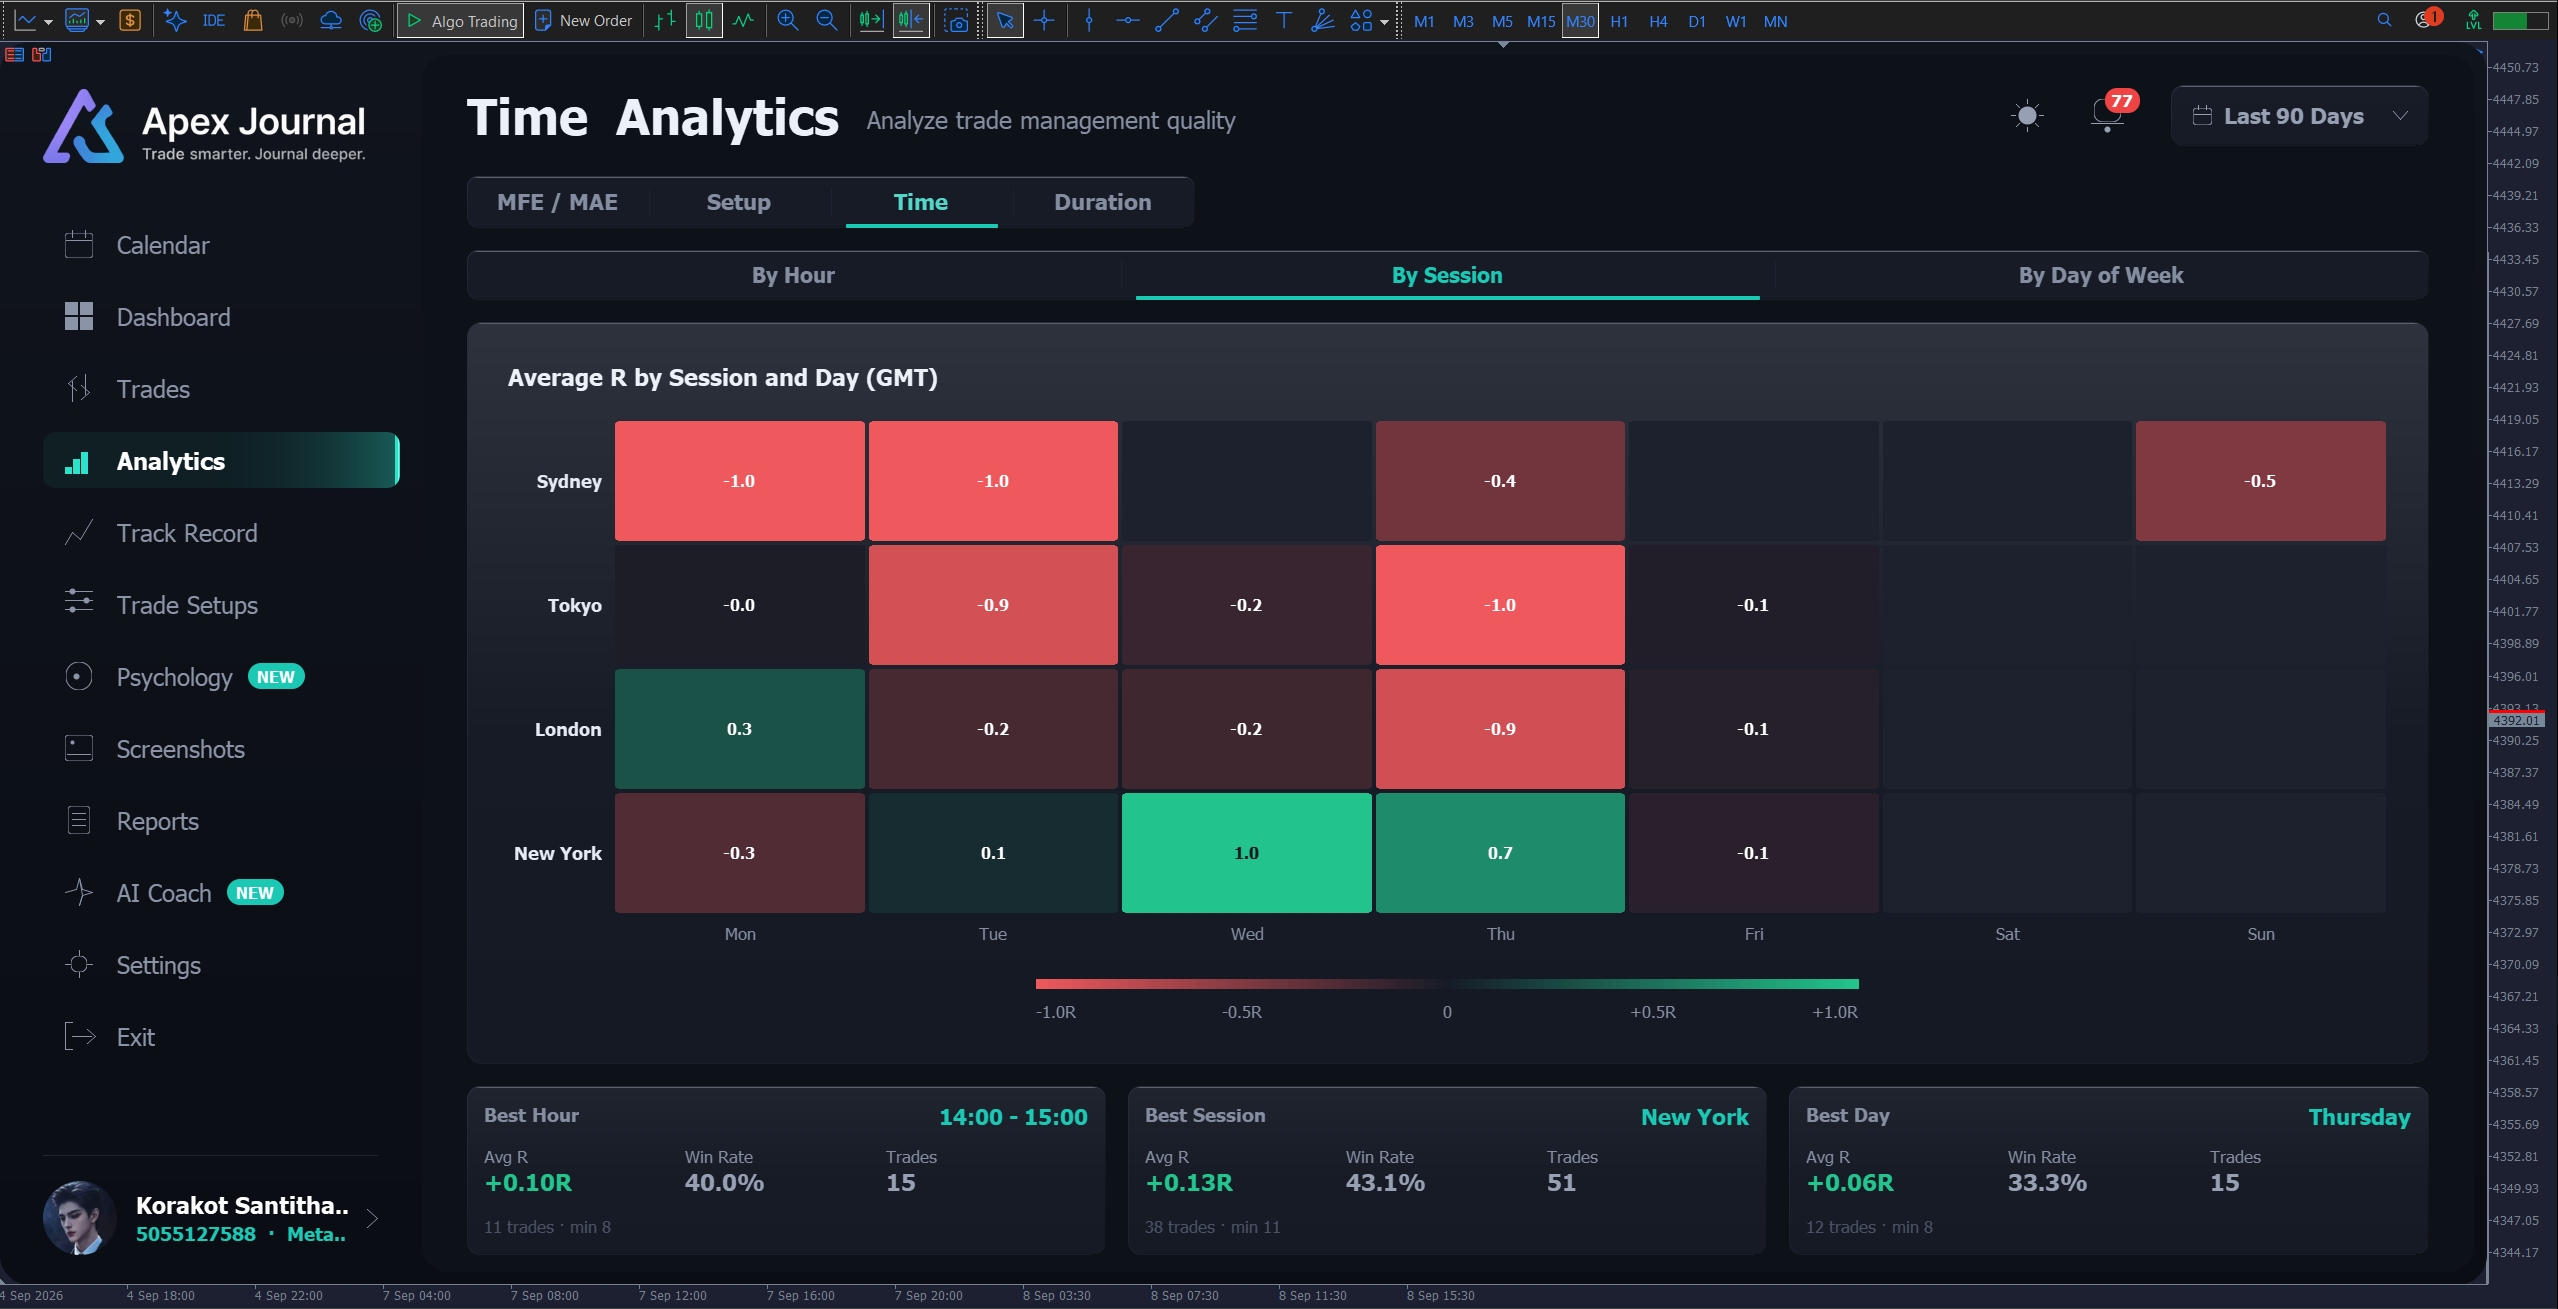
- 3.2 By Session — Session against day of week.
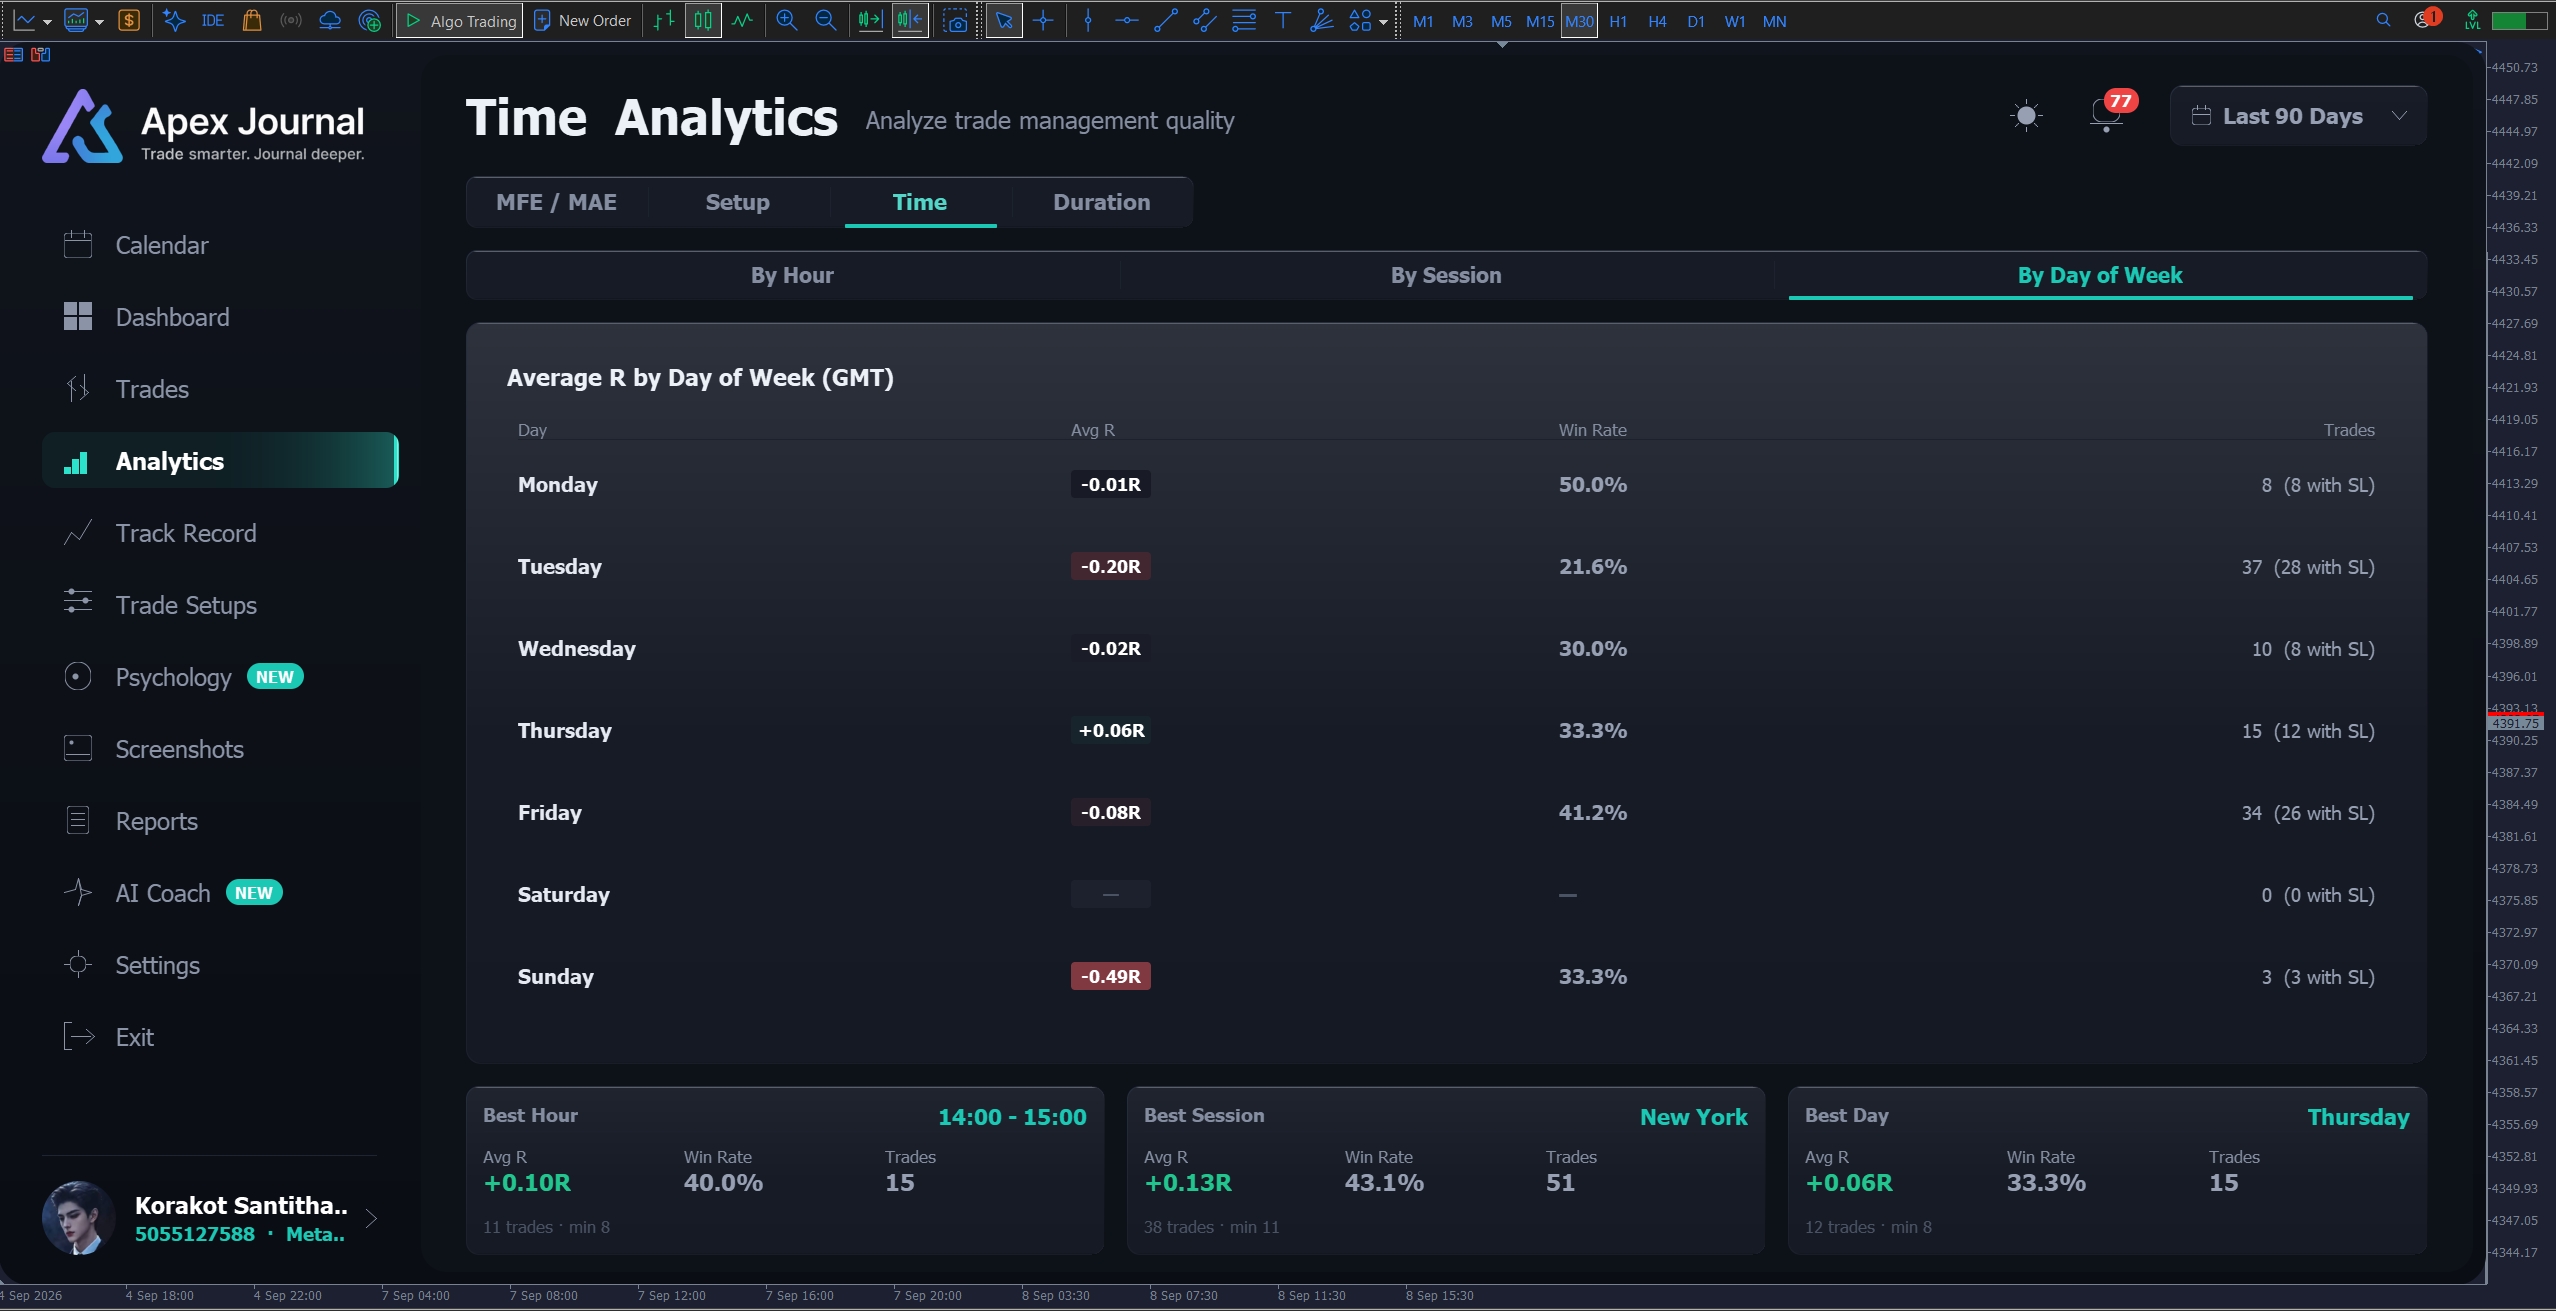
- 3.3 By Day of Week — The plain weekday summary, with your best day named.
4. Duration
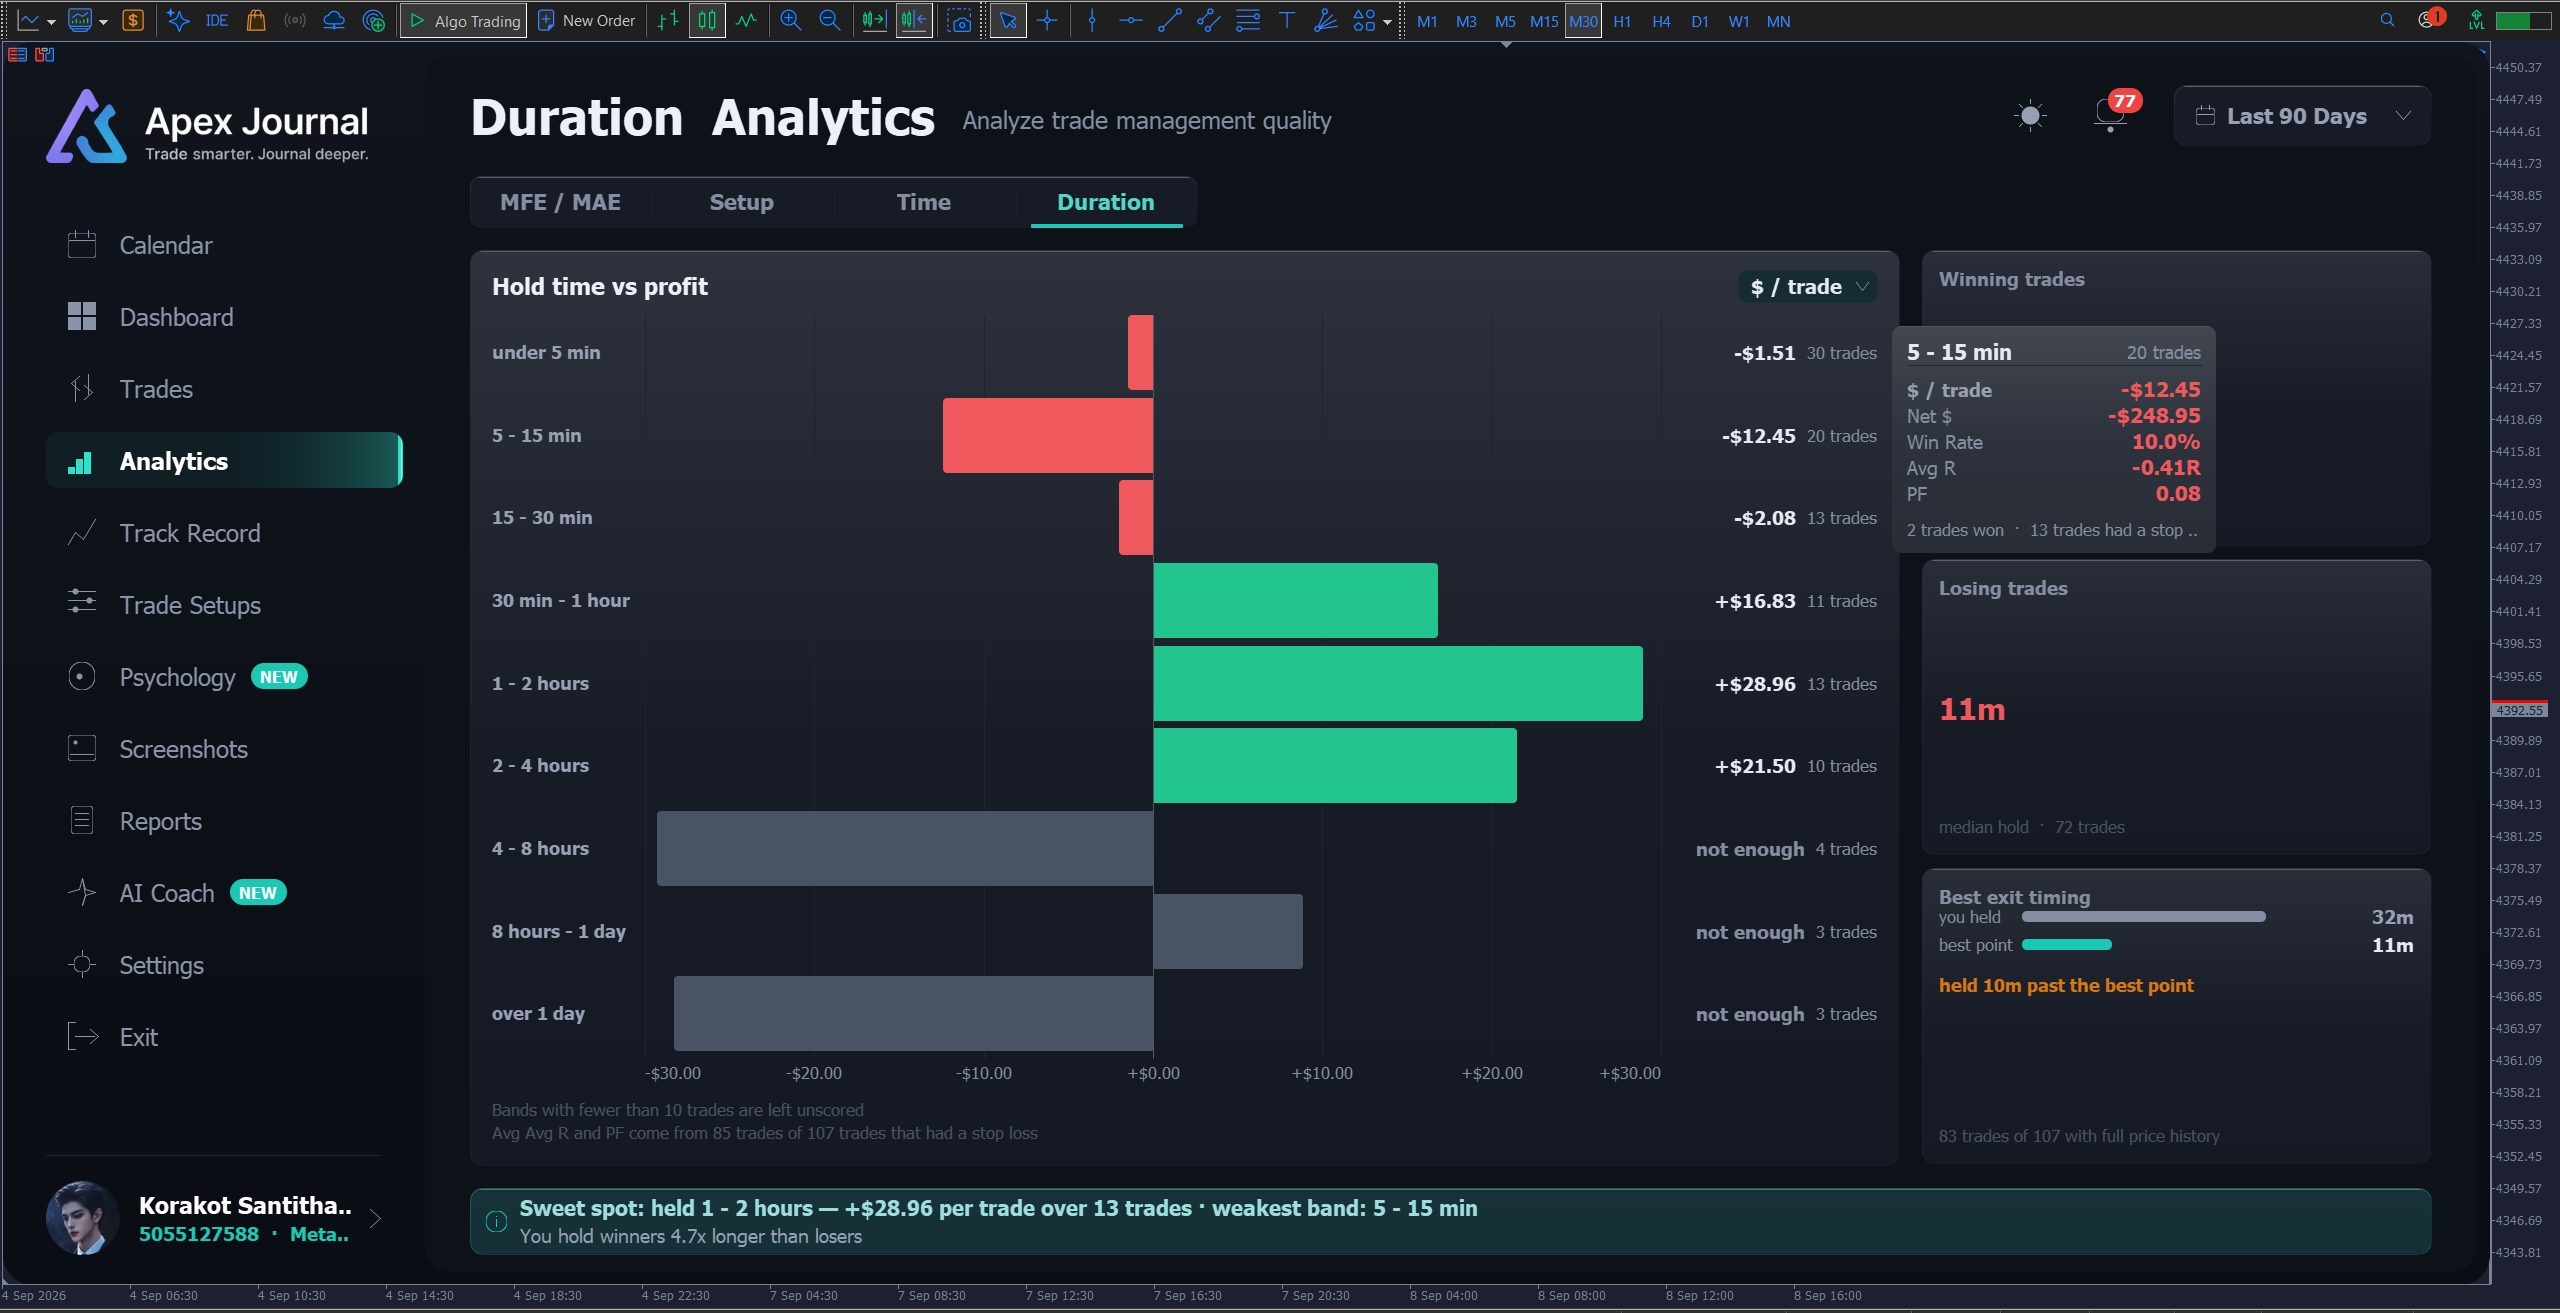
The question no ordinary journal answers: how long should you be holding?
- 4.1 Nine hold-time bands — from under 5 minutes to over a day, each scored on expectancy, net, win rate or profit factor. The baseline moves with the unit you pick (zero for money and R, 50% for win rate, 1.0 for profit factor), so a bad band never draws as a good one. Bands with too few trades are left unscored.
- 4.2 Winning trades vs losing trades — The median hold time of each, and which way round you are. Holding losers longer than winners and holding winners longer than losers are both stated plainly; when the two are within a small factor of each other the page refuses to call it.
- 4.3 Best exit timing — Where price actually peaked in your favour against where you got out, taken from real price history, and by how much you tend to overstay.
- 4.4 Click a band — Jumps to the Trades page filtered to that hold time, carrying your date range with it. Bands with no trades cannot be clicked.
━━━━━━━━━━━━━━━━━━━━━━━━━━━━━━
5. Track Record
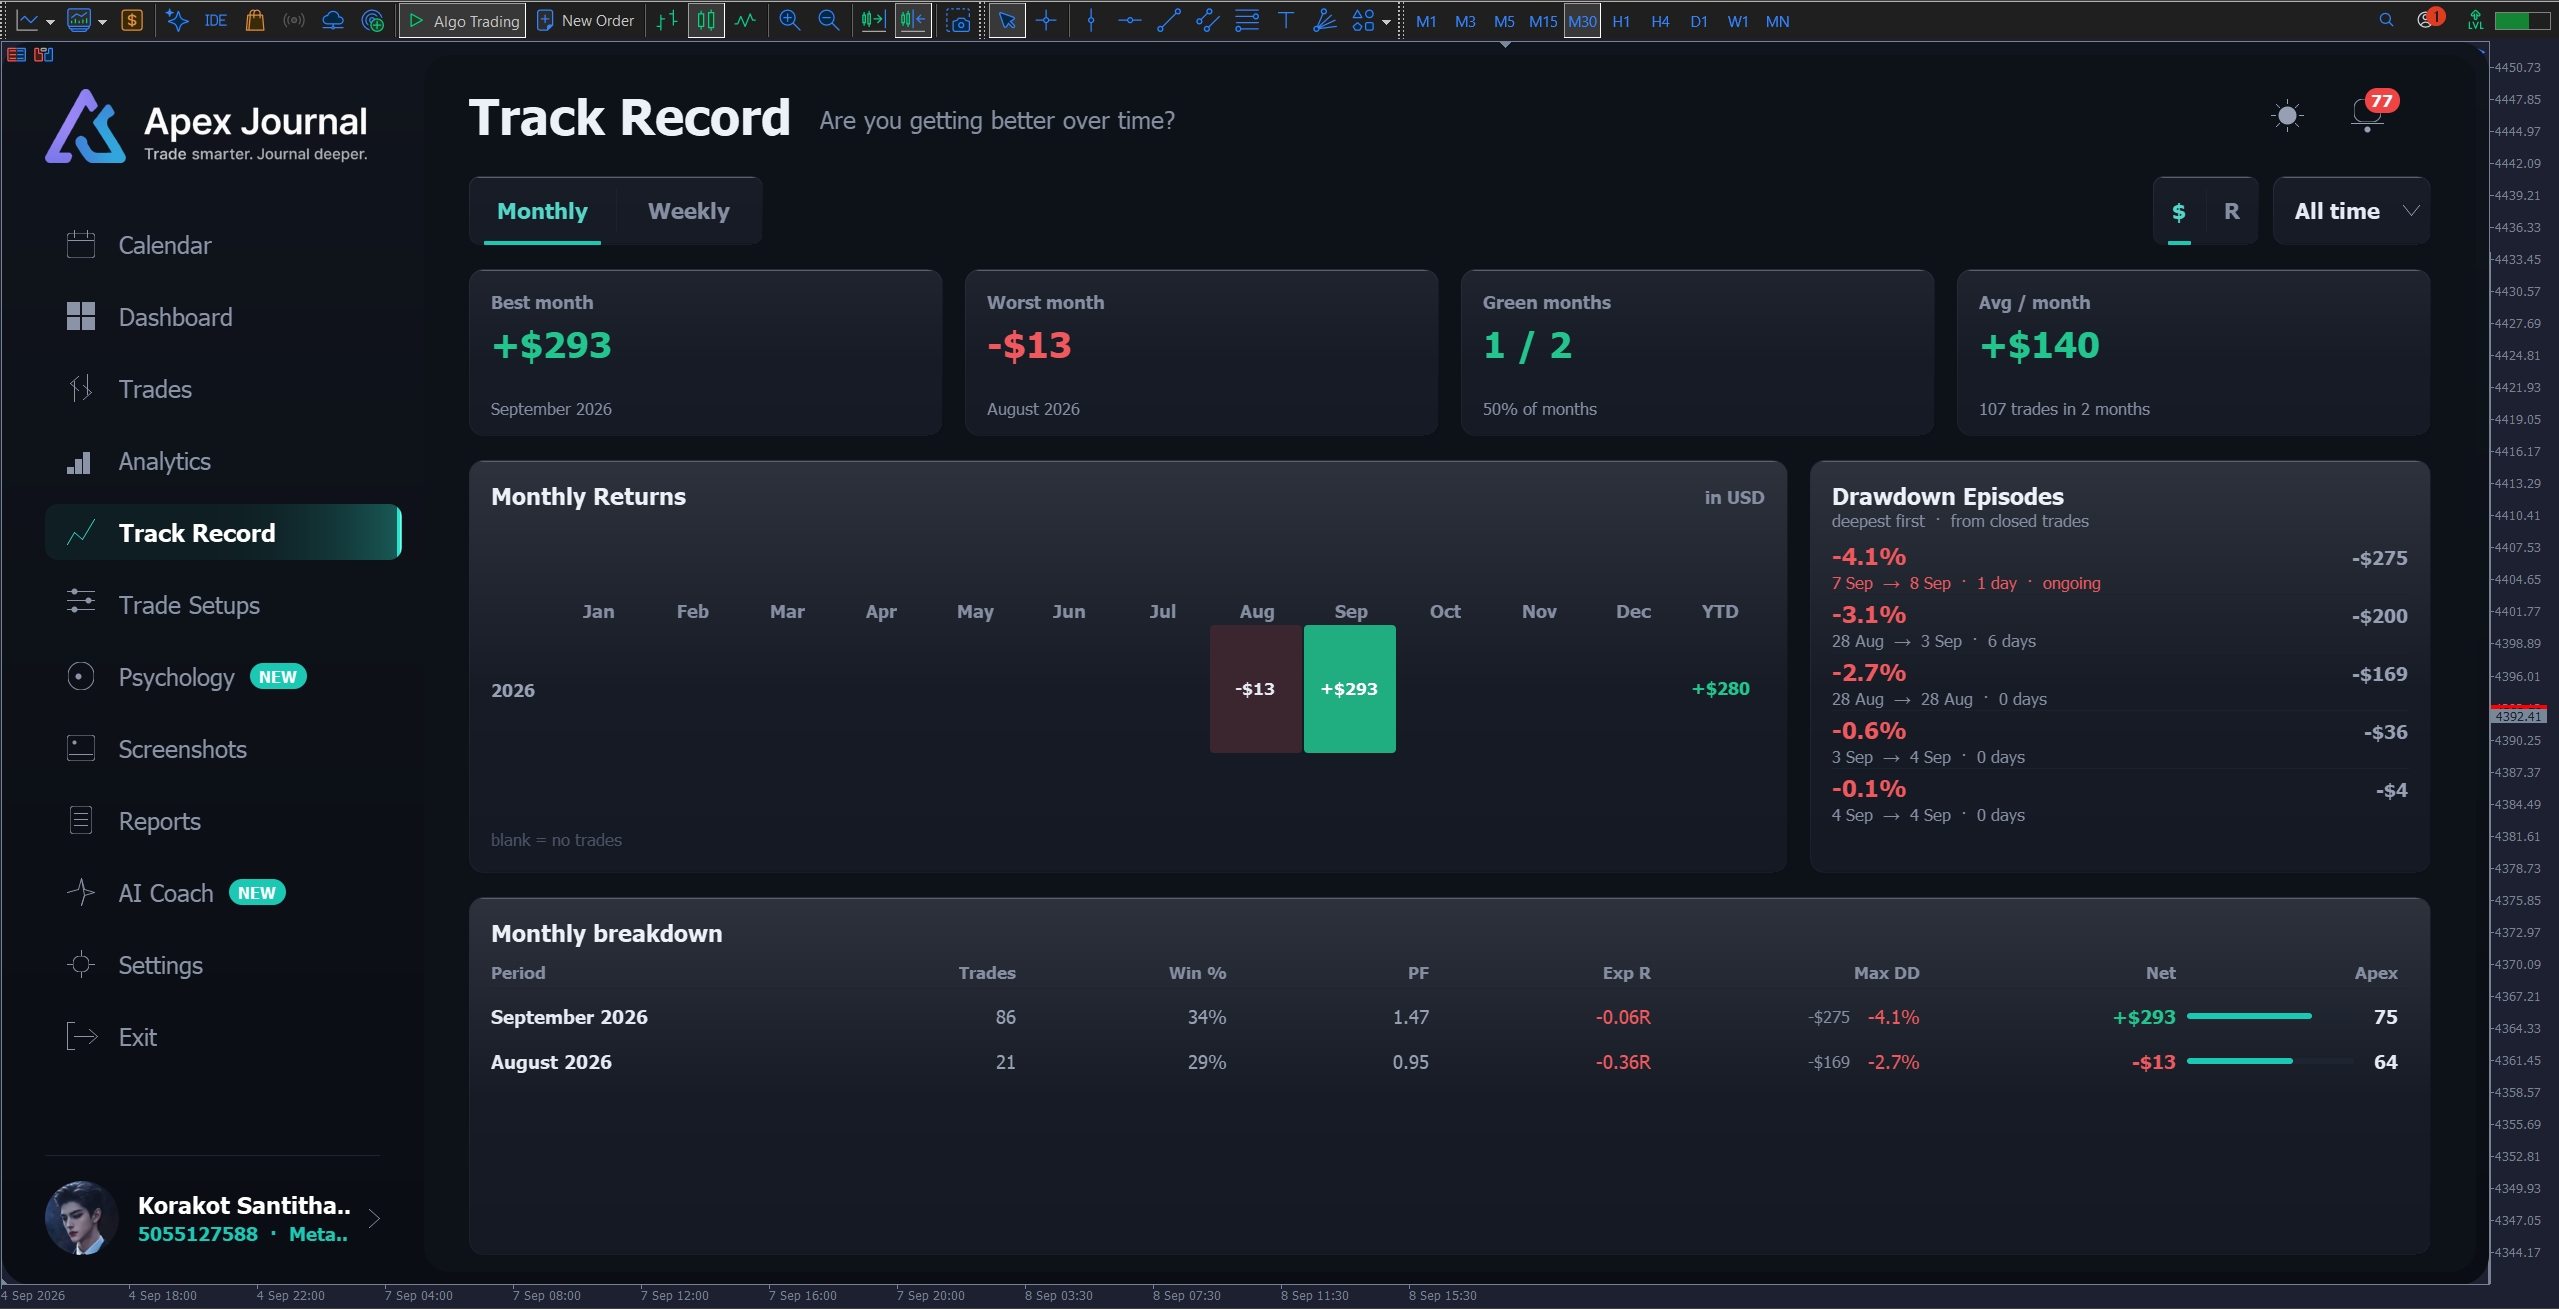
Are you getting better over time?
Not another dashboard — this page puts many finished periods side by side.
- 5.1 Monthly / Weekly — The unit of the whole page.
- 5.2 Monthly Returns heatmap — Years down, months across, coloured by the unit you choose. It reads in three states, never two: blank means you did not trade, a grey dash means the period cannot be measured in this unit, and colour means it can. Colour intensity is normalised across the whole grid, so a bad month is not flattered by the year it sits in.
- 5.3 Tiles — Best and worst period, share of green periods, and average per period. The green share is calculated from measurable periods, not from all of them.
- 5.4 Drawdown Episodes — Your deepest drawdowns, worst first, with how long each lasted and whether it is still running. Where a deposit or withdrawal falls inside one, the card says incl. transfer instead of hiding it.
- 5.5 Breakdown table — Every period as a row: trades, win rate, expectancy, max drawdown, net and its Apex score. Sorted newest first, and sortable by any column.
- 5.6 Click a period — Opens that period on the Reports page. Track Record is the map; Reports is the page.
The period boundaries here are the same ones Reports uses, deliberately — a month on this page and a month on that page always contain the same trades. Max drawdown per period is measured from the balance at the start of that period, which is why the number matches Reports on every single period.
━━━━━━━━━━━━━━━━━━━━━━━━━━━━━━
6. Trade Setups
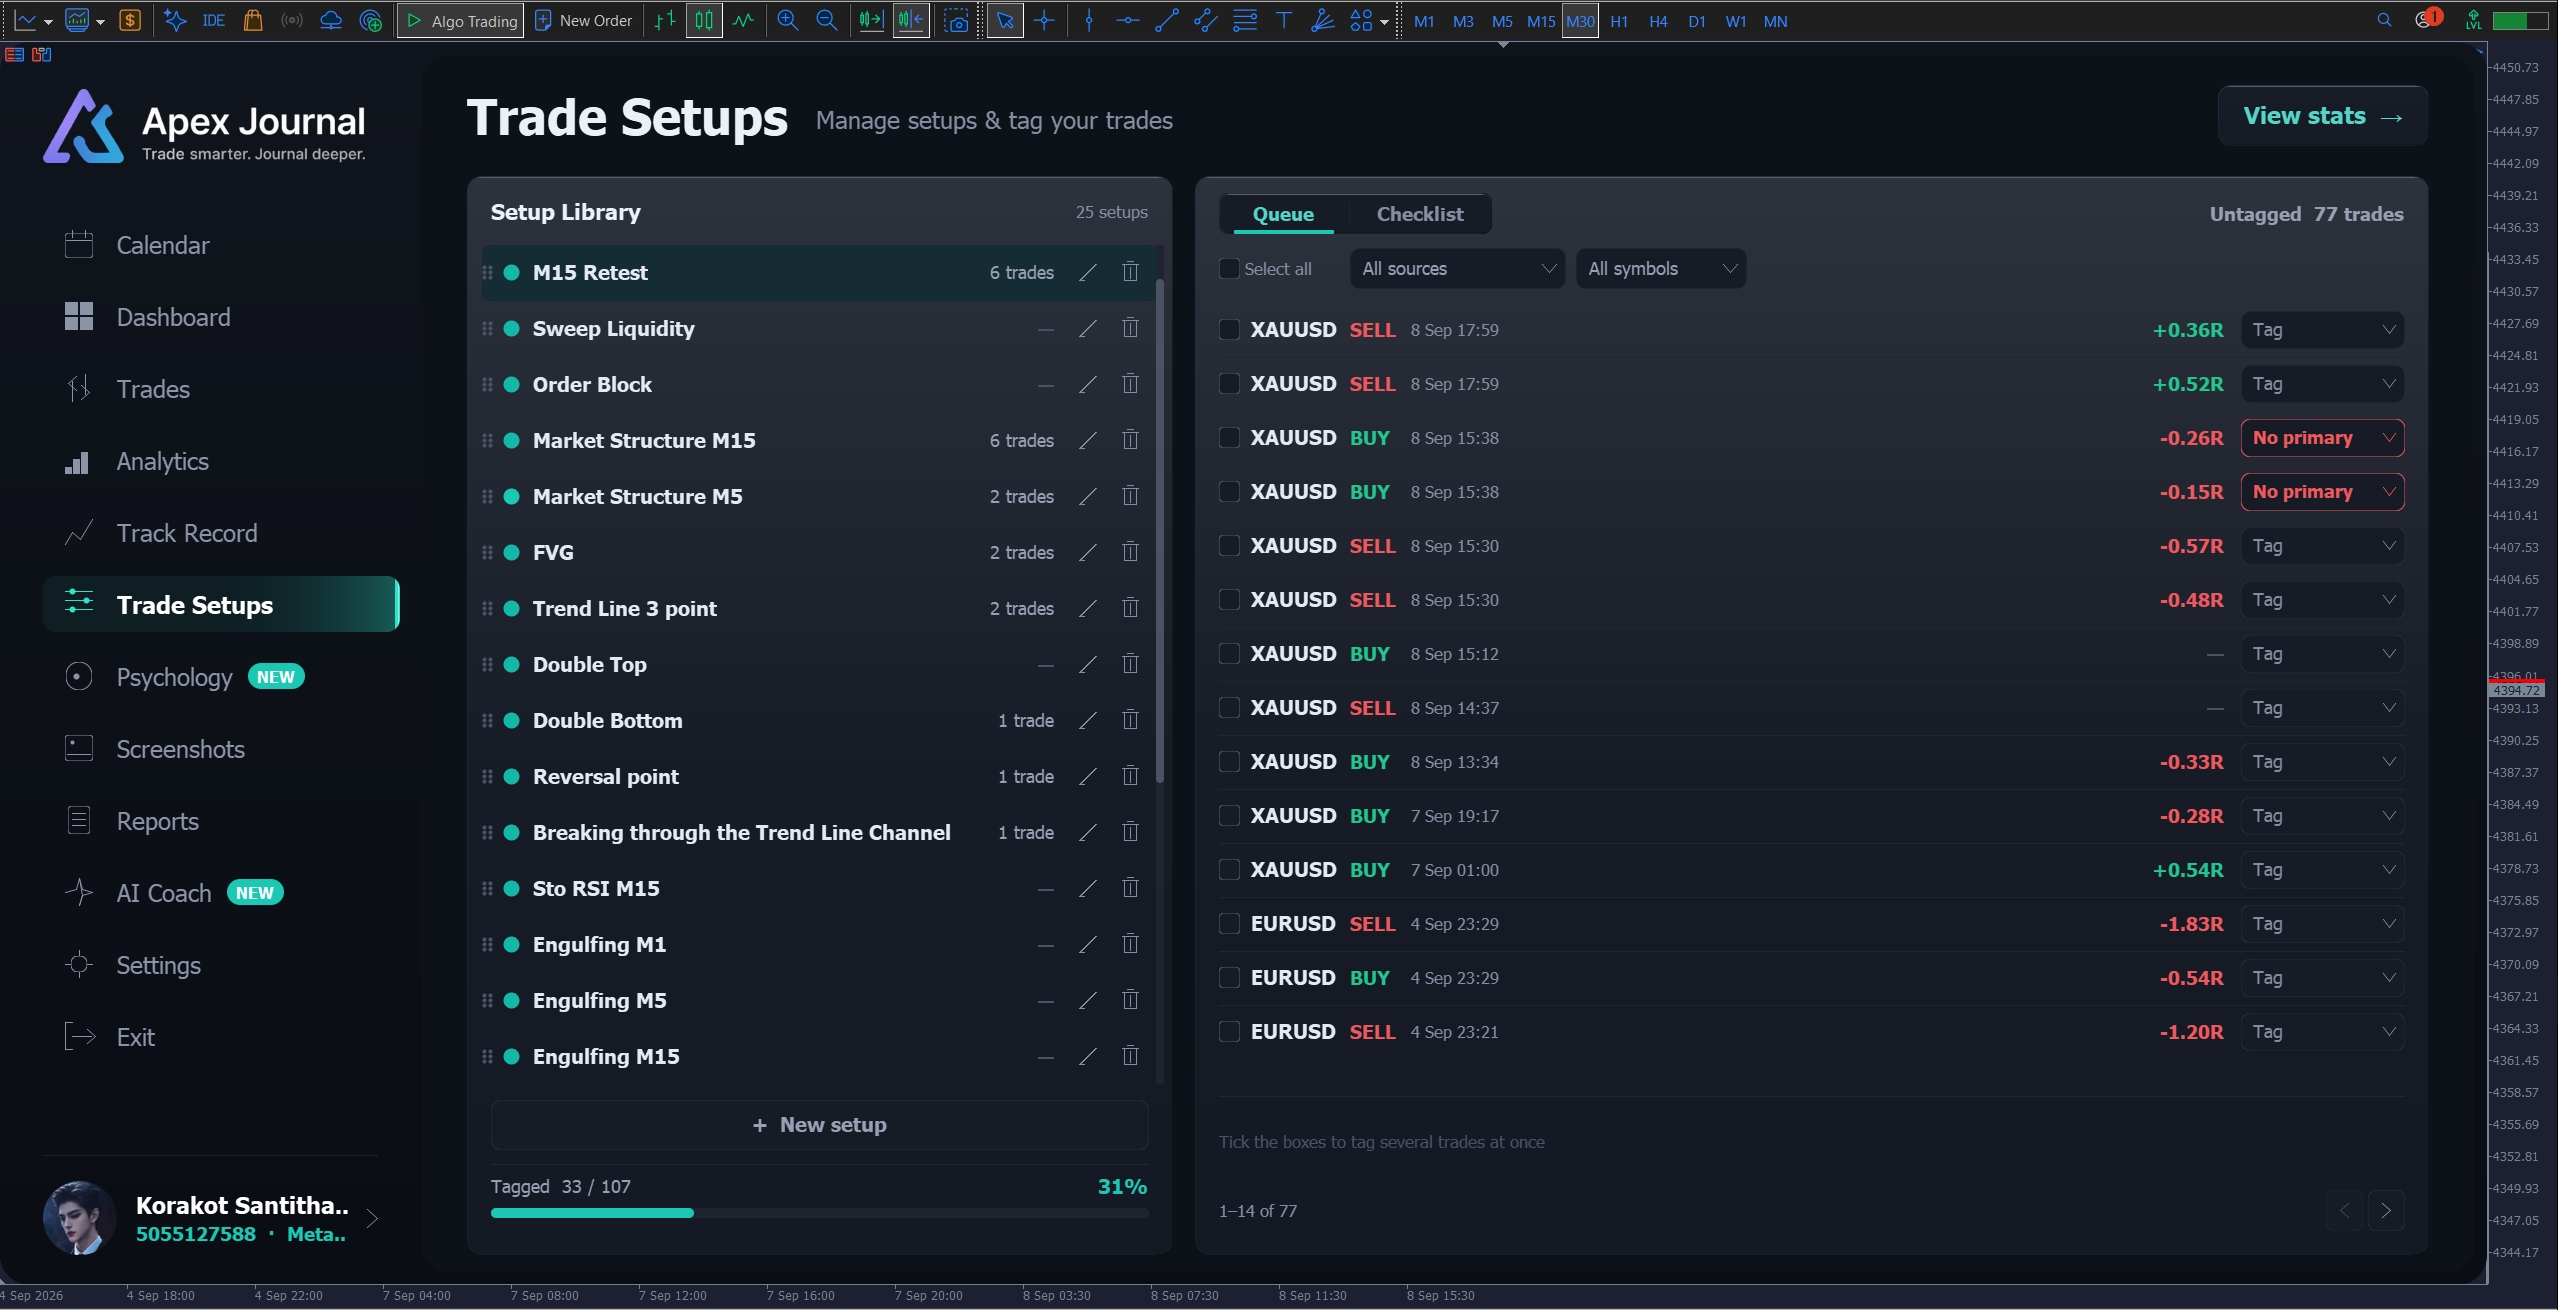
Manage setups & tag your trades.
The library of patterns you trade, and the tool that attaches them to trades you have already taken.
1. Setup Library
- 1.1 + New setup — Name it and it exists. There is no fixed list to choose from.
- 1.2 Checklist — Add the rules that have to be true before you take this setup. Mark the ones the trade is off without as Required.
- 1.3 Editing an item that has already been answered — The program asks which you mean: Fix a typo, which keeps every past answer counted, or Change the meaning, which retires the old item and starts a new one so history is not rewritten. This is the difference between a statistic you can trust and one you cannot.
- 1.4 Delete — Tells you first how many trades use the setup as primary and how many checklist items go with it.
- 1.5 View stats → — Jumps to the Analytics page for that setup.
2. Queue
- 2.1 Untagged — Every closed trade with no setup yet, oldest first, with a running Tagged n / m counter.
- 2.2 Tick several rows — Then pick a setup and press Save: all of them are tagged in one go. A confirmation lists exactly what will be written, and warns you which trades already have a primary that would be overwritten.
- 2.3 Primary and Support — One primary setup per trade — that is the one statistics are grouped by — plus as many support tags as you like for confluence.
━━━━━━━━━━━━━━━━━━━━━━━━━━━━━━
7. Psychology
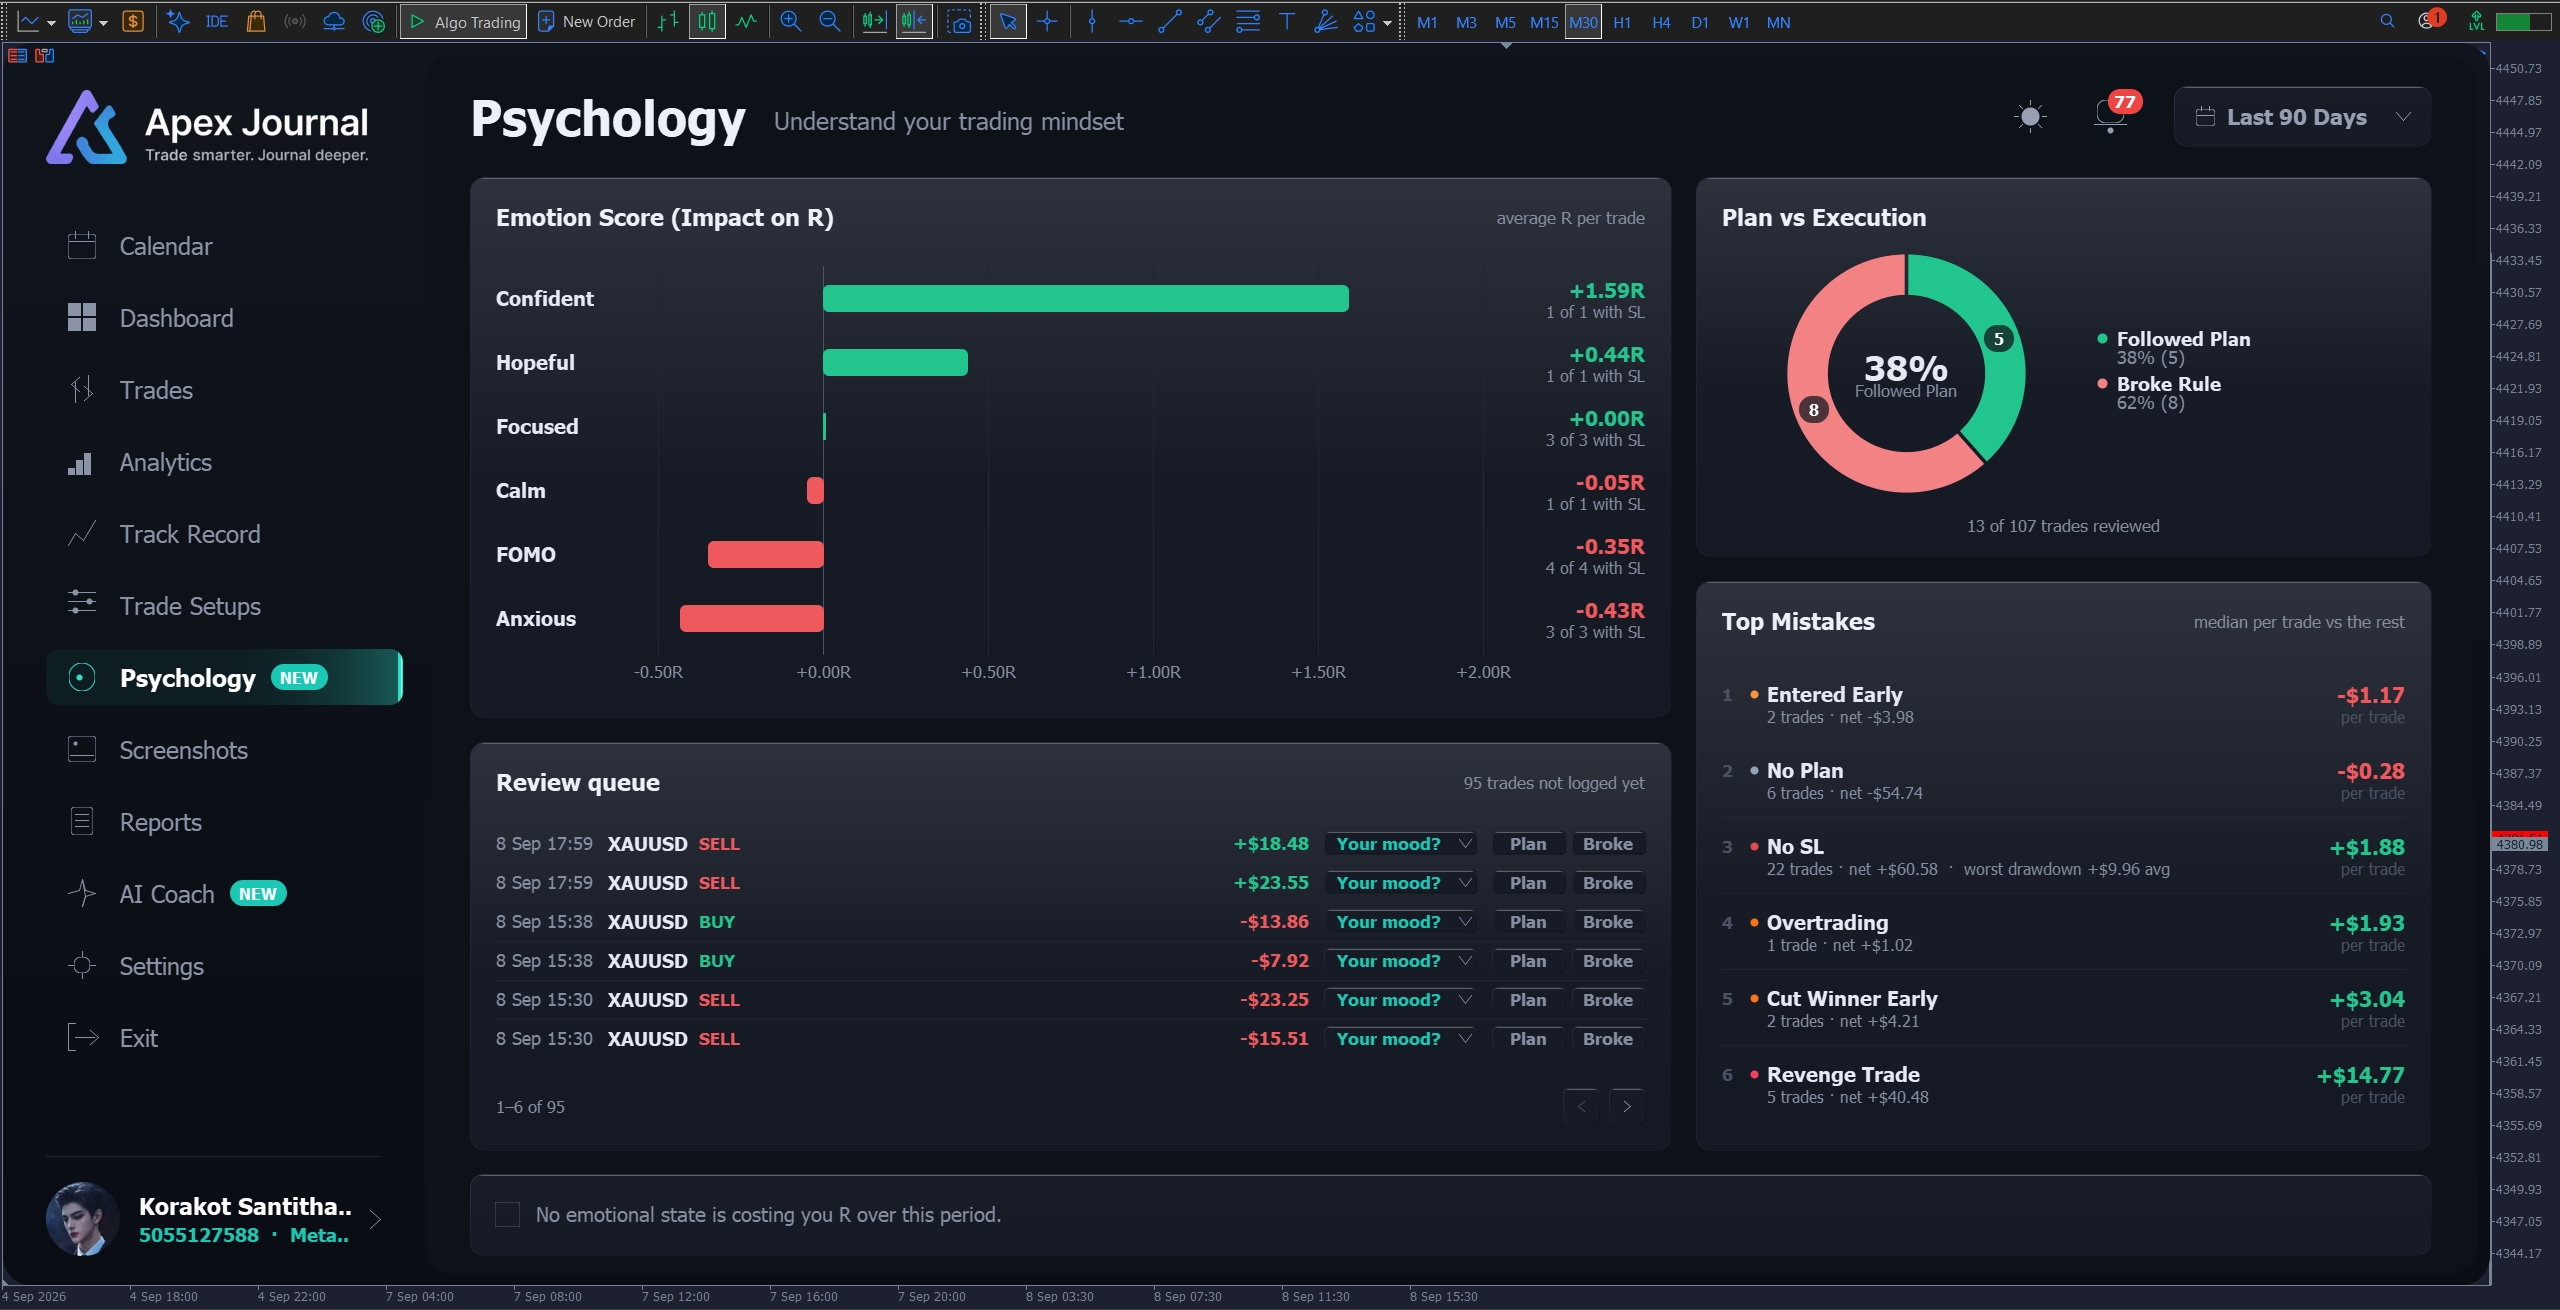
Understand your trading mindset.
What your state of mind is costing you, in money.
- 7.1 Emotion Score — Every emotion you have tagged, ranked by average result per trade. Seventeen labels are seeded to start with — Calm, Confident, Focused, Hopeful, Neutral, Anxious, FOMO, Revenge, Overconfident — and you can rename, add and delete them.
- 7.2 Top Mistakes — Flagged errors — No SL, Overtrading, Revenge Trade, Oversized Risk, Moved SL, Entered Early, No Plan, Cut Winner Early — each with the median result of the trades carrying it against the rest, and the average worst drawdown those trades went through. If a flag fires on nearly every trade the card says so: that is your normal style, not a mistake.
- 7.3 Plan vs Execution — How many trades you marked Followed Plan against Broke Rule, with how much of the period you have actually reviewed.
- 7.4 Review queue — Trades not yet logged, with a one-tap emotion picker and Plan/Broke chips so you can clear the backlog quickly.
- 7.5 Insight line — One sentence, in money or R, naming the state that is costing you. It stays silent until enough trades are tagged, and tells you how many more it needs.
━━━━━━━━━━━━━━━━━━━━━━━━━━━━━━
8. Screenshots
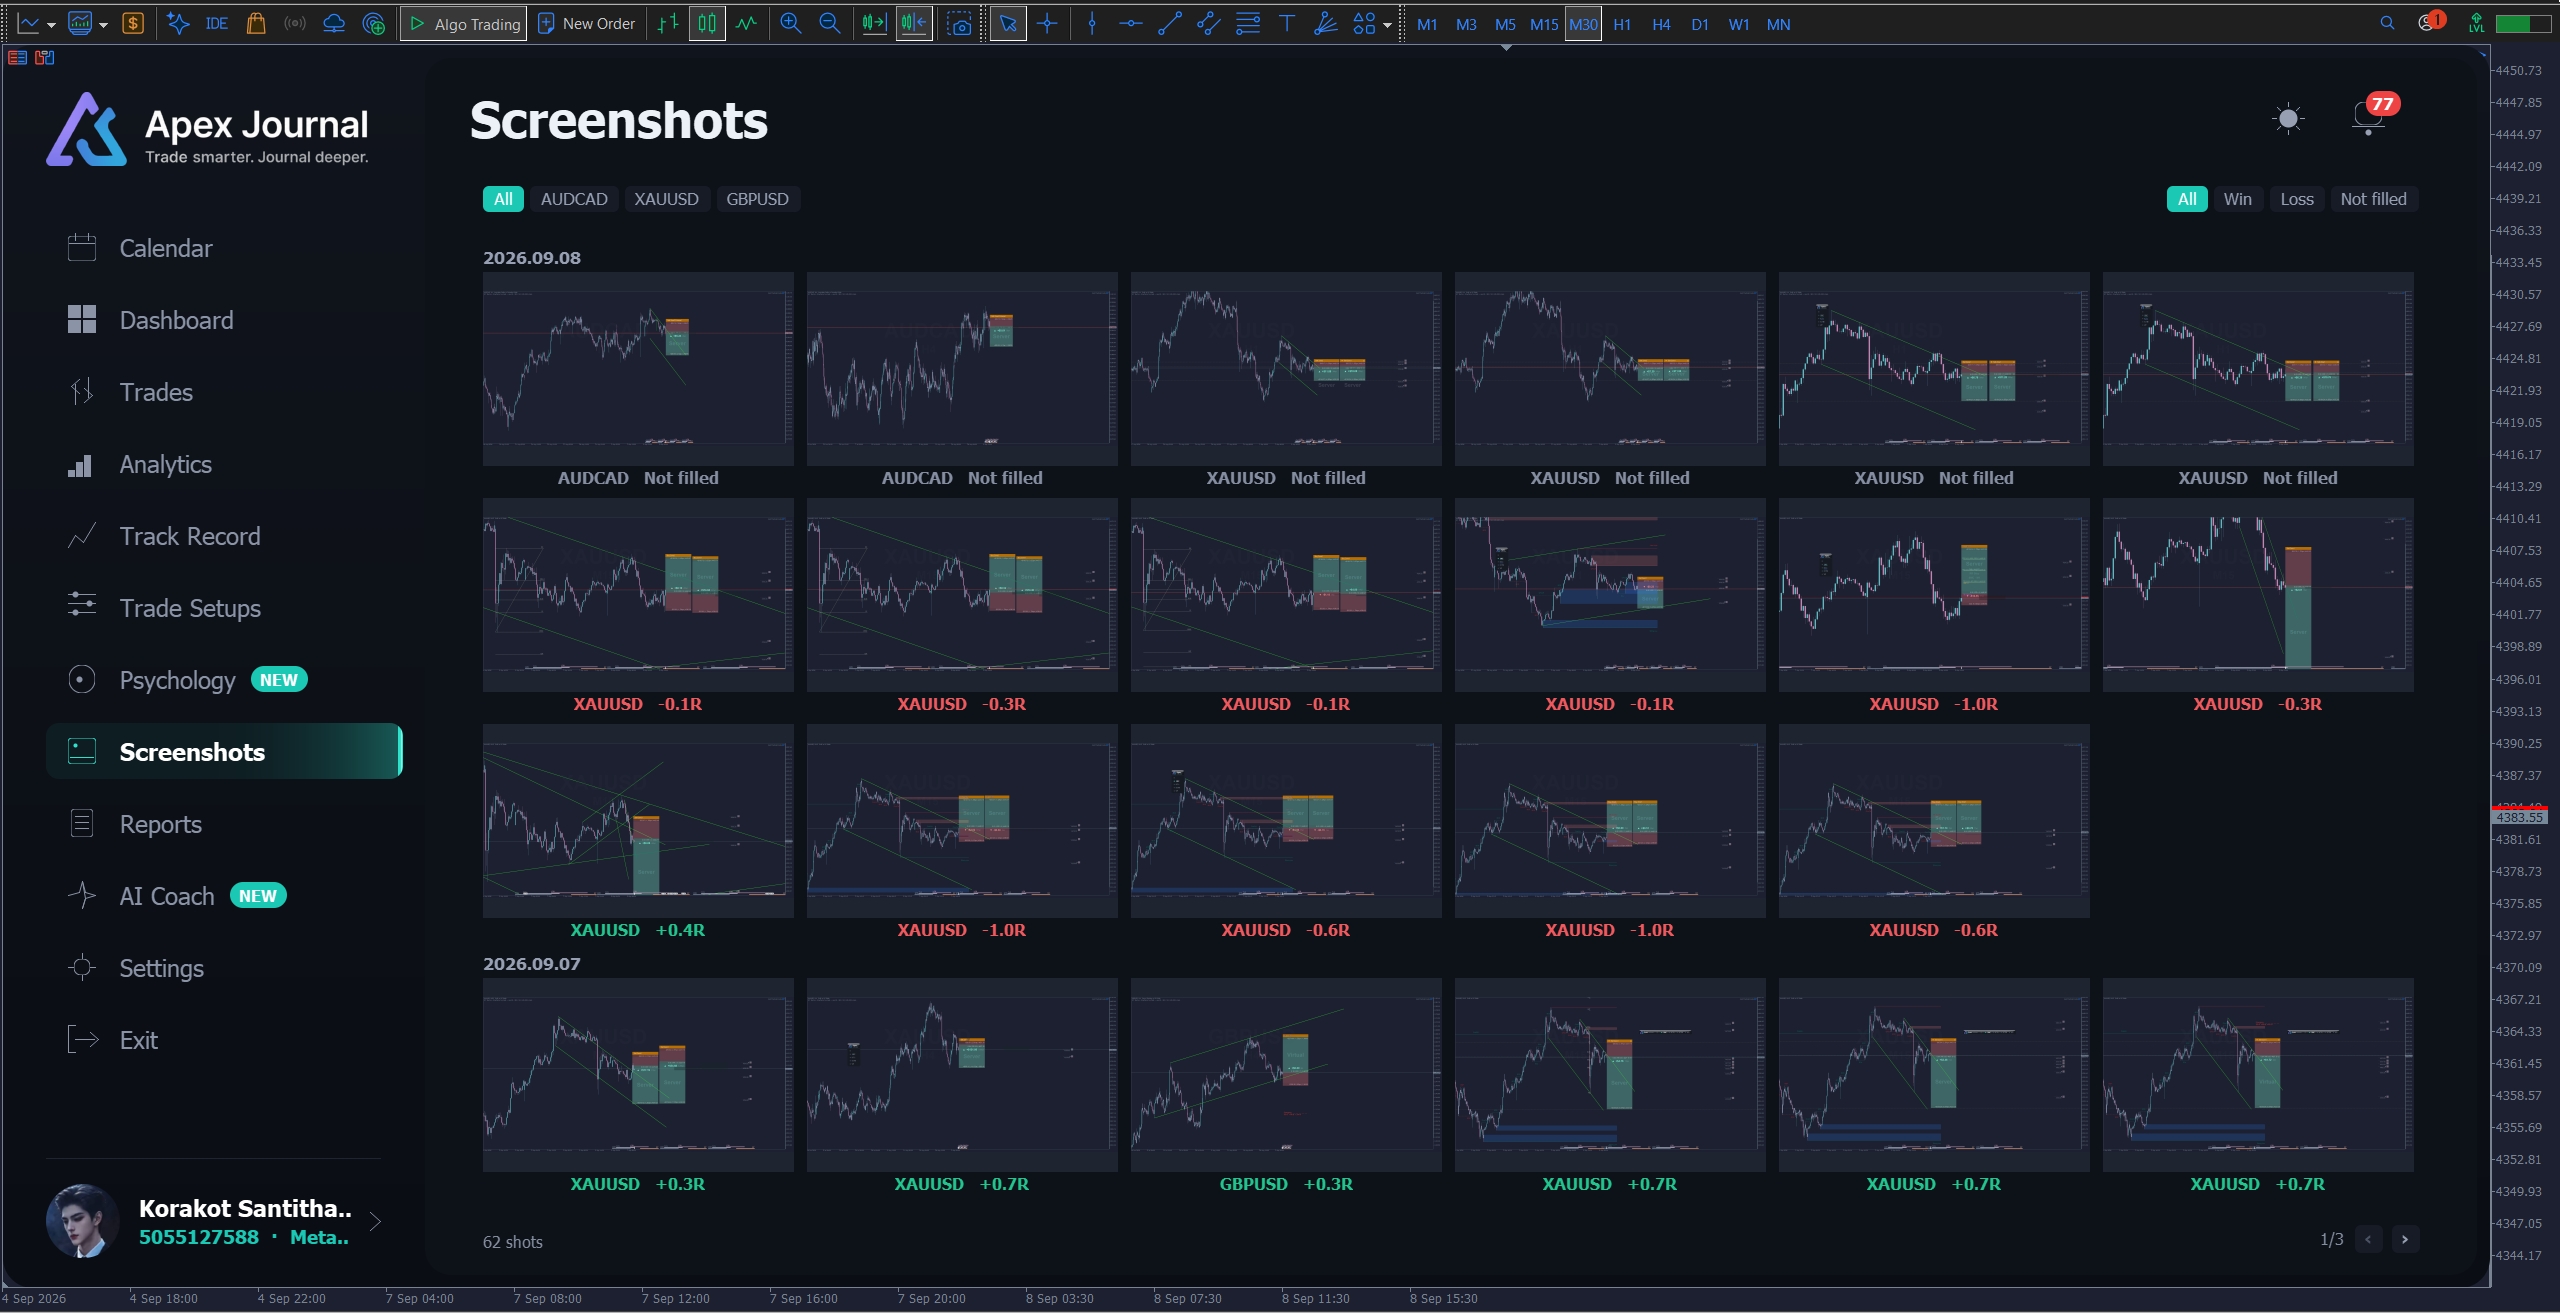
Every chart image attached to a trade, newest first, grouped by day.
- 8.1 Filters — By symbol, and by All, Win, Loss, Not filled, Open trade.
- 8.2 Click a thumbnail — Opens the viewer, not the trade. Most of the time you only want to see this one bigger and keep scrolling; ‹ › move between images and Open this trade → is one click away when you do want the detail page.
- 8.3 Where the images come from — The camera button on the Trade Card, which requires ApeX Trading Console. Journal on its own can display and organise images but does not take them at entry.
- 8.4 Storage — Images live in MQL5\Files\ApeXJournal\ , separate from MetaTrader's own Files\Screenshots\ folder, so the program's housekeeping can never delete a picture you took yourself.
━━━━━━━━━━━━━━━━━━━━━━━━━━━━━━
9. Reports
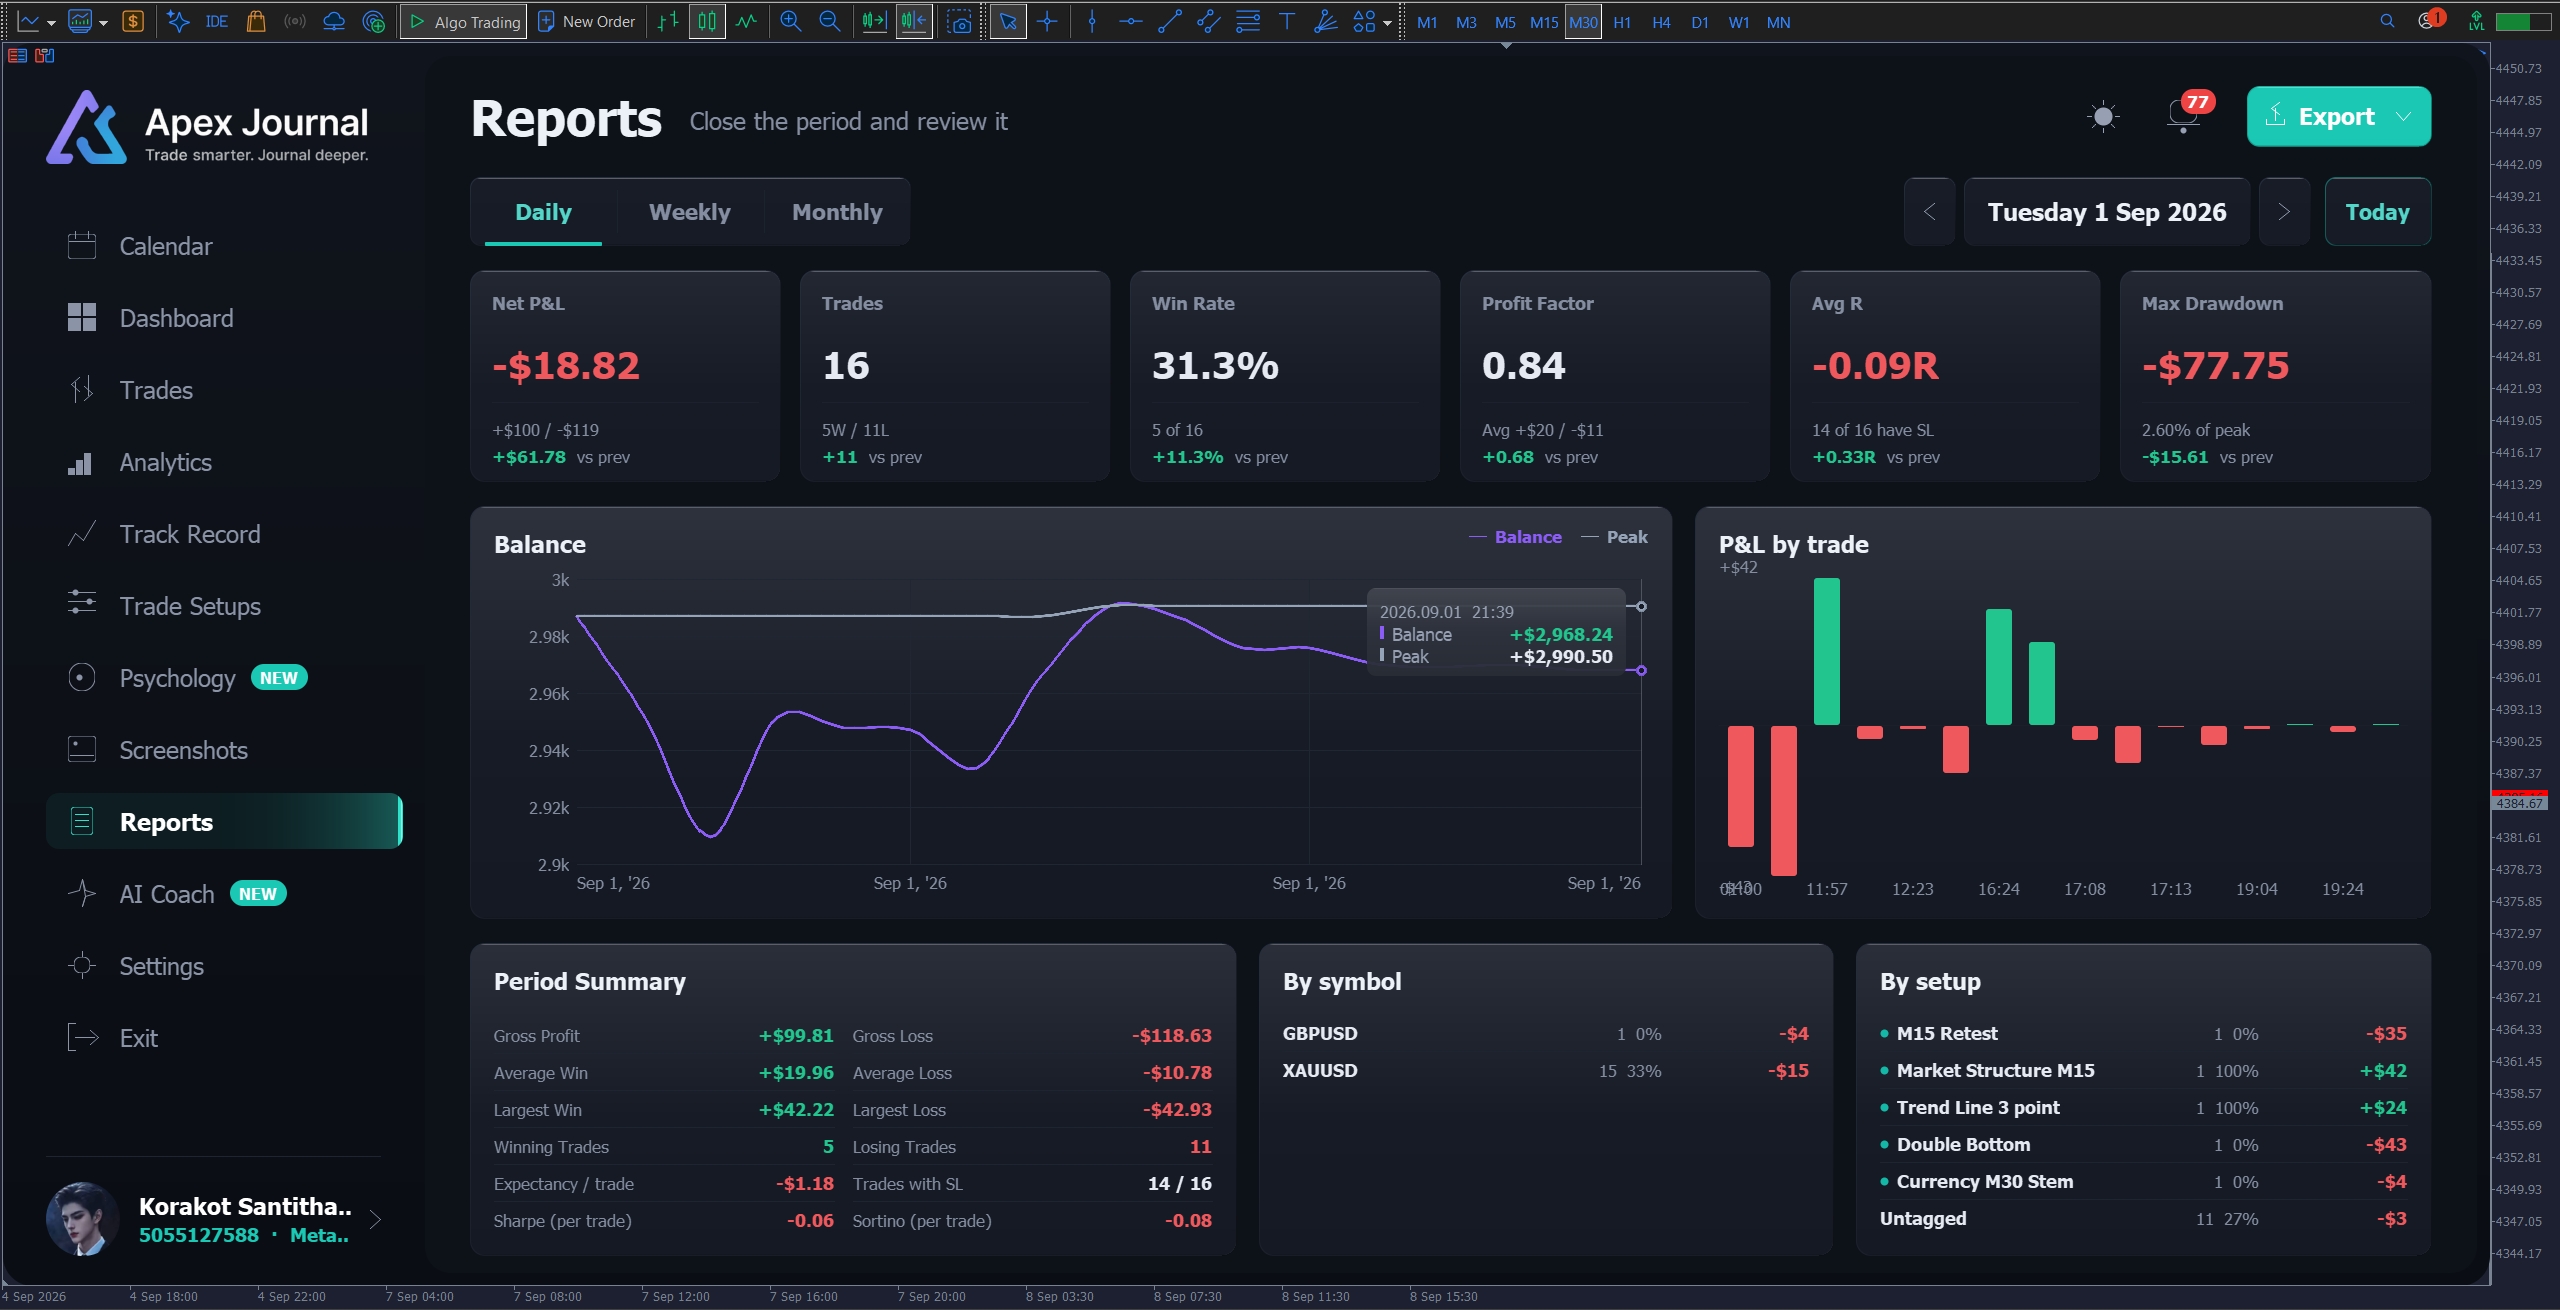
Close the period and review it.
Fixed calendar periods — the finished month, not the rolling window.
- 9.1 Daily / Weekly / Monthly — With Today, This week, This month to jump back, and arrows to step through the periods.
- 9.2 KPI tiles — Net, trades, win rate, average R, profit factor and max drawdown, each compared with the previous period — last month against this month, not a rolling window of the same length.
- 9.3 Balance and P&L — The balance line for the period beside the result by day or by trade.
- 9.4 Period Summary — Winning and losing trades, trades with a stop loss, Sharpe and Sortino per trade.
- 9.5 By symbol / By setup — Where the period's result came from.
- 9.6 Export — CSV (Excel) or HTML (report). Exported files are always in English so they can be sent to anyone. The window shows the exact path afterwards; open it with File → Open Data Folder in MetaTrader.
━━━━━━━━━━━━━━━━━━━━━━━━━━━━━━
10. AI Coach
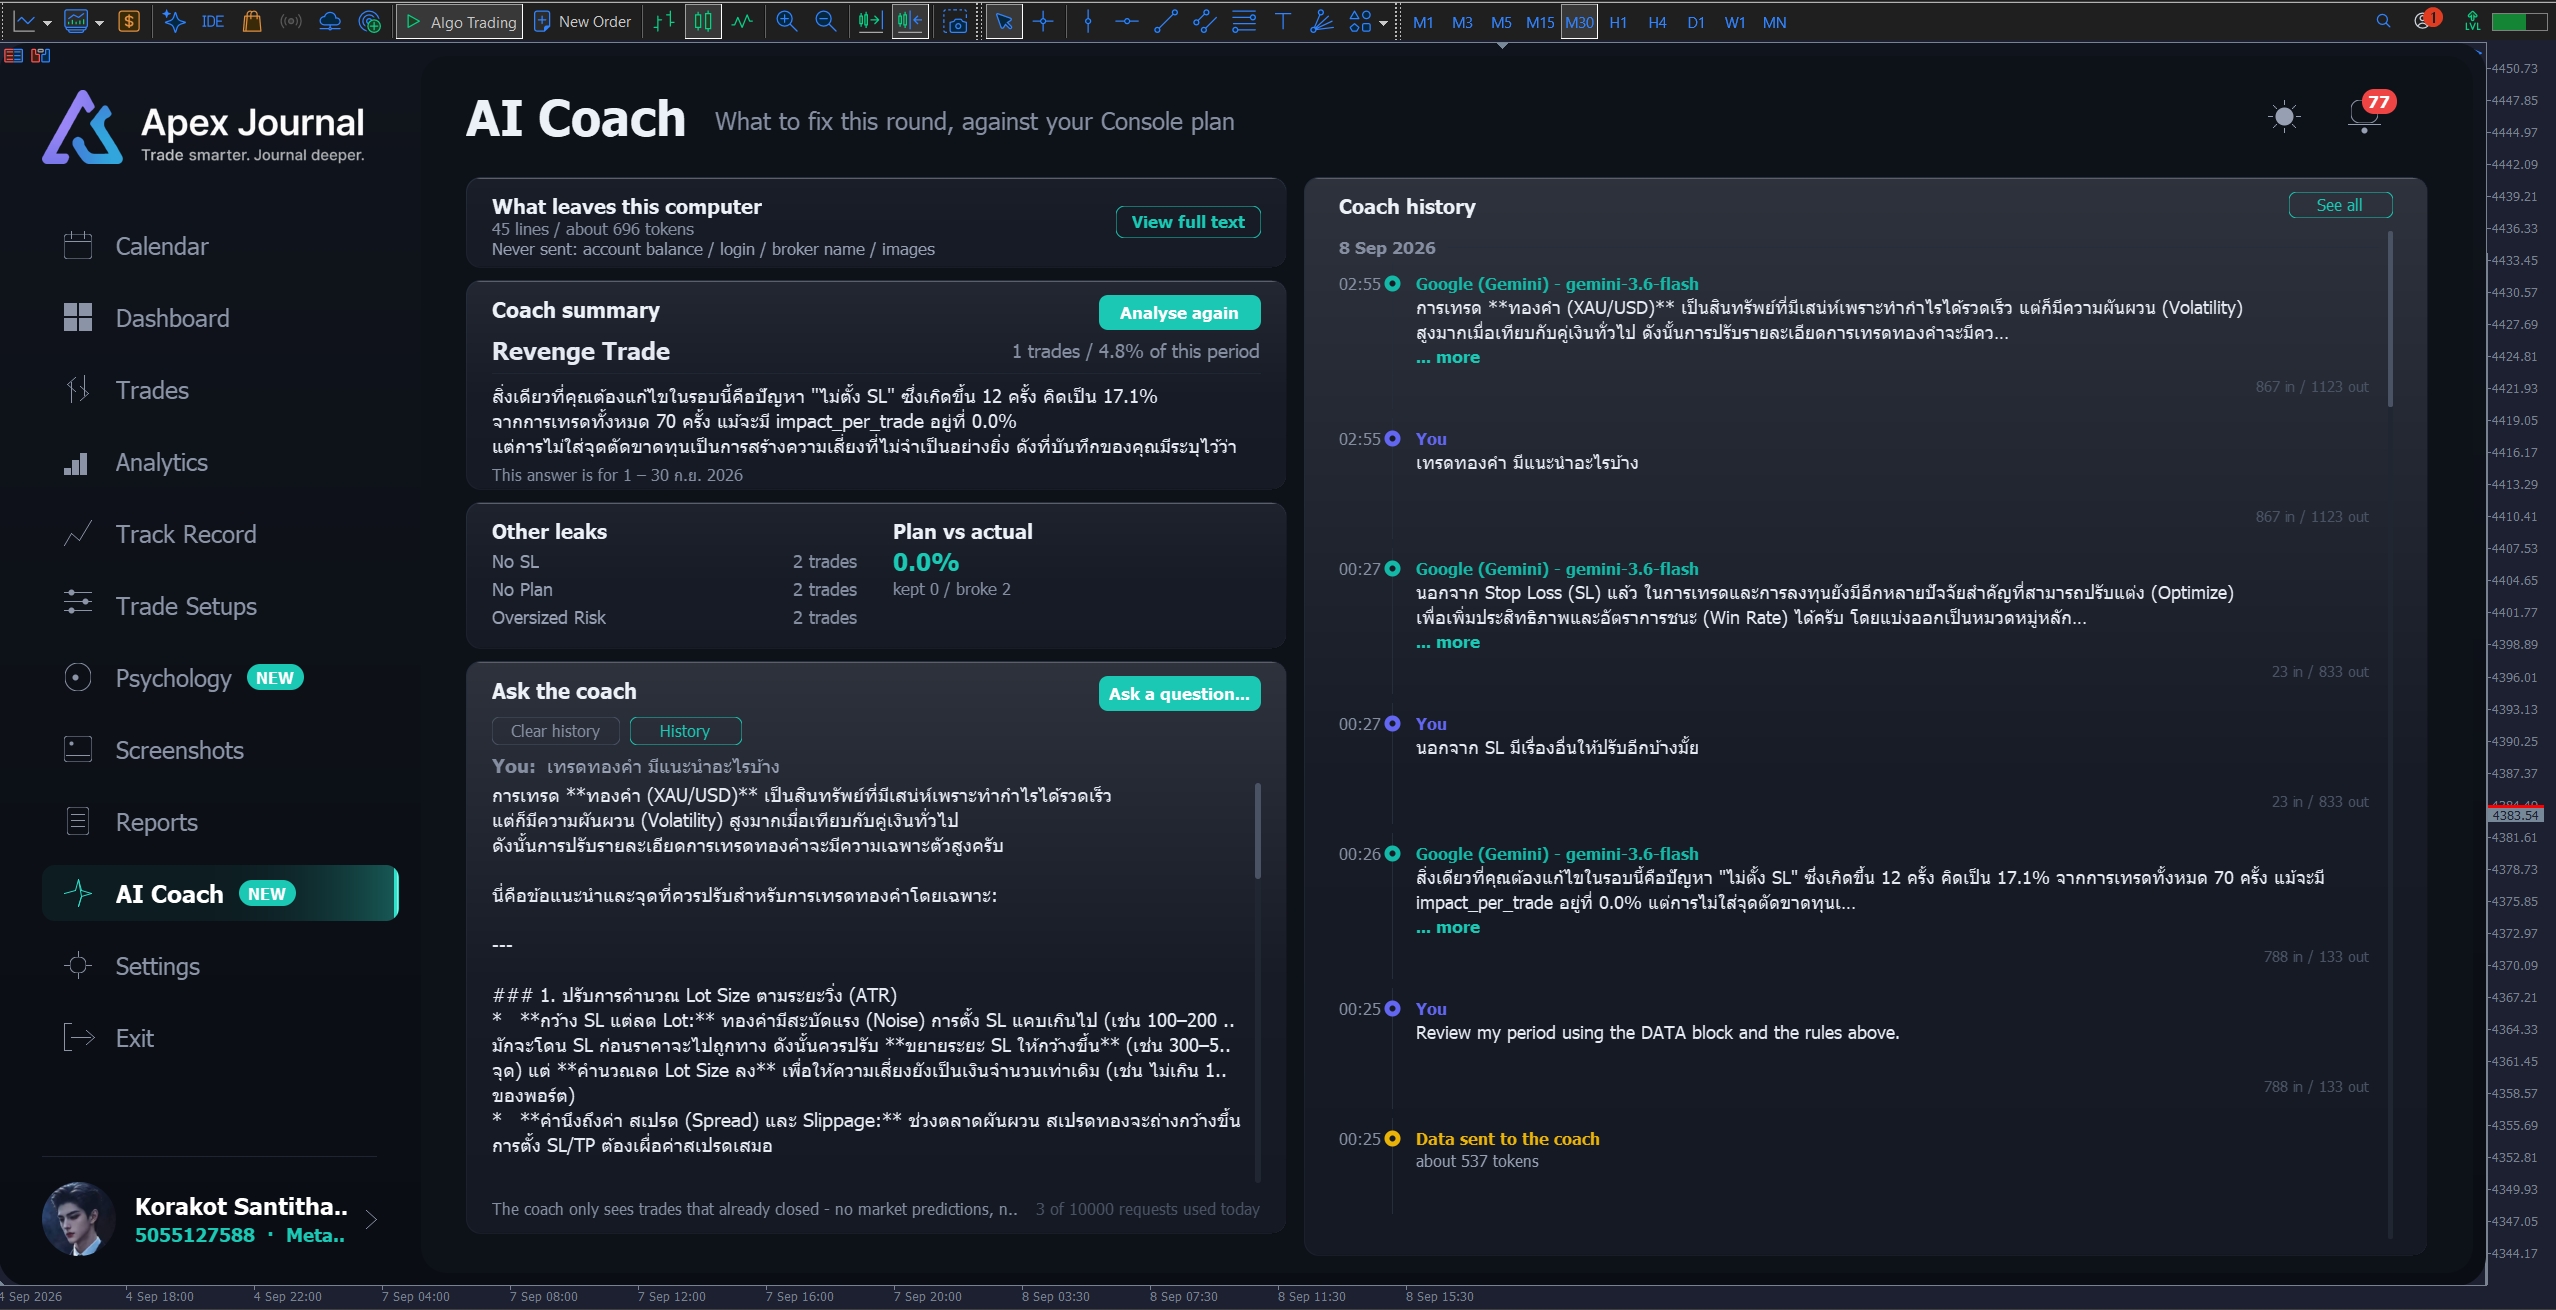
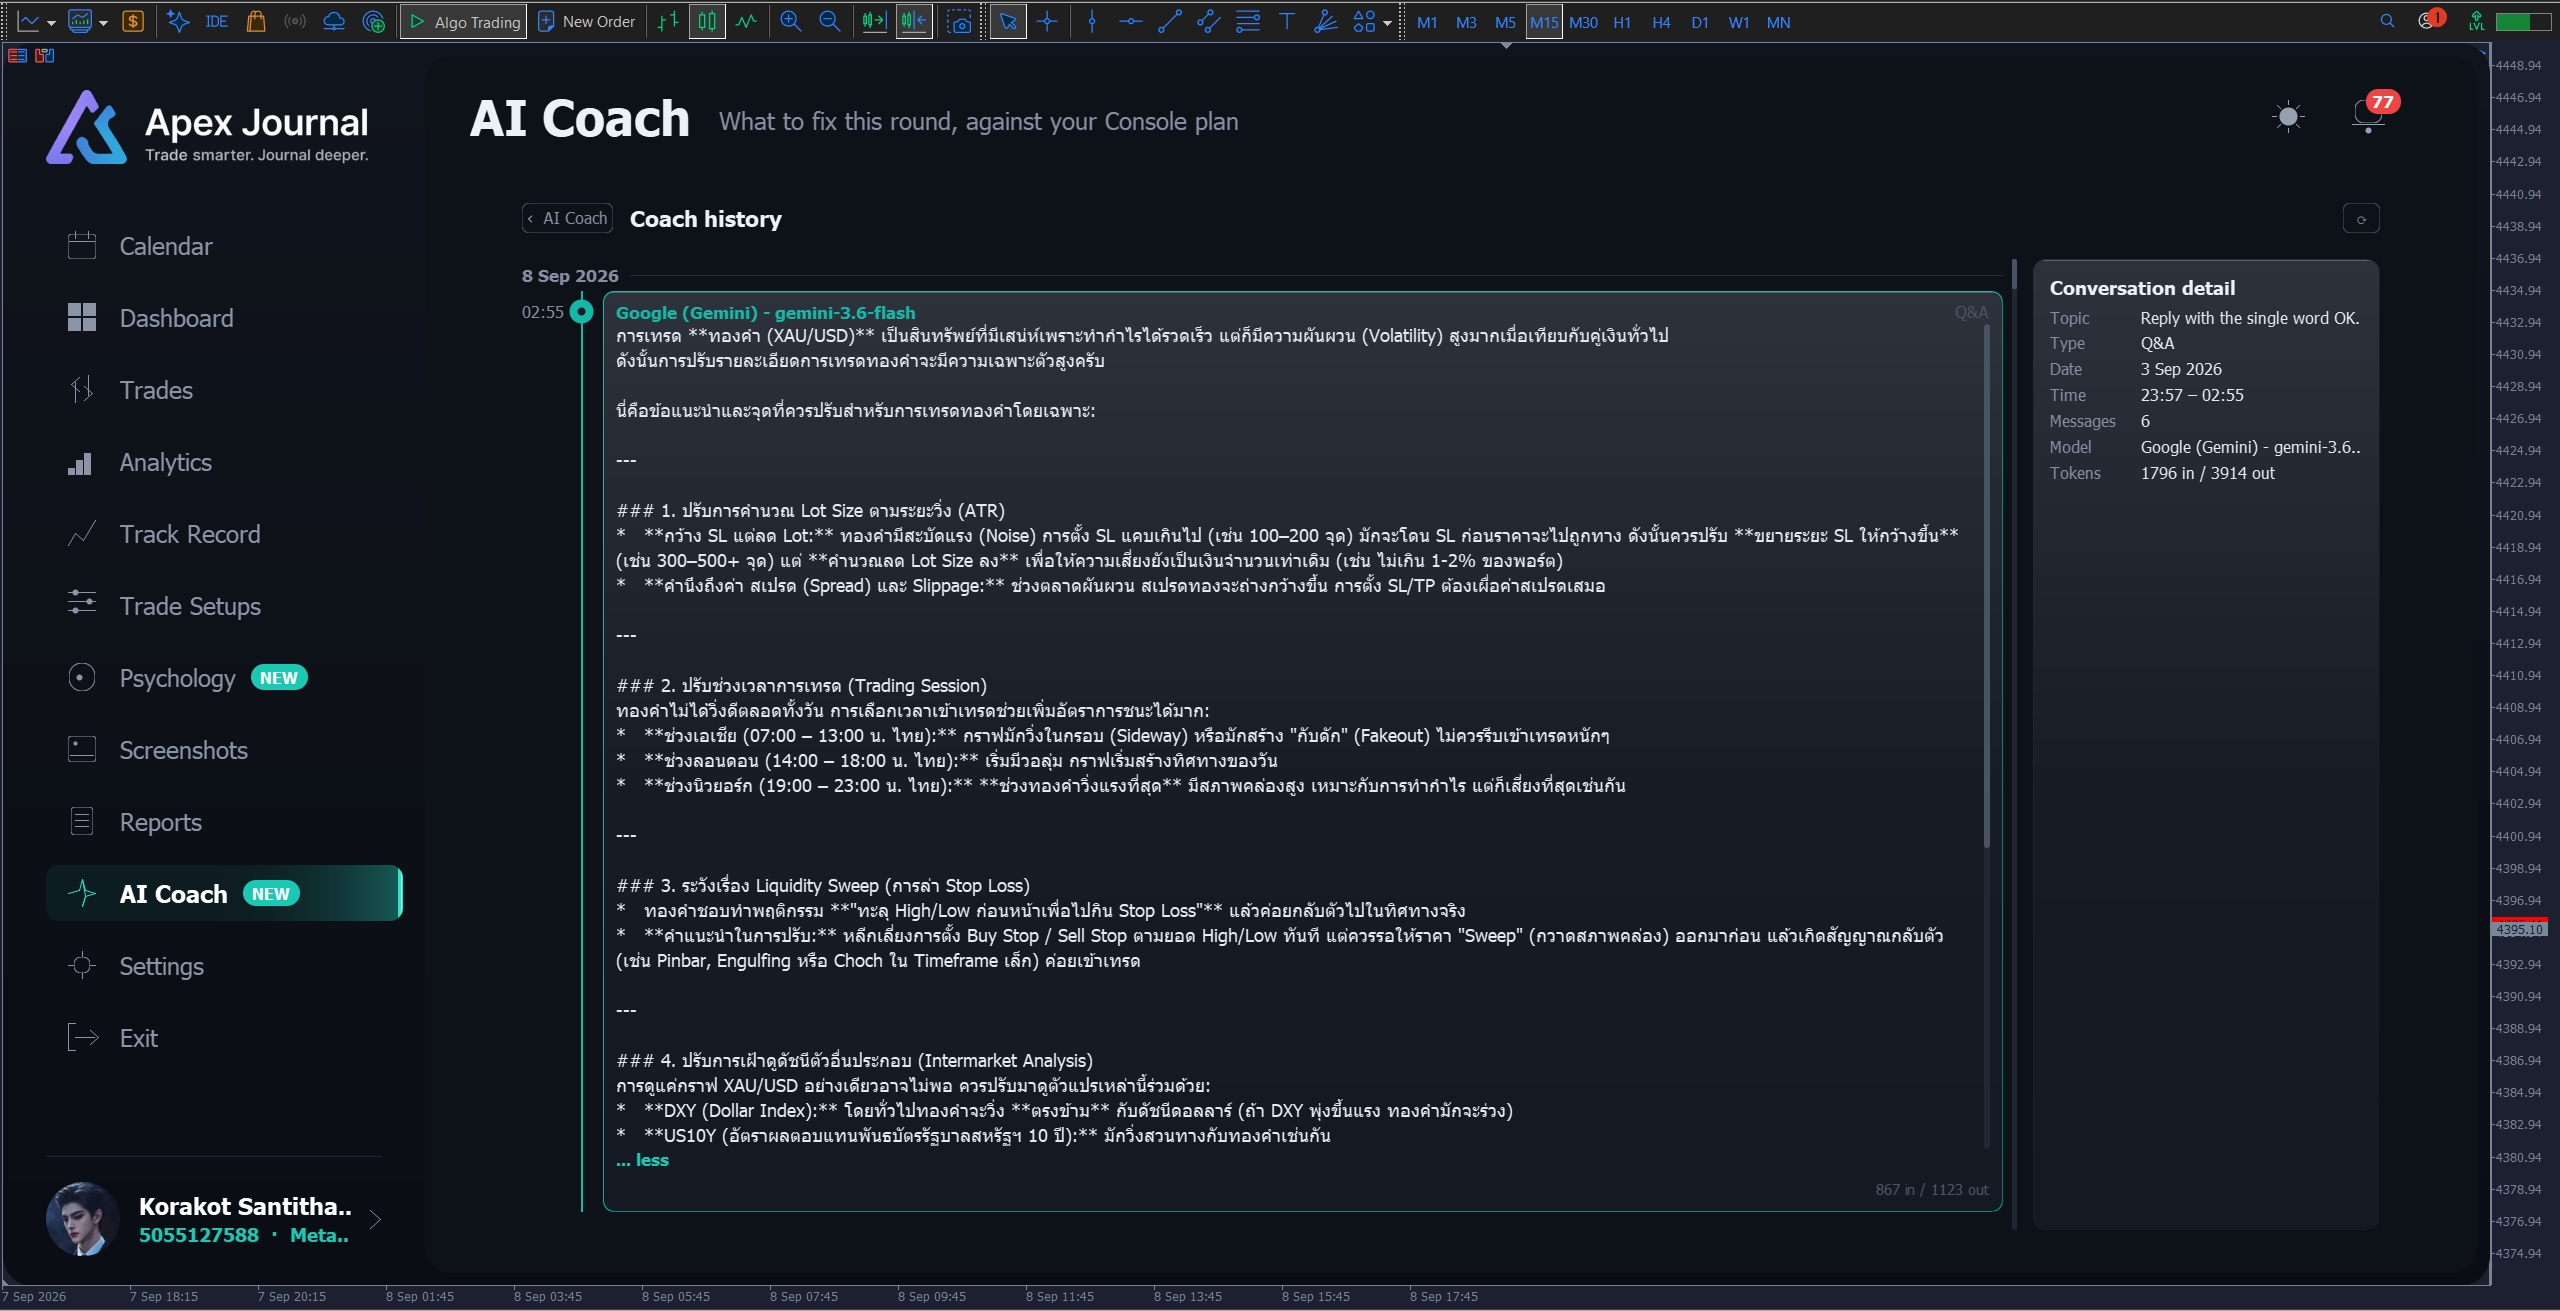
What to fix next, and ask the coach.
Optional, off by default, and it runs on your own AI account.
1. Setting it up — four steps
- Add your provider's API key on the Settings page. Supported: Anthropic (Claude), OpenAI (ChatGPT), Google (Gemini), xAI (Grok), DeepSeek, and Ollama running locally on your own PC — which needs no key at all.
- Allow the provider's address in Tools → Options → Expert Advisors → Allow WebRequest for listed URL. The page shows you the exact address to paste.
- Start ApeXAiBridge from Navigator → Services. MetaTrader does not allow an indicator to reach the internet directly, so a small bridge service does it.
- Turn the AI switch on. Test connection confirms it works.
The model list is fetched from your provider, so it is always current — or type a model name yourself. Models that have been proven to work are marked.
2. Using it
- 2.1 Analyse — Reads the period you have selected and writes back what to fix, with the leaks ranked by how much they cost and how many trades they hit. A leak that fires on almost every trade is labelled as your style rather than a mistake.
- 2.2 Plan vs actual — When ApeX Trading Console is present, the coach also sees the plan you set before entry and can say where you departed from it.
- 2.3 Ask the coach — Free questions about your own trading this period. It only sees trades that have already closed: no market predictions and no entry calls.
- 2.4 Coach history — Every question, every answer and every block of data that was sent, kept as a timeline you can reopen, with the model used and the token count. Clear history deletes all of it for the account.
- 2.5 Daily request cap — Set on the Settings page, because it is your money. Zero means unlimited. The page shows how many you have used today.
What leaves your computer. Before anything is sent you can press View full text and read the exact block, line by line. Never sent: your account balance, your login, your broker's name, or any image. Your API key is encrypted on this PC and goes only to the provider you picked. You are billed by that provider, not by us.
━━━━━━━━━━━━━━━━━━━━━━━━━━━━━━
11. Settings
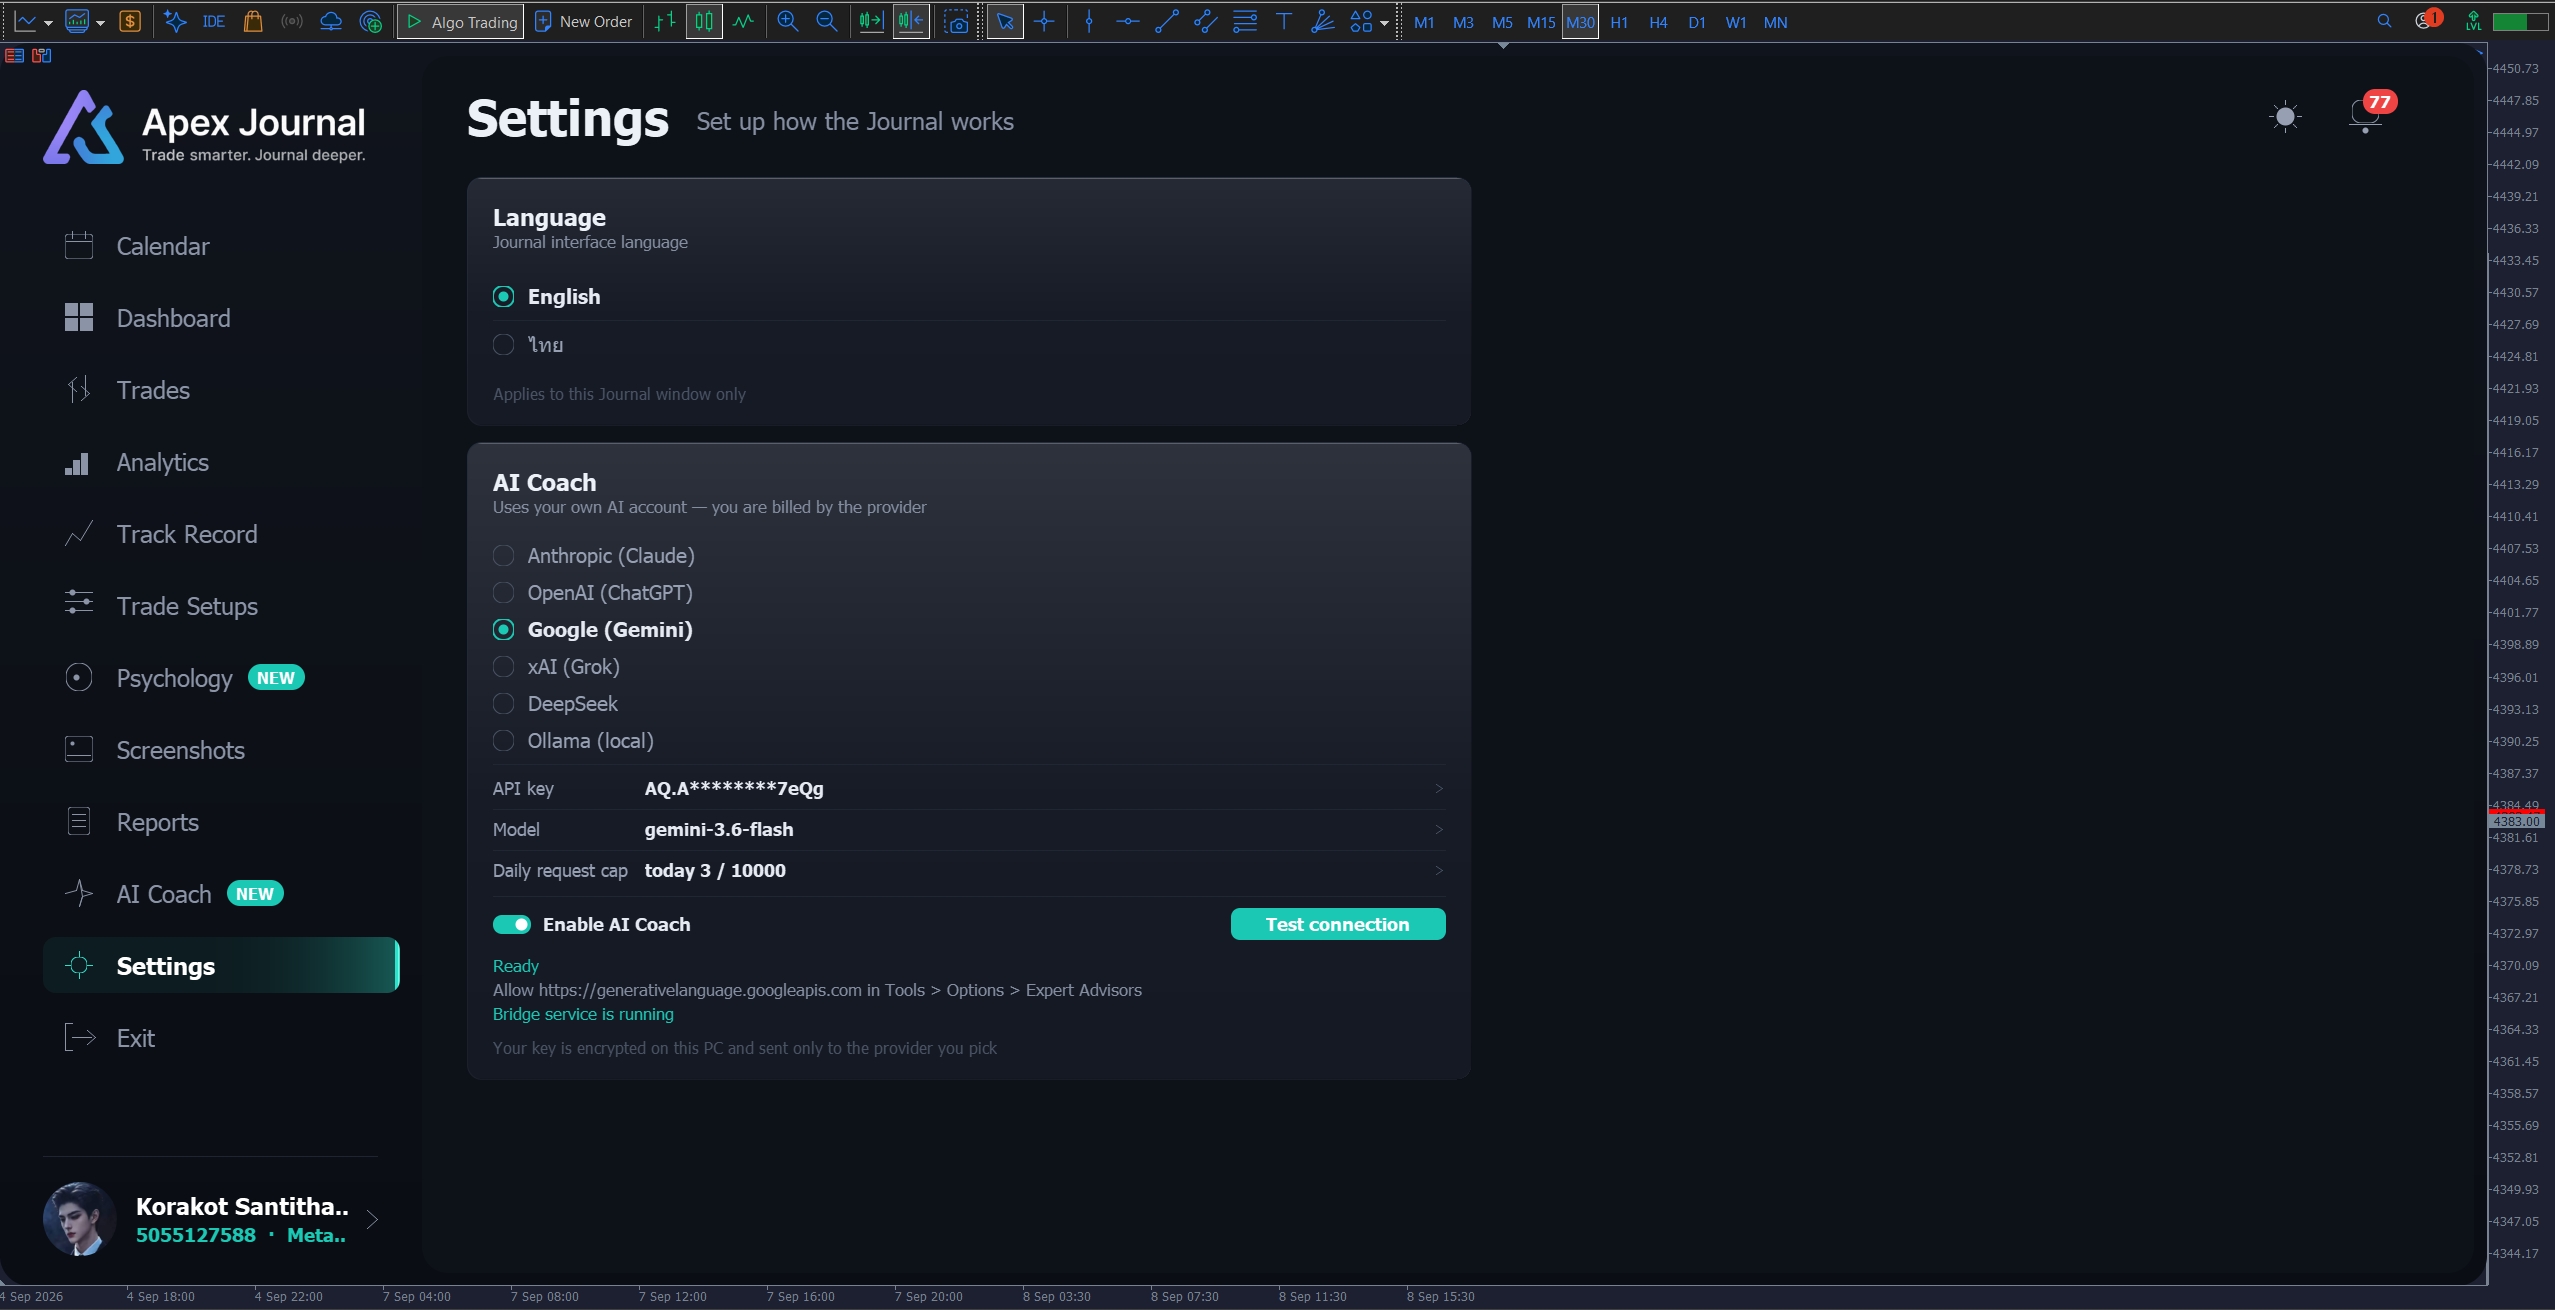
- 11.1 Language — English or Thai, applied to this Journal window only. Each language is written in its own script, so you can always find your way back.
- 11.2 AI Coach — Provider, model, API key, the on/off switch, Test connection, and the daily request cap. Keys are kept per provider, so switching back and forth does not make you paste them again.
━━━━━━━━━━━━━━━━━━━━━━━━━━━━━━
The Trade Card (with ApeX Trading Console)
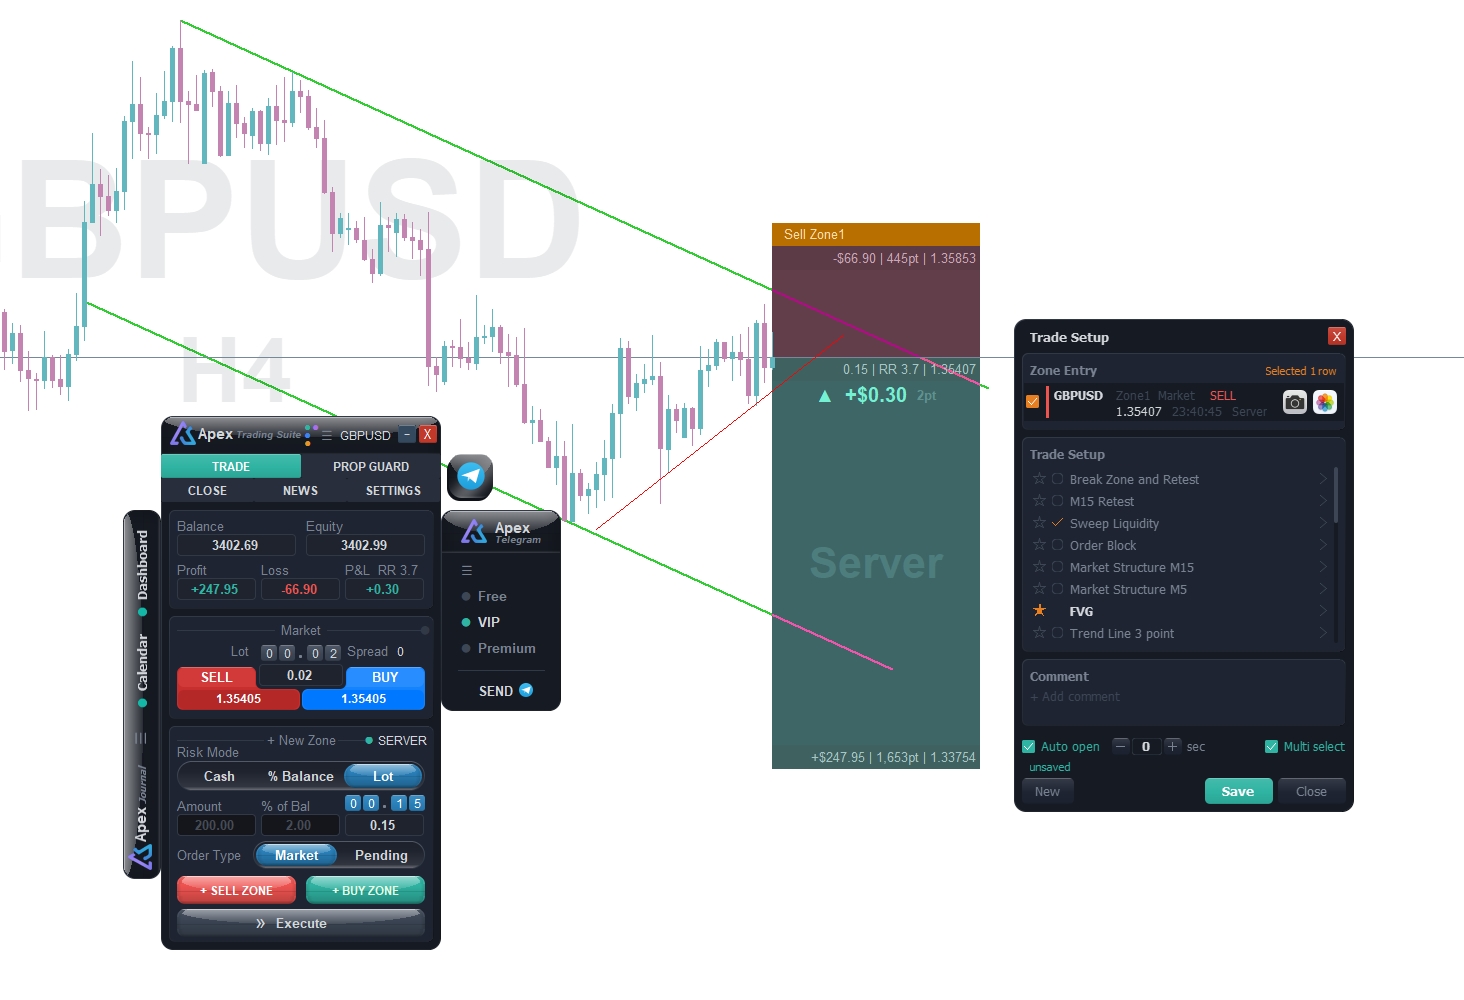
A card on the right of the chart that appears as trades happen. It needs ApeX Trading Console, because everything on it comes from the plan the Console wrote before the order existed.
- 12.1 Zone Entry list — Every plan on the account: pending orders, open positions and drafts still on the chart. Two lines each, with the venue — Server or Virtual — and the order type. The list scrolls.
- 12.2 Auto open — The card pops up by itself when a new order or a new draft appears, with a delay of 0 to 60 seconds you set on the card. On by default.
- 12.3 ★ Setup and ✓ checklist — Tick your setup and its rules before you enter, and the answers follow the plan through to the trade. Ticking afterwards is allowed too.
- 12.4 Comment — Write your reasoning at the moment you take the trade. Saved with Done.
- 12.5 Camera — Takes a chart screenshot and attaches it to that trade. The card hides itself first so it is not in the picture.
- 12.6 Multi-select — Tick several rows and one Save writes the same setup and checklist to all of them.
━━━━━━━━━━━━━━━━━━━━━━━━━━━━━━
Data, storage and privacy
- 13.1 Where it lives — One database at MQL5\Files\ApeXJournal\ , holding every account you have used. Deleting that folder removes the program's data completely.
- 13.2 Nothing is uploaded — There is no cloud, no sync, no account to create. The only thing that ever leaves your computer is the AI Coach block, if you switch it on, and you can read it before it goes.
- 13.3 Deposits and withdrawals are counted — Without them a balance curve and every drawdown percentage would be wrong. They are marked on the chart and named where they distort a drawdown episode.
- 13.4 It keeps itself up to date — New closed trades are picked up automatically. There is no import button to remember.
- 13.5 Several terminals at once — More than one program may write to the database; when it is busy the Journal waits and retries. Nothing is lost.
━━━━━━━━━━━━━━━━━━━━━━━━━━━━━━
Good to know
- MetaTrader 5, any broker, any symbol — forex, metals, indices, crypto.
- Trades taken without a stop loss have no R. Every R figure in the program is calculated only from trades that had one, and the pages say so rather than counting a missing stop as zero. Use + Set on the Trade Detail page to supply the stop you actually had in mind; it is always labelled typed.
- MetaTrader keeps no history of stop loss and take profit changes. For trades ApeX was not watching, "BE moved" and "trailing" cannot be reconstructed by any program, and the field shows an em dash with the reason rather than a guess.
- Stops held inside ApeX Trading Console (Virtual) are invisible to the broker's records, so a trade run that way shows no planned SL or TP unless the Console recorded the plan.
- Order comments can be rewritten by the broker after a partial close — this is a broker behaviour, not a fault of the journal.
- The built-in MQL5 demo runs in the Strategy Tester, where an interactive panel cannot behave as it does on a live chart. Buttons and dragging may not respond. Run it on an ordinary chart to see it properly.
- The AI Coach is optional and needs your own provider account. Everything else works with no internet connection at all.
|