

📊 Murrey Math & Multi-Confirmation Engine: A Trader’s Guide
Get Murrey Math Classic -https://www.mql5.com/en/market/product/179139
A common concern among traders when analyzing this indicator on past history (visual backtest) is that the levels appear to shift endlessly, creating a "moving goal post" effect. However, there is a massive operational difference between looking at historical charts and trading in real-time (live market conditions).
In live trading, you are never blindly guessing. To protect your capital, you have an advanced suite of tools and confirmation filters built directly into this engine.
When combined with our confirmation logic, the dynamic nature of Murrey Math actually transforms from a perceived lagging issue into a mathematical edge. Here is exactly how to utilize it correctly:
1. The Strategy: The Ultimate Multi-Confirmation Entry
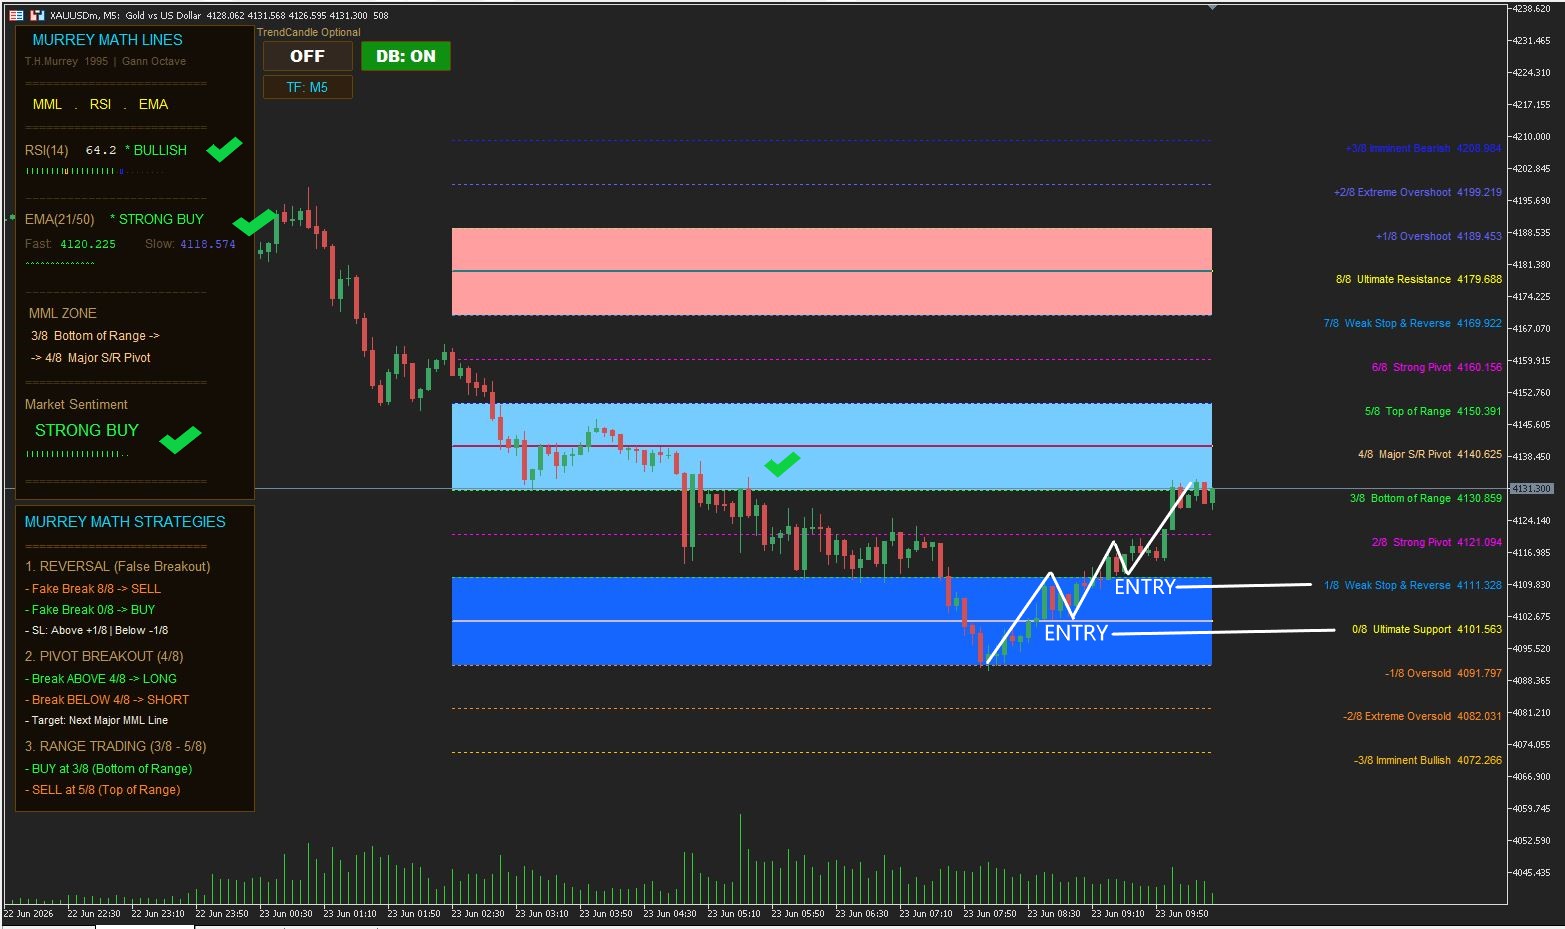
The absolute safest and most high-probability way to execute trades with this system is straightforward: Wait for the Dashboard to print a "STRONG BUY" or "STRONG SELL" status, and only then look for an entry at the corresponding Murrey Levels.
-
For BUY: The Dashboard must score at least $+3$ (TrendCandle MTF confirms Bullish, HTF 50-EMA provides structural support, RSI shows clear momentum, and the 21/50 EMA fast cross is active). Once the dashboard locks this STRONG BUY state, you look to execute your trade precisely as the price hits or rejects the Ultimate Support zones ($0/8$, $-1/8$, or $-2/8$).
-
For SELL: The Dashboard must score at least $-3$. Once the STRONG SELL state is active, you only execute short positions near the Ultimate Resistance zones ($8/8$, $+1/8$, or $+2/8$).
2. Real-Time Weapons vs. Historical Shifting
When you scroll back on past data, you only see the final adjusted grid. But in live trading, you have active algorithmic weapons that prevent you from catching a falling knife:
-
The TrendCandle MTF Guard: If the price is crashing hard and printing lower lows (e.g., dropping from 4453 to 4438), the TrendCandle MTF will instantly print Weak or Sell bars. The dashboard will immediately drop to a "WAIT / DO NOT TRADE" status or a Sell bias. Even if Murrey Math shifts its grid during a heavy unidirectional drop, the system will NEVER trigger a Buy signal against that momentum.
-
The 2-Bar Confirmation Filter ( TC_MinBarsConfirm = 2 ): Sudden spikes, stop-hunts, or flash crashes will not trick the software. The higher timeframe (HTF) must print and close at least 2 consecutive bars in that direction to validate any structural trend change.
-
The Power of Dynamic Squares: Murrey Math must recalculate because market context changes. If a level moves from $0/8$ to $1/8$, it signifies that the market has expanded its volatility range. Our engine instantly adapts to this new range and recalculates the exact mathematical edge in real-time.
💡 Live Market Execution Example:
If you monitor an asset in real-time, you will see exactly how the dashboard acts as an institutional shield. While the price moves and tests different levels, the dashboard filters out all the minor noise. You remain strictly in a "WAIT" state until the exact mathematical moment when the HTF Trend, EMA alignment, and RSI momentum all align perfectly with a Murrey reversal zone.
📌 Summary
Do not worry about historical shifting on past charts. In live trading, your rule is simple: wait for the dashboard to trigger STRONG BUY/SELL, and only then execute at the Murrey Zones. This powerful combination grants you the raw mathematical precision of Murrey Math, secured by the safety of a multi-timeframe filter system.
Get Murrey Math Classic -https://www.mql5.com/en/market/product/179139


")
![[XAUUSD]: Weekly Liquidity Activation Points (timings), June 22-26, 2026](https://c.mql5.com/6/1013/splash-preview-771790.png "[XAUUSD]: Weekly Liquidity Activation Points (timings), June 22-26, 2026")
")