")
Smart Market Concepts Indicator - Complete SMC Guide (Concepts + Settings)

📘Smart Market Concepts Indicator – Complete SMC Guide (Concepts + Settings)
This document explains the parameters of the Smart Market Concepts indicator as well as the underlying trading concepts used in its logic.
The indicator is available for both MetaTrader 4 and MetaTrader 5 on the MQL5 Market:
⬇️ Smart Market Concepts (MT5): https://www.mql5.com/en/market/product/178131
⬇️ Smart Market Concepts (MT4): https://www.mql5.com/en/market/product/178130
📖 Contents
1) Bars and Display · 2) Chart Colors · 3) Control Panel · 4) Candle Timer · 5) Internal Structure · 6) Swing Structure · 7) Order Blocks · 8) Equal High / Low · 9) Fair Value Gaps · 10) Highs & Lows MTF · 11) Premium / Discount · 12) Fibonacci / OTE · 13) Sessions · 14) Font Sizes · 15) Alerts
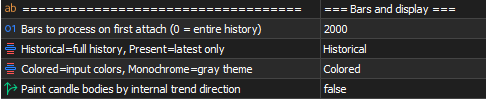
🔧 Bars and Display
This is the first section in Inputs. It covers calculation scope, how drawings are shown, visual style, and trend-based candle coloring.
Calculation Bars – Number of historical candles processed on first attach. 0 = entire available history (may reduce performance on large charts). Lower values improve speed with less historical context.
Display Mode – Controls whether all historical drawings are kept or only the latest ones.
- Historical – Full structure history on the chart (default)
- Present – Keeps only the latest structure; older objects are removed for a cleaner chart
Color Style – Visual theme without affecting logic.
- Colored – Uses your input colors (default)
- Monochrome – Gray-toned theme for all indicator visuals
Show Trend Candles – Paints candle bodies based on internal trend direction, helping align with short-term market bias.
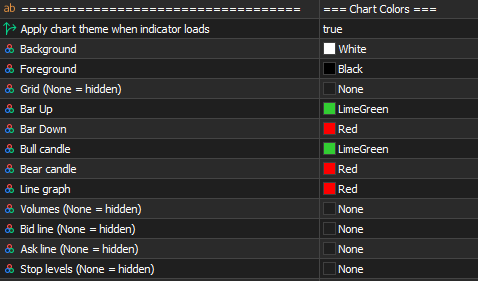
🎨 Chart Colors
Apply Chart Colors on Attach – Applies a custom chart theme when the indicator loads.
Background / Foreground / Grid / Bar & Candle colors / Line / Volumes / Bid / Ask / Stop levels – Customize chart appearance. Set any color to None to hide that element.
💡 This section only affects chart styling, not indicator logic.
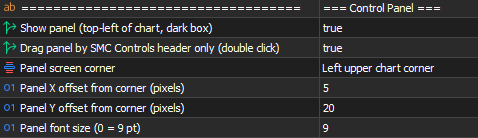
🖥 Control Panel
Show Control Panel – On-chart panel to toggle features without opening Inputs.
Panel Draggable – Drag the panel by the SMC Controls header.
Panel Corner / Panel Offset X / Panel Offset Y – Panel position on the chart.
Font Size Panel – Panel text size ( 0 = default 9 pt).
From the panel you can toggle:
- Mode – Historical or Present
- Style – Colored or Monochrome
- Trend candles, candle timer, internal/swing structure, internal confluence, swing points, strong/weak labels, internal/swing OB, EQH/EQL, FVG, auto FVG threshold, prev day/week/month H/L, premium/discount, Fibonacci/OTE, and sessions
Use − / + to minimize or expand the panel.
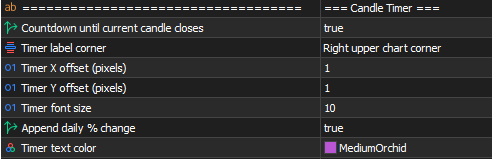
⏱ Candle Timer
Show Candle Timer – Live countdown until the current candle closes.
Candle Timer Corner / Offset X / Offset Y – Timer label position.
Candle Timer Font Size / Text Color – Visual customization.
Candle Timer Show Daily Percent – Optionally appends daily % change to the countdown.
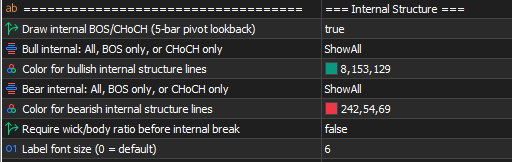
🔄 Internal Structure
Show Internal Structure – Internal BOS and CHoCH labels with dashed lines.
Internal structure uses a fixed 5-bar pivot lookback (5 bars left + 5 bars right). This is not configurable in Inputs.
Internal Bull Filter / Internal Bear Filter – Per side, choose what to display:
- ShowAll – BOS and CHoCH
- ShowBOS – Break of Structure only
- ShowCHoCH – Change of Character only
Internal Bull Color / Internal Bear Color – Colors for bullish and bearish internal structure.
Use Internal Confluence Filter – Requires a minimum wick/body ratio before confirming an internal break.
Font Size Internal Structure – Label size ( 0 = default).
📌 Concepts – Market Structure (BOS & CHoCH)
A Break of Structure (BOS) occurs when price continues the trend by breaking a previous high in an uptrend or a previous low in a downtrend.
A Change of Character (CHoCH) occurs when price breaks structure against the current trend, signaling a potential reversal.
Internal structure = short-term shifts. Swing structure = major structure.
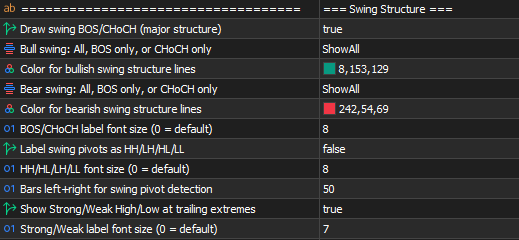
🔁 Swing Structure
Show Swing Structure – Swing BOS and CHoCH with solid lines and larger labels.
Swing Bull Filter / Swing Bear Filter – Same options as internal: ShowAll , ShowBOS , or ShowCHoCH .
Swing Bull Color / Swing Bear Color – Colors for bullish and bearish swing structure.
Font Size Swing Structure – BOS/CHoCH label size.
Show Swing Points – Labels swing pivots as HH, HL, LH, LL.
Font Size Swing Points – Swing point label size.
Swing Length – Bars left + right for swing pivot detection. Lower = faster but noisier; higher = slower but cleaner.
Show Strong Weak Labels – Strong/Weak High/Low at trailing swing extremes.
Font Size Strong Weak – Strong/weak label size.
📌 Concepts – Strong vs Weak Highs/Lows
A strong high or low supports trend continuation and is less likely to break.
A weak high or low is more likely to be taken by price.
- In an uptrend → lows are strong, highs are weak
- In a downtrend → highs are strong, lows are weak
Weak levels are common liquidity targets; strong levels tend to hold.
📦 Order Blocks
Show Internal Order Blocks – Rectangles for internal (short-term) order blocks.
Internal OB Show Last – Max recent internal OB boxes on chart.
Show Swing Order Blocks – Rectangles for swing-level order blocks.
Swing OB Show Last – Max recent swing OB boxes on chart.
Order Block Filter – Minimum block size:
- ATR – Average True Range
- CMR – Candle mean range
Order Block Mitigation – How blocks are invalidated:
- MitigateClose – On candle close through the block
- MitigateHighLow – On high/low touch (default)
Internal Bull OB Color / Internal Bear OB Color – Internal block fill colors.
Swing Bull OB Color / Swing Bear OB Color – Swing block fill colors.

📌 Concepts – Order Blocks & Mitigation
An order block is the price area where a directional shift begins — typically the last opposite candle before an impulsive move.
- Bullish OB → confirmed when price breaks the last confirmed high (BOS)
- Bearish OB → confirmed when price breaks the last confirmed low
Mitigation is when price returns to the block; invalidated blocks are removed per your mitigation setting.
⚖️ Equal High / Low (EQH / EQL)
Show Equal High Low – Detects and labels equal highs and equal lows.
Equal Bars Confirmation – Bars on each side of the pivot to confirm EQH/EQL.
Equal Level Threshold – Max distance between levels (ATR multiplier).
Font Size EQH EQL – Label size.

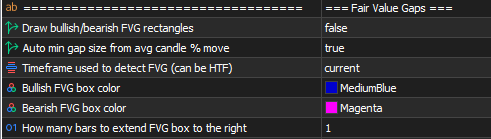
🟩 Fair Value Gaps (FVG)
Show Fair Value Gaps – Bullish and bearish FVG rectangles.
Use Auto FVG Threshold – Filters small gaps using average candle movement.
FVG Timeframe – Timeframe for FVG detection (can be higher than the chart).
Bull FVG Color / Bear FVG Color – Box colors.
FVG Extend Bars – Bars to extend boxes to the right.
Auto FVG threshold can also be toggled from the control panel.
📌 Concepts – Fair Value Gaps (Imbalance)
An FVG forms when price moves aggressively, leaving a gap between candles with little trading.
- Bullish FVG – Low of candle 3 above high of candle 1
- Bearish FVG – High of candle 3 below low of candle 1
Price often returns to rebalance. FVGs can act as support (bullish) or resistance (bearish).
💡 Strong impulsive moves leave larger gaps. Auto-threshold keeps the chart focused on meaningful imbalances.
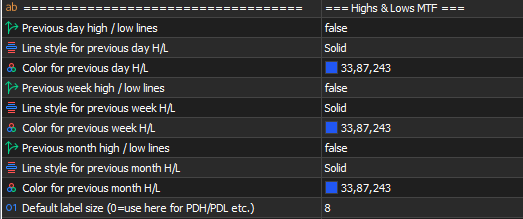
📊 Highs & Lows MTF
Show Previous Day HL – Previous day high/low (style and color).
Show Previous Week HL – Previous week high/low.
Show Previous Month HL – Previous month high/low.
Font Size Default – Label size for PDH/PDL, PWH/PWL, PMH/PML.
Widely used as liquidity references and structure anchors.
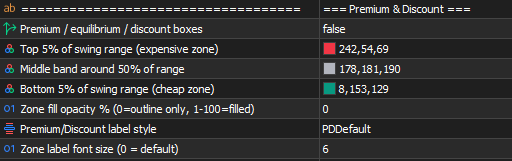
💰 Premium & Discount
Show Premium Discount Zones – Premium, equilibrium, and discount boxes from the current swing range.
Premium Zone Color – Top ~5% of range (expensive zone).
Equilibrium Zone Color – Middle band around 50%.
Discount Zone Color – Bottom ~5% of range (cheap zone).
Premium Discount Opacity – Fill opacity ( 0 = outline only, 1–100 = filled).
Premium Discount Label Style – PDDefault or PDBubble .
Font Size Premium Discount – Zone label size.
📌 Concepts – Premium & Discount
Defined from the range between the current swing high and swing low:
- Above 50% → premium (relatively expensive)
- Below 50% → discount (relatively cheap)
The range adapts to structure — not fixed levels.
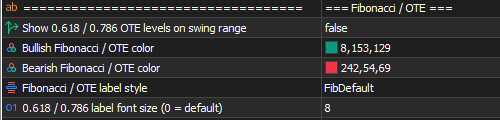
📐 Fibonacci / OTE
Show Fib OTE Levels – Draws 0.618 and 0.786 on the current swing range.
Bull Fib OTE Color / Bear Fib OTE Color – Colors by trend direction.
Fib OTE Label Style – FibDefault or FibBubble .
Font Size Fib OTE – Fibonacci label size.
📌 Concepts – Optimal Trade Entry (OTE)
OTE is a refined zone within premium or discount, typically between 62% and 79% retracement of the swing range.
- Uptrend → OTE in discount (buy area)
- Downtrend → OTE in premium (sell area)
Targets deeper retracements for better risk-to-reward. Combine with structure, OB, FVG, and liquidity levels.
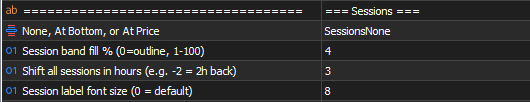
🕒 Sessions
Sessions Display – How sessions appear:
- SessionsNone – Hidden in Inputs (can enable from panel; defaults to bottom timeline when toggled ON)
- SessionsAtBottom – Timeline at bottom of chart
- SessionsAtPrice – Boxes around price action
Sessions Opacity – Band fill ( 0 = outline only).
Session Time Offset Hours – Shifts all sessions to match broker time.
Font Size Sessions – Session label size.
Major sessions
Each has: show on/off, time range, label, color — Frankfurt, London, New York, Sydney, Tokyo
Silver bullets
London, New York, NY PM — custom time, label, color
Kill zones
Asia, London AM, New York, London PM — custom time, label, color
Up to 12 time slots (markets + silver bullets + kill zones).
📌 Concepts – Sessions, Kill Zones & Silver Bullet
Sessions – Forex runs 24h across Sydney, Tokyo, Frankfurt, London, and New York. London and New York are usually the most active.
Kill zones – Short windows of higher liquidity and volatility (session opens, overlaps). More BOS/CHoCH and stop runs are common here.
Silver Bullet – Narrow intraday window (often London or NY) where liquidity, structure, and imbalances align for high-probability setups.
Combine sessions with structure, OB, FVG, and premium/discount for better timing.
🔤 Font Sizes
Font sizes live inside each feature section in Inputs (not one global block):
Section in Inputs Parameter
0 = default for that section. Affects labels only, not logic.
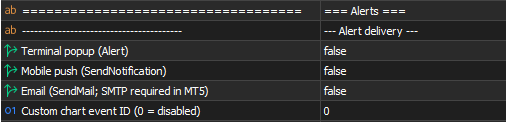
🔔 Alerts
Alert delivery
- Alert Terminal Popup – Terminal Alert()
- Alert Mobile Push – SendNotification()
- Alert Email – SendMail() (SMTP in terminal settings)
- Alert Custom Event ID – Custom chart event for EAs/scripts ( 0 = off)
Enable at least one delivery method.
Alert conditions
Structure breaks – Swing +BOS/−BOS/+CHoCH/−CHoCH; Internal +iBOS/−iBOS/+iCHoCH/−iCHoCH
Order blocks – Internal and swing OB breakouts
EQH / EQL – Equal highs and equal lows detected
FVG – Bullish and bearish FVG created
Touch (once per bar) – Internal/swing OB touch; FVG touch; premium/discount/equilibrium touch; PDH/PDL, PWH/PWL, PMH/PML touch; Fibonacci touch ( alertFibLevel , e.g. 0.618 or 0.786 )
Swing points (bar close) – HH, HL, LH, LL created
💡 Sessions do not trigger alerts — alerts focus on structure and price-level interaction.
📩 Support
Questions or feedback are welcome.
⬇️ Smart Market Concepts (MT5): https://www.mql5.com/en/market/product/178131
⬇️ Smart Market Concepts (MT4): https://www.mql5.com/en/market/product/178130


")
")