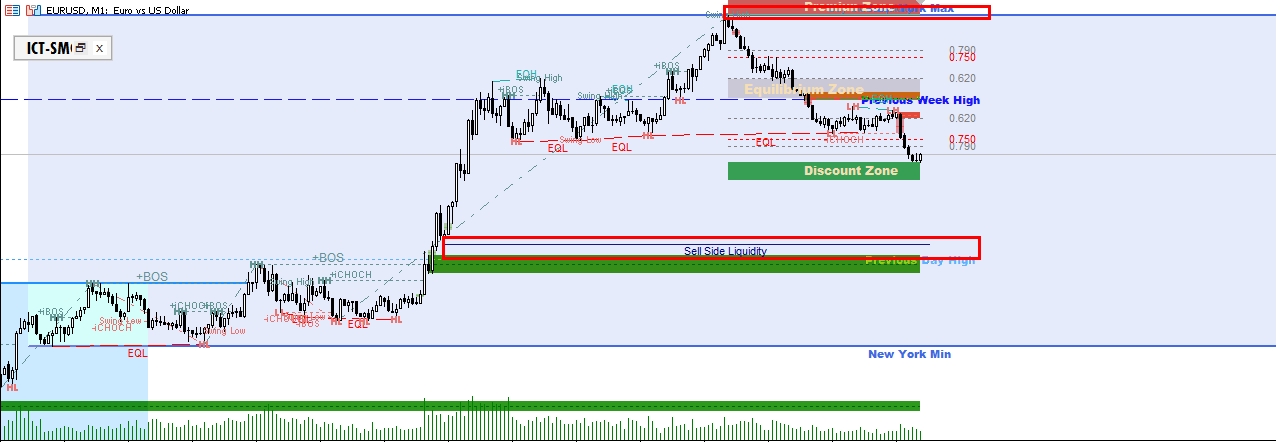
LEARNING TO USE THE ICT-SMC CONCEPTS INDICATOR - PART 4: BSL SSL and Daily, monthly and weekly highs and lows
BSL SLL
Buy Side Liquidity (BSL) and Sell Side Liquidity (SSL) are essential concepts within ICT.
-
BSL (Buy Side Liquidity): Represents the buying liquidity zones.
-
SSL (Sell Side Liquidity): Represents the selling liquidity zones.
In the ICT-SMC indicator, these zones are marked by lines, allowing you to visually identify where the areas of liquidity accumulation and distribution are located.
Example of this concept within the indicator:

BSL and SSL Configuration Example
Below are the configuration parameters to customize the appearance of the BSL and SSL lines on the indicator:
- BSL and SSL line width:
Choose the width of the line that will be used to represent the BSL and SSL.
- choose the color of the Sell Side Liquidity line and text:
Select the color for the line and text that will represent the SSL.
- choose the color of the Buy Side Liquidity line and text:
Select the color for the line and text that will represent the BSL.
- BSL and SSL line style:
Choose the line style (e.g., solid, dotted, dashed, etc.) for BSL and SSL. See the post: Types of lines in MT5.
Previous Highs and Lows
This section covers the configuration of levels based on highs and lows from previous periods, divided into three groups:
- Previous Day:
- PDL (Previous Day Low): Minimum of the previous day.
- PDH (Previous Day High): Maximum of the previous day.
- Previous Week:
- PWL (Previous Weekly Low): Minimum of the previous week.
- PWH (Previous Weekly High): Maximum of the previous week.
- Previous Month:
- PML (Previous Monthly Low): Low of the previous month.
- PMH (Previous Monthly High): Maximum of the previous month.
General Parameters
- Line width (PDL / PDH / PWL / PWH / PML / PMH):
Elige el ancho de la línea que se utilizará para dibujar los conceptos (PDL, PDH, PWL, PWH, PML y PMH) en el gráfico.
Previous Day Configuration (PDL and PDH)
- choose the line and text color of the previous day low:
Choose the line and text color for the PDL (minimum of the previous day).
- choose the line and text color of the previous day high:
Choose the line and text color for the PDH (previous day's high).
- pdl and pdh line style:
Choose the line type (e.g., dotted, solid, etc.) to apply to both PDL and PDH. See the post: Types of lines in MT5.
Previous Week Configuration (PWL and PWH)
- choose the line and text color of the previous weekly high:
Choose the line and text color for the PWH (previous week high).
- choose the line and text color of the previous weekly low:
Choose the line and text color for the PWL (minimum of the previous week).
- pwl and pwh line style:
Choose the type of line to use to draw the PWL and PWH levels. See the post: Types of lines in MT5.
Previous Month Configuration (PML and PMH)
- choose the line and text color of the previous Monthly high:
Choose the line color and text for the PMH (previous month's maximum).
- choose the line and text color of the previous Monthly low:
Choose the line color and text for the PML (previous month minimum).
- pml and pmh line style:
Choose the line type that will apply to both PML and PMH. See the post: Types of lines in MT5.


