Integrating the Optimus Time Tracker with Trading Generally: Boosting Precision and Performance
Introduction
Optimus Time Tracker Indicator
Profitable Trading usually occurs when we have the odds in our favour, although we may not need to be right all the time to make money, we at least need to be confident in the approach we are taking when we speculate.
Technical analysis and mostly all form of analysis is built on the fact that "History is Likely to repeat itself" from studying the event of the past we can be able to uncover patterns in data which then form the basis of our decision making..
The Theme of Probabilities run through out the trading industry and for good reason, trading is a numbers game and a game of odds, Traders are in a constant bid of weighing the probability of one outcome over the other outcome. This is the basic concept of how profitable trading ought to be. However in order for us to properly estimate probabilities we ought to have in handy the data and statistics that backs each outcome, only then can we properly frame the idea for one outcome over the other.
Technical analysis is built on 2 pillars; 1. Time 2. Price. Extensive work and research has been carried out in the field of price however, very little emphasis and attention has been given to time for the most part, this leaves an uncharted edge in the field of Time.
Now, this is where the integration of the Optimus Time Tracker Indicator Comes in handy, This indicator is built to Collect the Data and Display the Statistics of the most important Factors of Time relative to price, the result produced are eye opening and one could immediately see patterns as to how price is contained within finite time constructs, and from this data alone one can carve out a profitable trading approach relying on the statistics and probabilities surrounding the Field of Time.
In this post our objective is to reveal the various ways one could apply the information generated by the Optimus Time Tracker Indicator in ones Trading routine or approach, we indulge you to stay tuned in until the end, as this read will definitely be worthwhile...
The Weekly High and Low Statistics
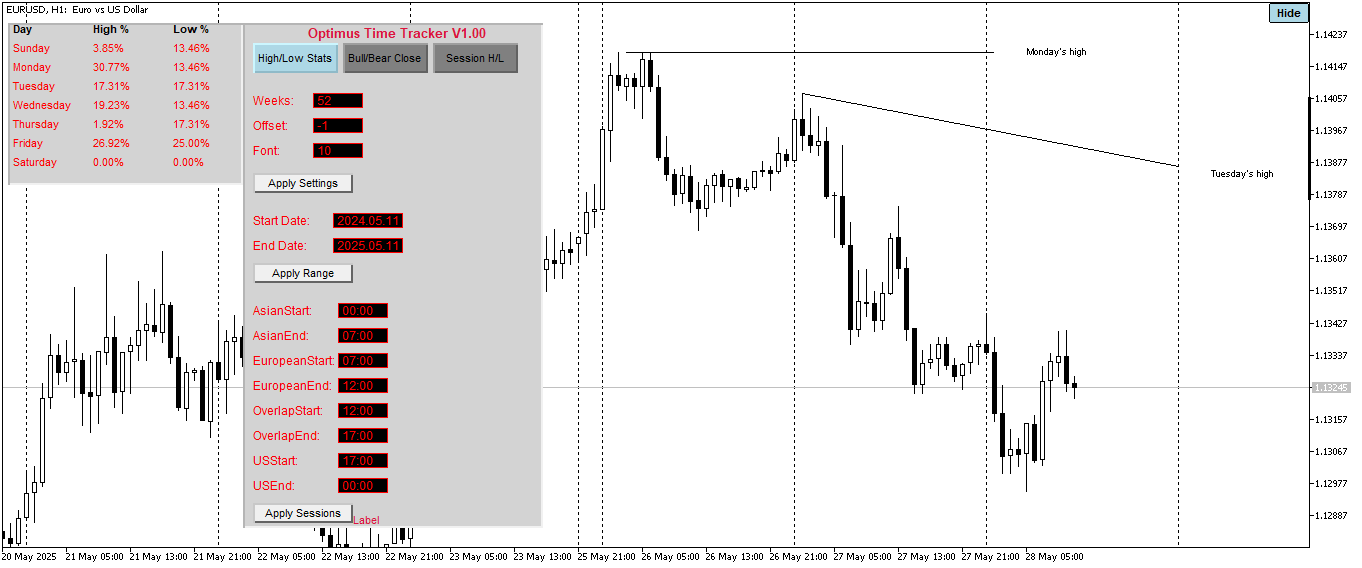
This is the first mode of the indicator, and it gathers data on the frequency with which each day of the week forms the high or low for the weeks within the lookback period or the custom range input. This information is highly valuable, as it gives us insight into when we can typically expect these important price points to form...... This can aid how traders analyze and how we determine our bias especially when lined up with market structure...
example; When price is approaching a Level of support on a Tuesday and from our stats we can see that Tuesday is more likely to form the low of the week, and price has a bullish structure, this can help us determine that the support will hold and Wednessday's price action is likey to stay above Tuesday's low and we would be looking to go long on Wednessday, and on that Tuesday we would be watching for price action signals indicating that price has found support solidifying that the low of the week has been made.

Let's Look at an actual Recent example; in the chart above we can see that our lookback period is set to 52 weeks, this means we are considering the last 52 weeks which is one year from the previous week, and in this example we can see that monday has a 30.77% chance of making the high of the week, having this in mind we then take a look at the market structure, and we can see that price delivered a strong bullish expansion from Thursday of the previous week, this suggest to us that there is a high chance that price is most apt to retrace off the highs to form a more sustainable structure and with that possibility we can see that there is a high probability for the high which was made on Monday to be protected, and for Tuesday to expand to the downside.
This is a valid trade scenario and we would also break it down further to see how the other modes of the Optimus Time Tracker Indicator played key roles in making this trade a high probability trade.
The Bullish and Bearish Close Mode
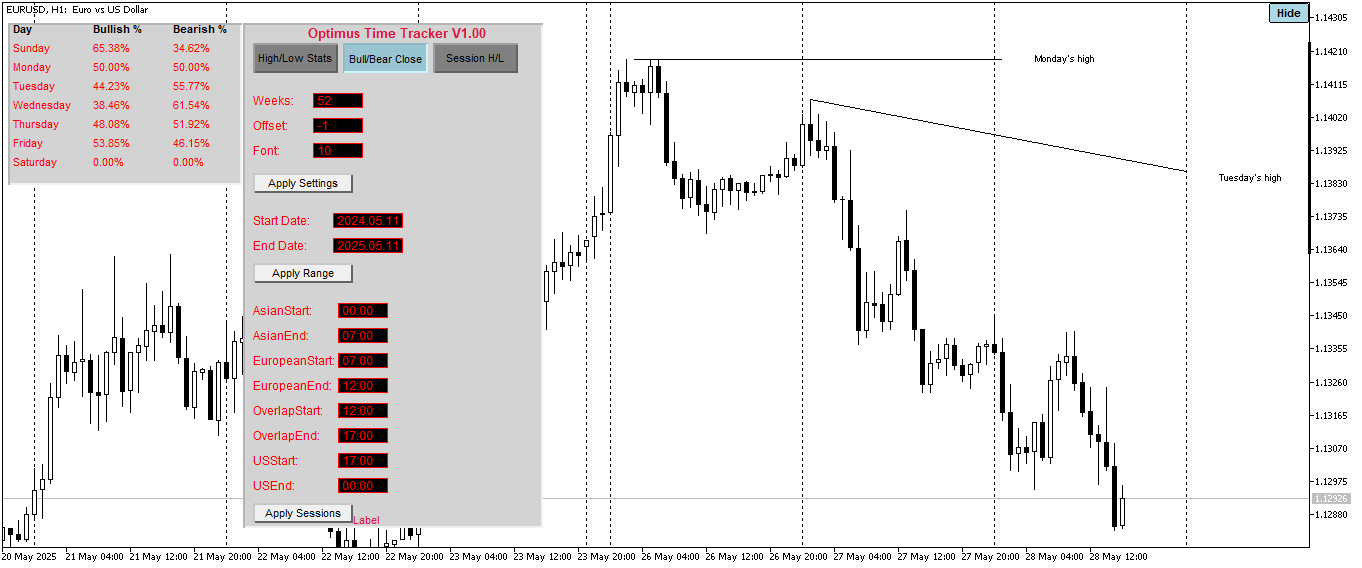
This Mode is very crucial in the determination of bias as this mode cuts straight through the data and extracts the insight into the frequency for how each day of the week closes either Bullish or Bearish. You'd be supprised the hidden patterns we uncover when we take a keen look into what this data tells us. Occassionaly we see some days that have an uneven weighing for the distribution of the close either in the bullish or the bearish camp for the days of the week. when a day of the week has a reading that is above 50% on one camp over the other, it means that there is a higher chances for that particular day to close on that side of the fence. This may sound like a simple or naive interpretation of the data, but mind you that this data updates every new week ensuring that the reading is current and relevant to price. You'd be supprised how the developing days of the current week have a high probability of closing as suggested by the Data. However we should not be carried away by the readings of the data on this mode and expect everyday to close according to what the data tells us, We should remember that our job as traders or speculators is to weigh the probability of favorable outcomes when certain variables and elements are present. Having this in mind, our trade selection process should include using this data as a guide or a confluence and then picking trades that are in alignment with what this data suggests.
The following example will shine more light on how the Bullish and Bearish Close Mode can be applied along with the other mode, adding an extra layer of confluence and overall complementing the current market structure;

In the chart Example above we can see that on the Bullish and Bearish Mode, Tuesday has Closed Bearishly 55.77% of the time within the lookback period, which is the last one year counting from the last completed week. This alone is insightful and when this aligns with what the current market structure is suggesting, it increases the probablilty that the bearish movement will unfold. now let's look at how this adds up to the readings of the previous mode;
In the Weekly High and Low Stats we could see that Monday had the highest frequency for making the high of the week, this first of all suggests to us that about 30% of the weeks within the look back period had bearish expansions that ensued from monday, the first trading day of the week. Having this in mind plus the current bearish structure, it is not inprobable for us to anticipate that Tuesday will deliver to the downside. Now if Monday is apt to make the high of the week and Tuesday is more likely to close as a bearish bar, we are then inclined to hunt for an opportunity to take a short position on Tuesday. This is where the next mode of the Optimus Time Tracker Indicator Comes in Handy, "The High and Low of the Day By Session Mode".
The High and Low of The Day by Session Mode
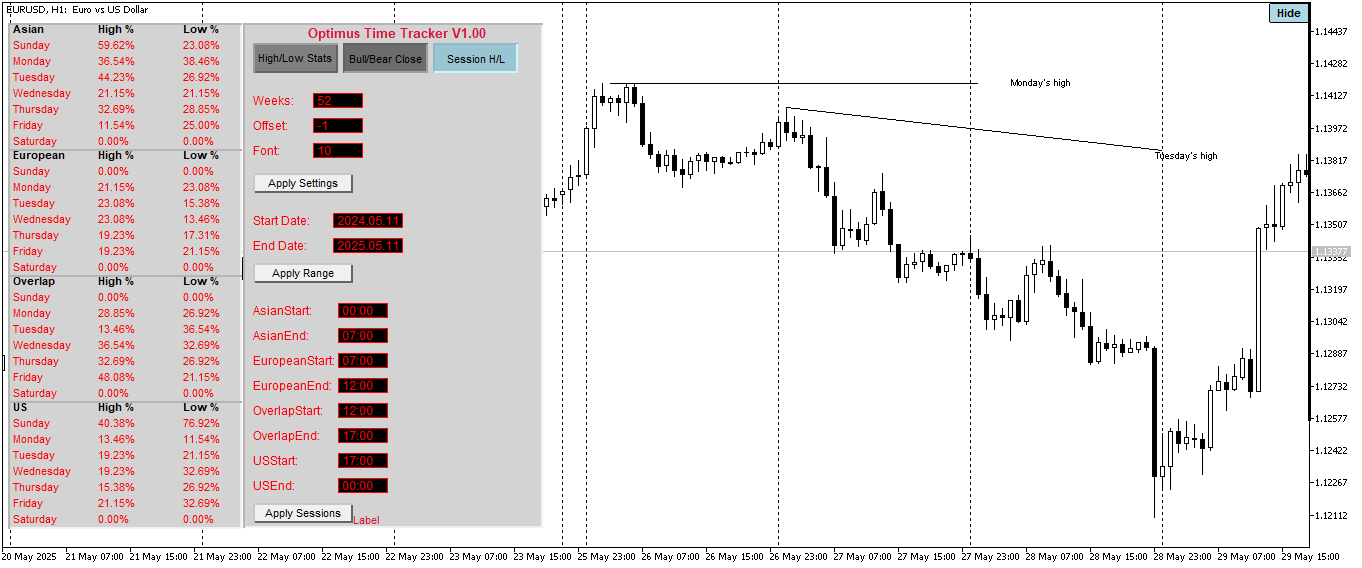
This modes collects and Calculates the data on the frequency of the sessions that made the high and low of the day for each of days of the week within the look back period or the custom range input, the session are distributed into four sections and it's boundaries are defined by the user input, if the user prefers the session boundary time to be aligned to his or her local time, the user can adjust the server Offset input if the local time differs from the broker time; otherwise, the offset should be set to zero to maintain the broker's time. The session are divided into; Asian Session, London Session, Overlap Session and the New York Session. Basically this are the industry standard sessions. Now, how does this data aid our decision making as to what price is likely to do? To answer this question we will refer to the current example we've been Making good use of and see how this would have added an extra layer of clarity to the trade scenario from Tuesday's Price action.

Lets Explore the rich insight we can extract from the readings of the data of the High and Low of the Day by Session Mode, in the Chart Example Above, we can see that the high of the day on Tuesday usually forms in the Asian Session by a Strong Reading of 44.23%, that's incredible, and we can also see that the low on Tuesdays within the lookback period Typically forms in the Overlap Session with a Strong reading of 36.54%, having this in mind and also considering the readings of the previous modes, the Probability for price to expand to the downside skyrockets. Now, when we take a look at the price action on Tuesday, we could see that the high on Tuesday digged into the FVG from Monday's price action, it failed to take out Mondays high and then reversed form that point, this occured within the Asian session and price expanded to the downside and the low of the day was made within the Overlap Session.
Having all this in alignment, the Decline on Tuesday no longer seems to be a product of randomness and our decision making is niether a product of guess work, we carefully accessed the possible outcomes then based on the Statistics of the data from the Optimus Time Tracker Indicator in confluence with simple Market Structure Concepts, we chose the most Probable outcome.
In Life generally, Simplicity is key and this also applies in Trading, the more simplified our trading methodology can be the easier it is for proper execution, the Optimus Time Tracker Indicator offers such simplicity and the approach explained in this post is just one way it's information could be applied, there several other ways this information can be applied which all depends on the rich imagination and insight of the user.
Get the Optimus Time Tracker Indicator Today and Explore its limitless Potentials.


