
"Trader Evolution" - A utility designed for traders who use elliott wave and technical analysis in their trading. The utility includes two panels at once:
- " MM " - a panel for trading and money management. It can work with pending and immediate orders, and is equipped with trailing stop, breakeven and take profit functions.
- " EWA " is a panel that simplifies and speeds up the construction of wave and technical analysis. Helps to build all wave patterns, support and resistance levels, trend lines and figures.
Disclaimer:
- The panel is intended for trading only on currency pairs and only on dollar accounts.
- The panel is available for the fourth and fifth versions of the trading terminal:
Switching between panels is done by clicking on the tabs:
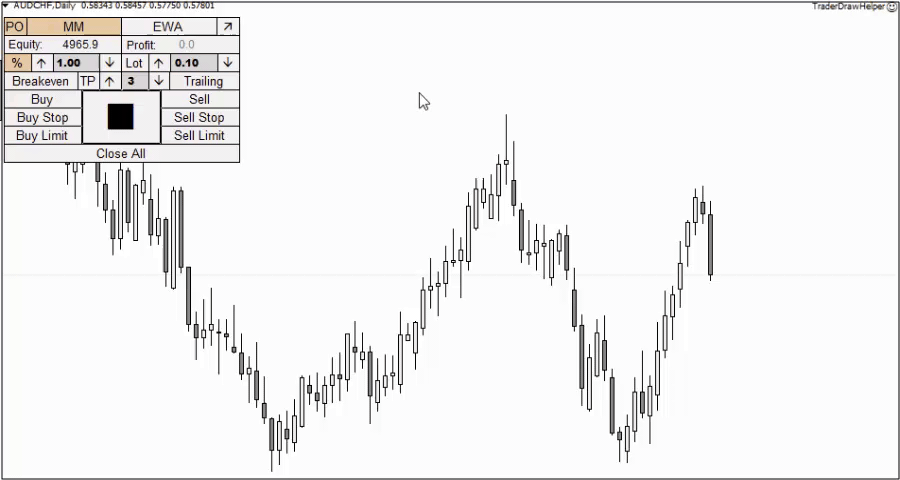
MM Tab - Money Management and Trading
The panel provides two ways of money management:
Fixed Percent Method
The essence of the method is that one trading operation always uses the same risk, which is set on the indicator panel. By default it is 1%, but you can increase and decrease it using the up and down arrows. The lot size in this case will depend on the size of the Stop Loss. The higher the Stop Loss size, the lower the lot size. The smaller the Stop Loss, the bigger the lot size. 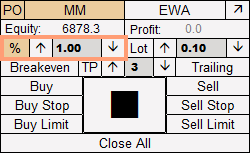
Default percentage change step = 0.5. Can be changed in the external parameters of the indicator. The "stepPercent" parameter is responsible for this.
Trading Lot
Implies the use of a predetermined trading volume. To activate this money management method, click on the "Lot" button. The default volume = 0.1 lot and can be changed using the up and down arrows.
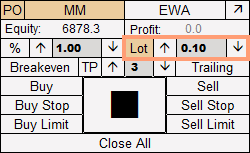
The lot change step can be changed in the external parameters of the indicator. The "stepLot" parameter is responsible for this.
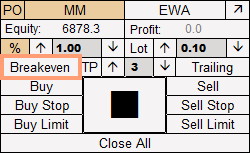
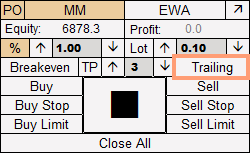
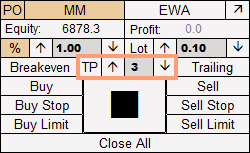
TakeProfit, Breakeven, Trailing Stop
"Breakeven" - responsible for moving a trade to breakeven. As soon as the price moves into the positive zone within the range allowed by the broker, clicking on the "Breakeven" button will move your Stop Loss to the trade opening level.
"Trailing" - enables the "Trailing Stop" function. When the price passes a certain range (for example, 500 points on the fifth symbol after the dot or 50 points on the fourth symbol after the dot), the price moves to the trade opening level and moves along with the price as it moves.
Fractal trailing stop (Added in update 1.6). Activated when the "Trailing" and fractal buttons are pressed. By default, the current timeframe is used for trailing (FractalTrailingTF parameter). In the parameters you can select a specific timeframe for trailing (recommended). Note: the stop loss will not return beyond the fractal if its level is below the fractal sell signal or above the fractal buy signal.
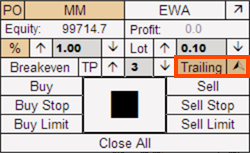
It is important to note that for different currency pairs the trailing stop parameter must be selected separately, since different instruments have different volatility. The size of the trailing stop is determined by the "Trailing" parameter in the external parameters of the panel.
"TP" - responsible for setting the "Take Profit" order. The default ratio is 1 Stop Loss = 3 Take Profit. When you click on the "TP" button, Take Profit will be set. The ratio of Stop Loss to Take Profit can be changed using the down and up arrows.
Trade orders
The panel is capable of opening both immediate and pending orders. Currently available:
- Buy
- Sell
- Buy Stop
- Buy Limit
- Sell Stop
- Sell Limit
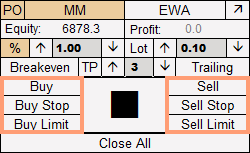
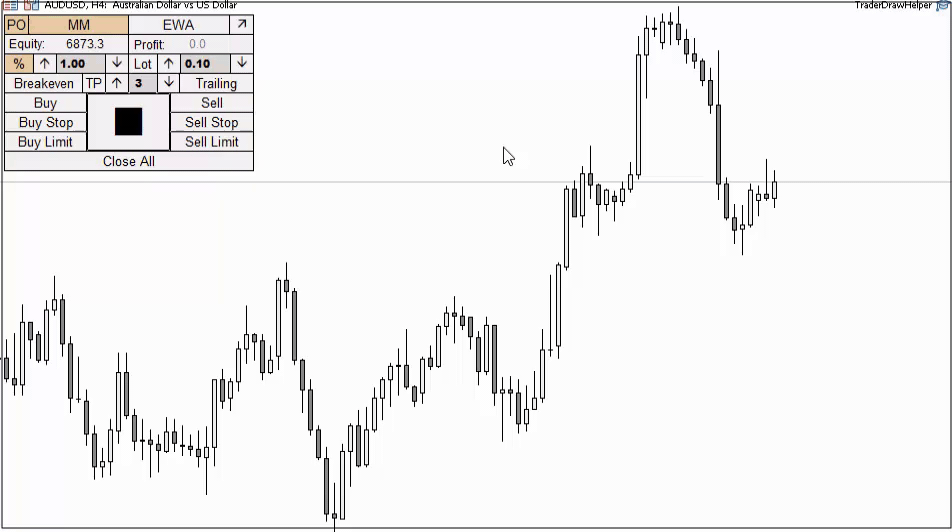
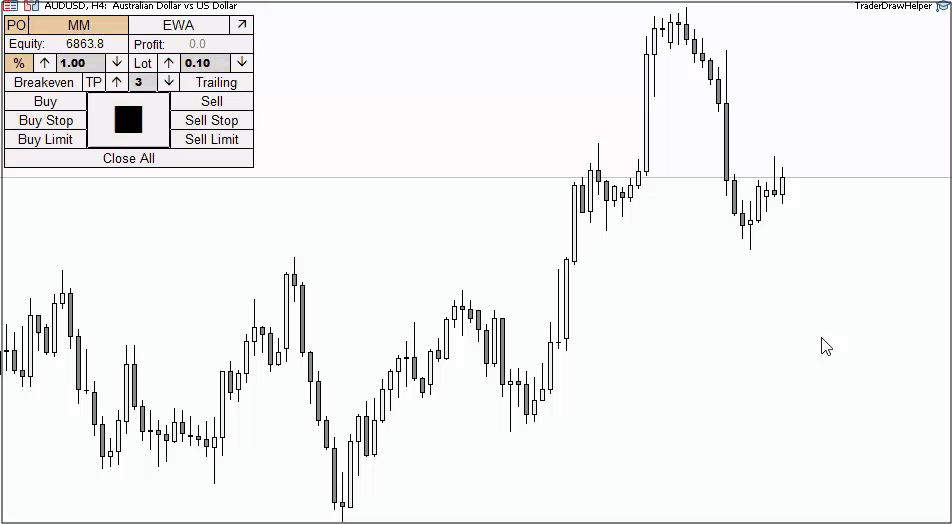
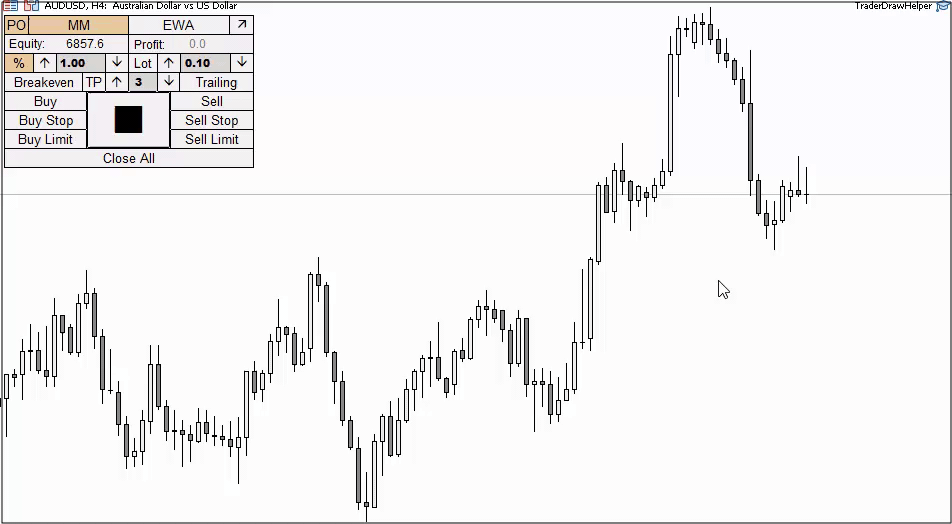
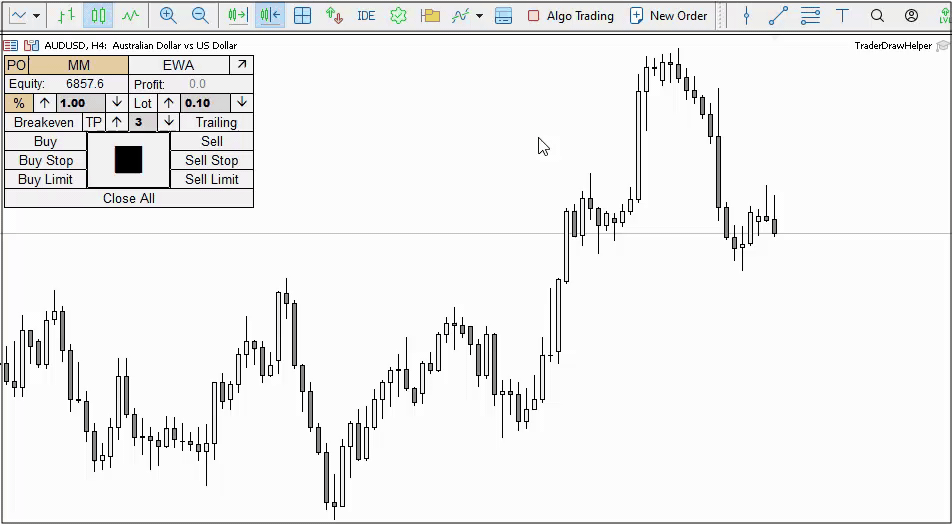
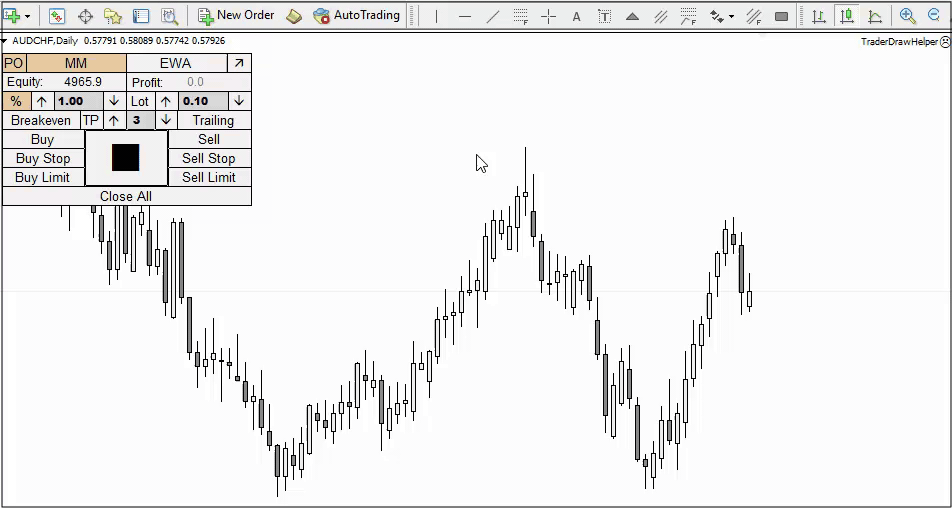
If you do not use pending orders in trading, you can remove it by clicking on the “PO” button in the upper left corner of the screen. In the example below, I turned off pending orders and left only immediate ones.
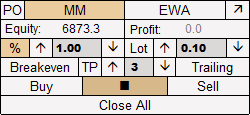
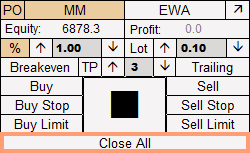
The "Close All" button is intended to close all orders on the current chart, as well as to delete all pending orders on the current chart.
Panel activation
In order to activate the panel, you need to click on the large square button in the center. After clicking it, two lines (orange and blue) will appear on the chart, and the spread will also be displayed under the current price line.
Orange line - Potential Stop Loss level for immediate and pending orders. Must be set where you intend to place your Stop Loss level.
Blue line - Level of a potential pending order. It doesn't matter which one. Must be set where you are going to place a pending order.
Information above the orange line
Above the orange line is information about a future immediate order. From left to right:
- Lot - Lot for the current trading operation
- $ - Risk in the deposit currency in dollars (risk as a percentage of the deposit)
- S/L - Stop Loss size in pips
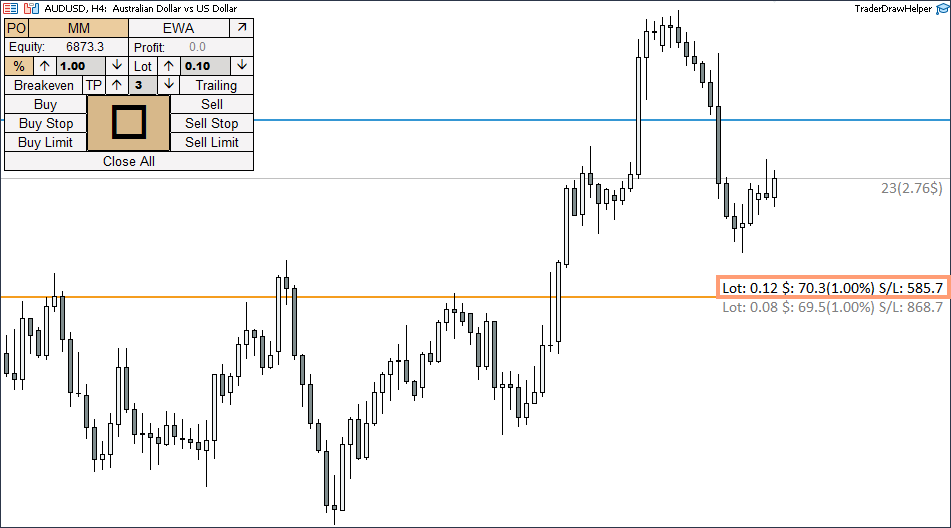
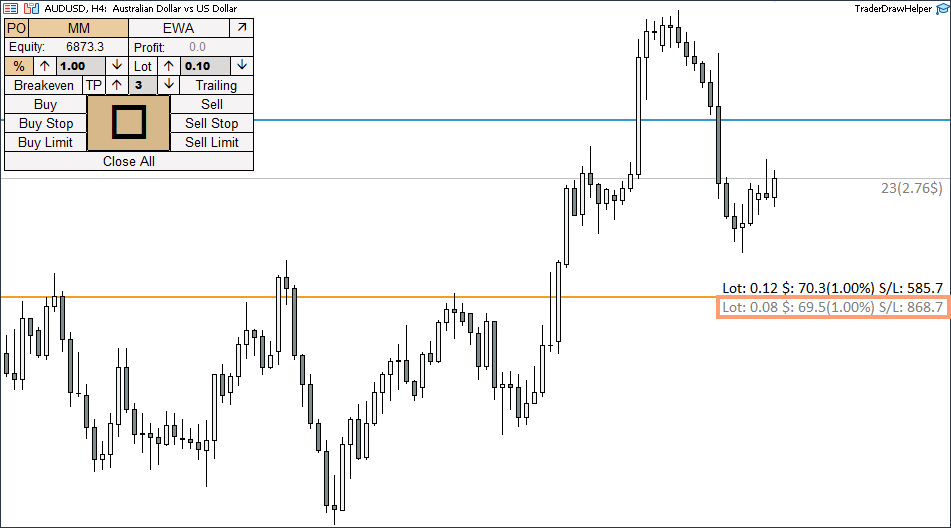
Information under the orange line
Below the orange line is information on a future pending order. From left to right:
- Lot - Lot of the future pending order
- $ - Risk in the deposit currency in dollars (risk as a percentage of the deposit)
- S/L - Stop Loss size in points for a pending order
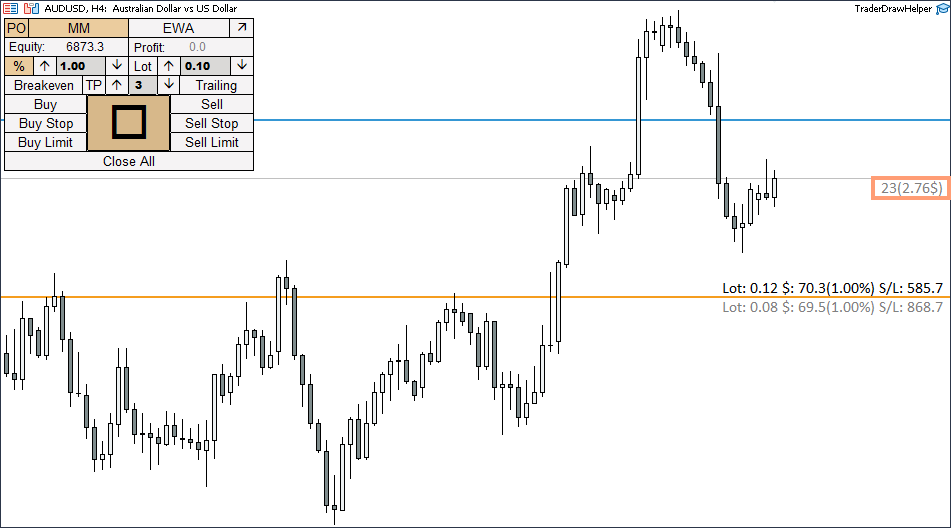
Spread
Below the current price line you can see the spread for the future trading operation. It is displayed in points and in deposit currency (calculated based on the lot value of the immediate order).
Opening an immediate order
To open an immediate order, you need to drag the orange line to the level of your future Stop Loss and click on the “Buy” or “Sell” button. If the line is not active (there are points to the right and left of it in the active phase), then you should activate it by double-clicking on it with the left mouse button.
Below, using the example, I will open sell and buy trades, having previously turned off pending orders. There is no need to disable them. An immediate order will work in any case.
Setting a pending order
To place a pending order, we need both lines: blue and orange.
Buy Stop - move the blue line above the current price and the orange line below the blue one

Sell Stop - move the blue line below the current price and the orange line above the blue one.
Buy Limit - move the blue line below the current price, and the orange line below the blue one.
Sell Limit - move the blue line above the current price, and the orange line above the blue one.
Protection system
By default, the program has a built-in protection system, the main task of which is to prevent you from opening positions with a large trading volume. If you wish, you can turn it off in the panel's external parameters.
We implemented two restrictions:
- By volume (MaxLotValue) - Default value is 1 lot.
- By risk percentage (MaxPercentValue) - Default value is 10%.
If the protection system is turned on and you violate the rules (for example, you open a trade with a large lot or the risk on the trade is more than 10%), then the program will not open the trade and will give you a warning that the acceptable risks have been exceeded.
Automatic trading
Before using the panel, make sure that automatic trading is enabled in your trading terminal. It is enabled differently in the fourth and fifth versions of the trading terminal.
Version for MT5
In the fifth version of the terminal, you need to click on the “Algo Trading” button, then go to the panel properties and in the “Common” tab, check the box next to “Allow Algo Trading”.
Version for MT4
In the fourth version of the terminal, you need to click on the “Auto Trading” button, then go to the properties of the advisor and check the box next to “Allow live trading”.
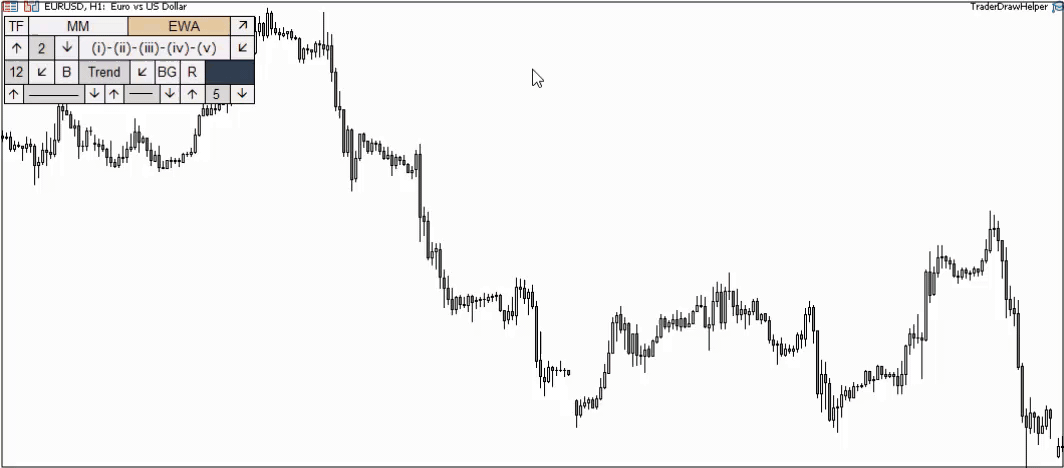
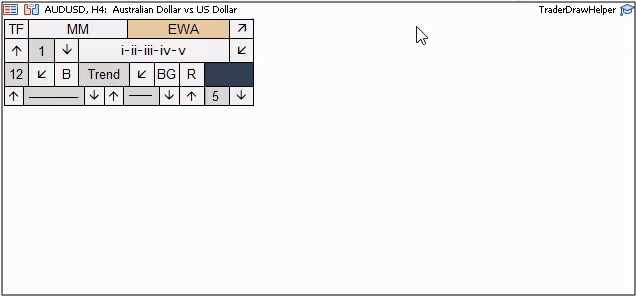
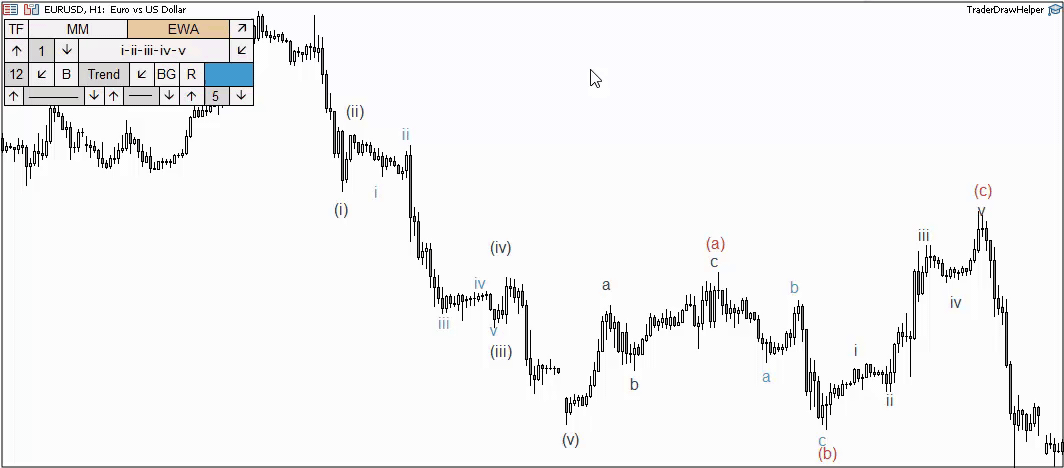
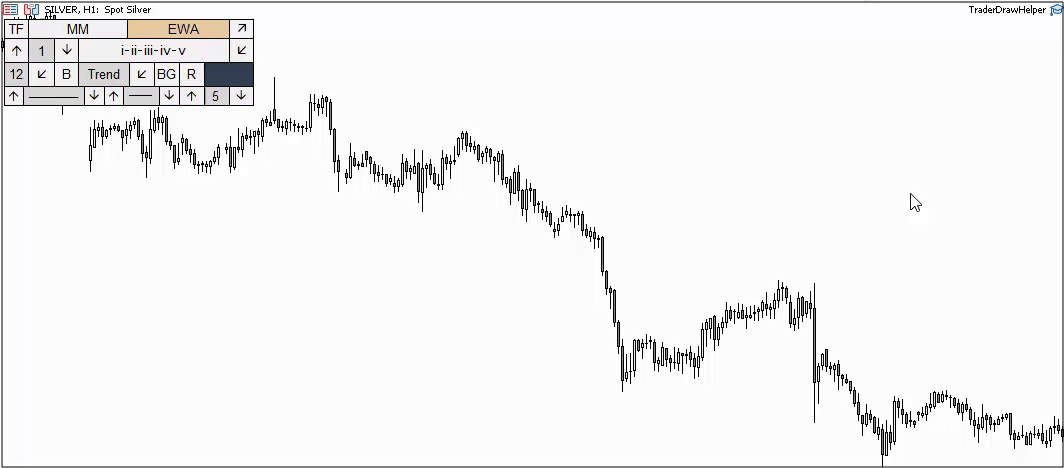
EWA Tab - Making Wave and Technical Analysis
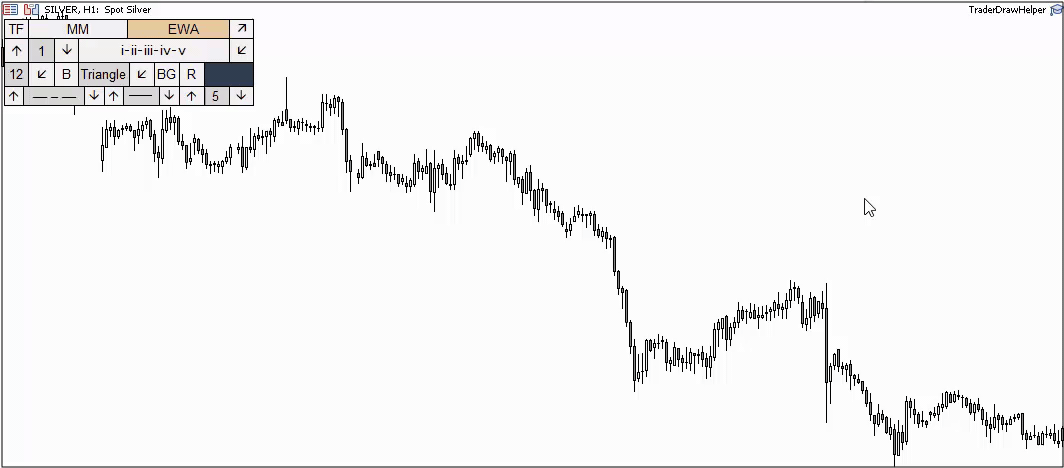
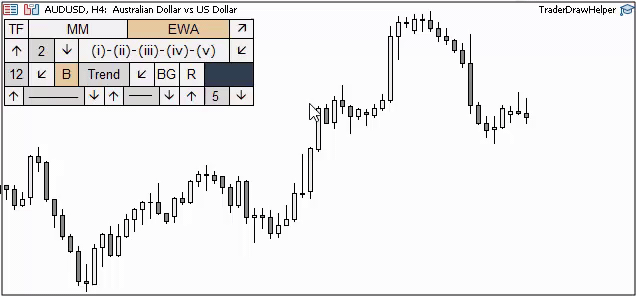
Wave analysis. Types of available patterns
- Impulse(1-2-3-4-5)
- Zigzag/Flat(A-B-C)
- triangle(A-B-C-D-E)
- Double combination(W-X-Y)
- Triple combination(W-X-Y-X-Z)
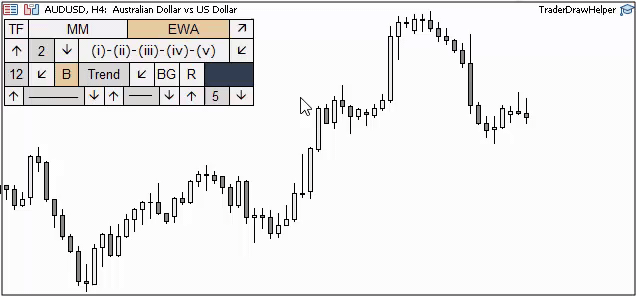
Wave analysis. Changing Pattern
This is done by clicking on the down arrow in the drop-down menu.

Wave analysis. Change of wave order
There are a total of 9 wave orders, which are responsible for the position of waves in the hierarchy and for their visual display. The down and up arrows located to the left of the pattern name are responsible for this. Between the arrows is the order number.
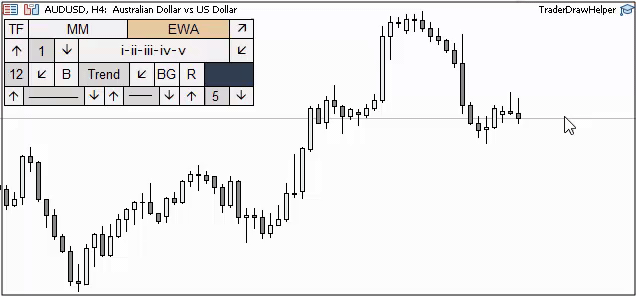
Choosing colors for patterns and lines
To select a color, click on the large rectangle and then select from the available colors. The selected color will apply not only to the letters and numbers representing wave patterns, but also to the levels and lines of technical analysis.

Making of the wave analasis
In order to build a wave pattern on the price chart, you need to click on the pattern button and activate it. After this, click the required number of times on the screen and the pattern will appear on the chart.
Wave analysis. Font
By default the panel uses font size 12. You can select it from the drop down menu. You can also make the font bold if you wish by pressing the "B" button.
Technical analysis. Types of available elements
In order to select one of the elements for construction, click on the drop-down menu, as shown in the picture below:
Making of the technical analysis
The making of technical analysis elements differs from the making of elliott wave analysis. In order to build a line or level, hold down the "Shift" key on your keyboard, and then click on the price chart.
- Line or segment: Hold Shift + 2 mouse clicks. 1 click - the first point, 2 clicks - the second point.
- Horizontal support or resistance level: Hold Shift + 1 click at the required level.
- Rectangle: Hold Shift + 2 clicks. 1 click is the lower left border of the rectangle, 2 clicks is the upper right border (variable).
- Triangle: Hold Shift + 3 clicks. Each click is responsible for the angle of the triangle.
Technical analysis. Line types
The logic of line type and thickness has been transferred from the trading terminal. The line on the left is responsible for the type of line, the line on the right is responsible for its thickness. Affects the segment, trend line and support or resistance level.
Background and color of rectangle and triangle
Unlike the color of letters, numbers and segments, the color of a rectangle and triangle is configured in the external parameters of the indicator. The parameters “ColorTr” (triangle) and “ColorSq” (rectangle) are responsible for this. The "BG" button is responsible for painting over the figures.
Working with timeframes
By default, all elements of technical and wave analysis are displayed only on the timeframe on which you are working. For example, if you are doing analysis on a daily chart, then all the letters, numbers and lines will also be displayed only on the daily chart.
If you want your waves and technical analysis to be displayed on multiple timeframes, then select these timeframes in the panel options before starting work. This is done by pressing the "TF" button, as indicated in the picture below:
External parameters
- startCoordX - The position of the panel about the X axis
- startCoordY - Panel Y position
- maxLotValue - The maximum possible lot value that the program opens
- maxPrcentValue - The maximum possible percentage of risk
- useRiskRounding - rounding the risk percentage values
- pendingOrder - Whether or not to use pending orders
- Deposit - Choose between Deposit and Equity to display on the panel
- stepPercent - Percentage step
- steplot - Lot step
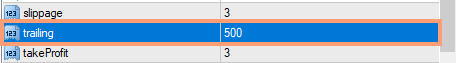
- sippage - Slippage
- traling- Value for trailing stop
- Fractal_StopLoss - Indent in points from the Stop Loss level for a fractal trailing stop.
- FractalTrailingBars - (1) Use fractals where the second bar after the fractal is not closed / (2) Use fractals where the second bar after the fractal is closed. Parameter for fractal trailing stop.
- FractalTrailingTF - Which timeframe to use for the fractal trailing stop.
- takeProfit - The ratio for the take profit function
- diapason - Deviation of order control lines from the current price
- showProfitLoss- Whether or not to display the current profit on the right above the order on the chart
- showSpread - Whether or not to display the current spread above the current price
- colorTextSpread - Spread display text
- movelinesAfterOpenOrder - Offset of order control lines after opening an order
- pipsspread - Line offset range.
- resetHotKeys- Hotkeys for shifting order control lines
- positonTextOnLine - Position for text above the order control line
- InfoTextFont - The font for the text above the order control line.
- InfoTextFontsize - Font size for text above the order control line
- colorTextLine - Information color for the immediate order
- colorTextLinePending - Information color for a pending order
- SLLineThick - Potential stop line thickness
- PendingLineThick - Line thickness of a potential pending order
- styleline - Potential stop line style
- styleLinePending - Line style of a potential pending order
- colerLine- Color of the potential stop line
- colorLinePending - Line color of a potential pending order
- colorTracing - Panel stroke color
- colorTextBtn- The color of the text on the panel
- colorFonButton - Panel background color
- colorBack - Background color of editable panel elements
- colorTextBack - Text color of editable panel elements
- colorTracingPopup - Stroke dropdown menus
- colorTextBtnPopup - The text color of the dropdown menus
- colorFonButtonPopup - Background color of the dropdown menus
- isFontCircle - Whether or not to use the circle font
- objectAsBG- apply or not the background to the lines
- anchorCharacter - binding for characters
- Selectbutton - Hotkey for drawing lines and shapes
- colotTr - Triangle color
- colorSq - Color of the rectangle


