

This is the manual for the stock index hedging EA which is available here:
MT4 Version here: https://www.mql5.com/en/market/product/106331/
MT5 Version here: https://www.mql5.com/en/market/product/106376/
This video coveres the strategy and also all inputs in the EA in detail if you prefer to watch instead of read!
We'll take a look at the logic behind the strategy and how it works, as well as go into each individual setting in the EA in detail so you fully understand how to setup and best use the EA for your trading on the stock indexes.
STRATEGY:
This is a variation on the opening range breakout strategy, (see this product https://www.mql5.com/en/market/product/90502) designed to take advantage of the opening volatility of the major stock indexes and profit from the sudden moves created at those times when the market breaks away at the opening bell. The strategies' goal is to simply benefit from those days when the market moves fast and hard in one direction (around 33% of the time) at the open and bank that move. If the market opens weak and directionless, the EA locks in a hedge and waits for the market to decide on a direction before exiting the positions. The stock index hedge EA analyses the range before the open and looks for an ideal tradeable distance to try and cash in as soon as the market opens with a fast move in either direction. This strategy works on any stock index like the DAX, DOW, NAS, S&P500 or FTSE.
BASIC FUNTIONALITY:
The EA takes 2 trades at the open and if successful, the EA takes profit on the first at a R:R ratio of your choosing and then protects the 2nd trade automatically with a breakeven stop loss. It then attempts to get a runner to your second TP target with the remaining trade to benefit from trend days.
First at the market open the EA analyses the pre-market range (first X candles before the open) to see if it falls within a tradeable range. Testing has determined that the ideal trading range is no less than 10% of ADR (average daily range) and no more than 20% of ADR to create the highest chance of a clean breakout and achievable target at the open, while minising the amount of whipsaw days that get hedged. If the ranges it analyses are within the perameters set it will place 2 pending orders above the range and 2 below the range. If the pre-market ranges are too large or small, it will skip the pre-market price action and attempt to take a break of the initial 5-minute candle which is called the opening range. This functionality helps to create ideal trading conditions at the open to avoid whipsaws where possible on ranges that are too tight or the possibility of not being able to achieve a target if ranges are too wide.
If the open is choppy and the market does not produce a clean break which hits TP, the EA will hedge the position and attempt to exit later in the session when price decides on a direction by exiting one direction's trades and then waiting for a pullback to exit the incorrectly positioned trade with a small profit. As soon as a hedge is locked in (2 longs and 2 shorts) the EA will automatically adjust the TPs for all trades to the level set in TP2 in the EA settings. The idea here is that we do not have a clear direction for price right now so we will let the market decide on a direction and attempt to take profit after it has moved a good distance from the open.
Two scenarios will now play out:
- We do not move far enough during the trading session/day to hit the target and we simply take a loss on the positions today. The hedge locks in our loss so we can not lose more that the hedged amount.
- Price moves far enough today to hit our target and we take profit on either the long or short positions, this now leaves us with the opposite positions open and in drawdown.
The EA now has 3 available mechanisms to deal with this floating drawdown and which you use is completely up to you. There is no right or wrong just different ways to deal with the floating loss and each day a different one will be best, you wont know which and it could be all 3 will work or none, this is trading, nothing is certain.
- You can wait until the end of the trading day/session and the EA will simply close the open trades for you. If price has pulled back you will make a nice profit on the day, if it's rallied further against you there will be a loss on the day, usually larger than the initial hedge you locked in.
- You can use use a "conservative exit" plan where you set an amount you wand to achieve in profit and the EA will get you out IF that amount is reached. This is determined as a percentage of the profit you have banked on the positions that hit TP. So all we are looking for here is for price to pull back a little from where you exited the initial trades and we can close out the losing ones and gain a profit.
- You can use an "aggressive exit" plan. Here we place a pending order in the same direction as your current open drawdown (adding more size to the position) which is called Dollar cost averaging. The idea here is we trail a pending order under the low of each candle until price pushes in our direction and we then get in on that move, hopeing it will be the start of a pullback and we can then exit the losing position much faster with a profit. The is a more aggressive approach and more risky but will work a lot more often than the conservative approach which testing has shown. The major downside is if you enter the additional position you are then open to higher losses if price continues to push against you meaning a bigger losing day.
Which option you choose will depend on your own risk tollerances and I would encourage you to backtest visually and see how each scenario can play out so you are prepared for each.
This is an intraday strategy and the default setting for the EA is to close positions at the end of the day or session, this has been shown in testing to be the best scenario as indices can trend for days and gap so it's not advisable to hold overnight but the option to do so is built into the EA.
WHY HEDGING AND NOT TRADITIONAL STOP LOSSES?
Hedging stops traders over-trading when they are wrong with trades and get stopped out, which is one of the biggest causes for traders failing. By hedging, you are buying time for the market to make up it's mind as to direction, which gives you a second chance to make a profit once the session's move is underway. It ensures you do not revenge trade as you are only in one position on each instrument each trading session/day. This strategy ensures on clean break days (around 35% of the time) you just get in and out and are done for the session within around 15-30 minutes typically. On range bound days, you are forced to wait for the market to decide a direction before looking for a level to exit on a bounce, ensuring over-trading is kept to a minimum or eliminated completely. This style of trading can make traders much more comfortable and help them feel more in control. You only need 1 trade per day with a positive risk:reward ratio to be successful. People often fail because they trade too much and with too much size when things are going wrong, as a hedge trader you cannot do that and it helps you see the whole market movement each session on the instruments you are trading.
TO FULL AUTO TRADE OR INTERVENE, THAT IS THE QUESTION!
The EA can be used on full auto and which of course is what it's designed to do, trade for you. However in my experience traders usually get a better result when intervening with an EA that is auto trading for them for a number of reasons. All EAs will be setup to perform a specific set of tasks in a set order when certain things happen on a chart. However traders will see things repeating over and over that you just cannot teach an EA to identify as there are too many things that happen on a daily basis while trading that any EA could realistically take into account and make an educated decision about.
Stock market indices often bounces from daily levels, previous days levels or get exhausted at the average daily range of the index being traded, so these levels are drawn on the chart automatically, so you can easily identify where price may be heading before bouncing. After trading this strategy for a while you will often see bounces at these levels regularly as large market participants place limit orders at these levels to buy or sell when reached in an attempt to either continue or reverse a move. This has been happening for decades and will continue to do so, more now with more automated trading by banks and institutions.
If you get into a hedge trade with the EA you can easily adjust the TP levels to match these areas and if they work you will find you get a much higher success rate exiting the hedge trades than leaving the EA to just "hope" price moves your your second TP level. Remember, we are not necessarily looking for price to REVERSE to get out of a hedge position, we only need a BOUNCE larger than the initial range we traded to get out at breakeven. So, even if price only "bounces" at a daily level and then turns and breaks through it that "bounce" is often enough to get us out of our hedge with a profit and walk away from a potentially losing day with a breakeven or win.
You will also want to keep an eye on other major support and resistance levels like weekly zones or large bank orders which can be identified by impule or propulsion moves. You can use the support, resistance propulsion indicator to identify these automatically if you wish.
INITIAL SETUP & FINDING THE TIME INPUTS FOR THE STOCK INDEX HEDGE EA:
The EA should be placed on the M5 timeframe on any stock index such as the DAX, NASDAQ, DOW, S&P500 etc..... You need to input a number of times into the EA inputs initially so it knows when to do certain things.
These are the inputs we'll cover in this part and all MUST be in 00:00 format using 4 digits and a colon to seperate hours and minutes:
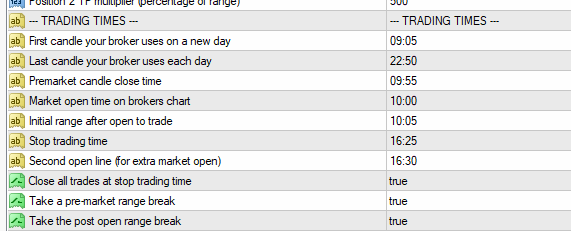
(example above is for Roboforex broker and the German DAX index)
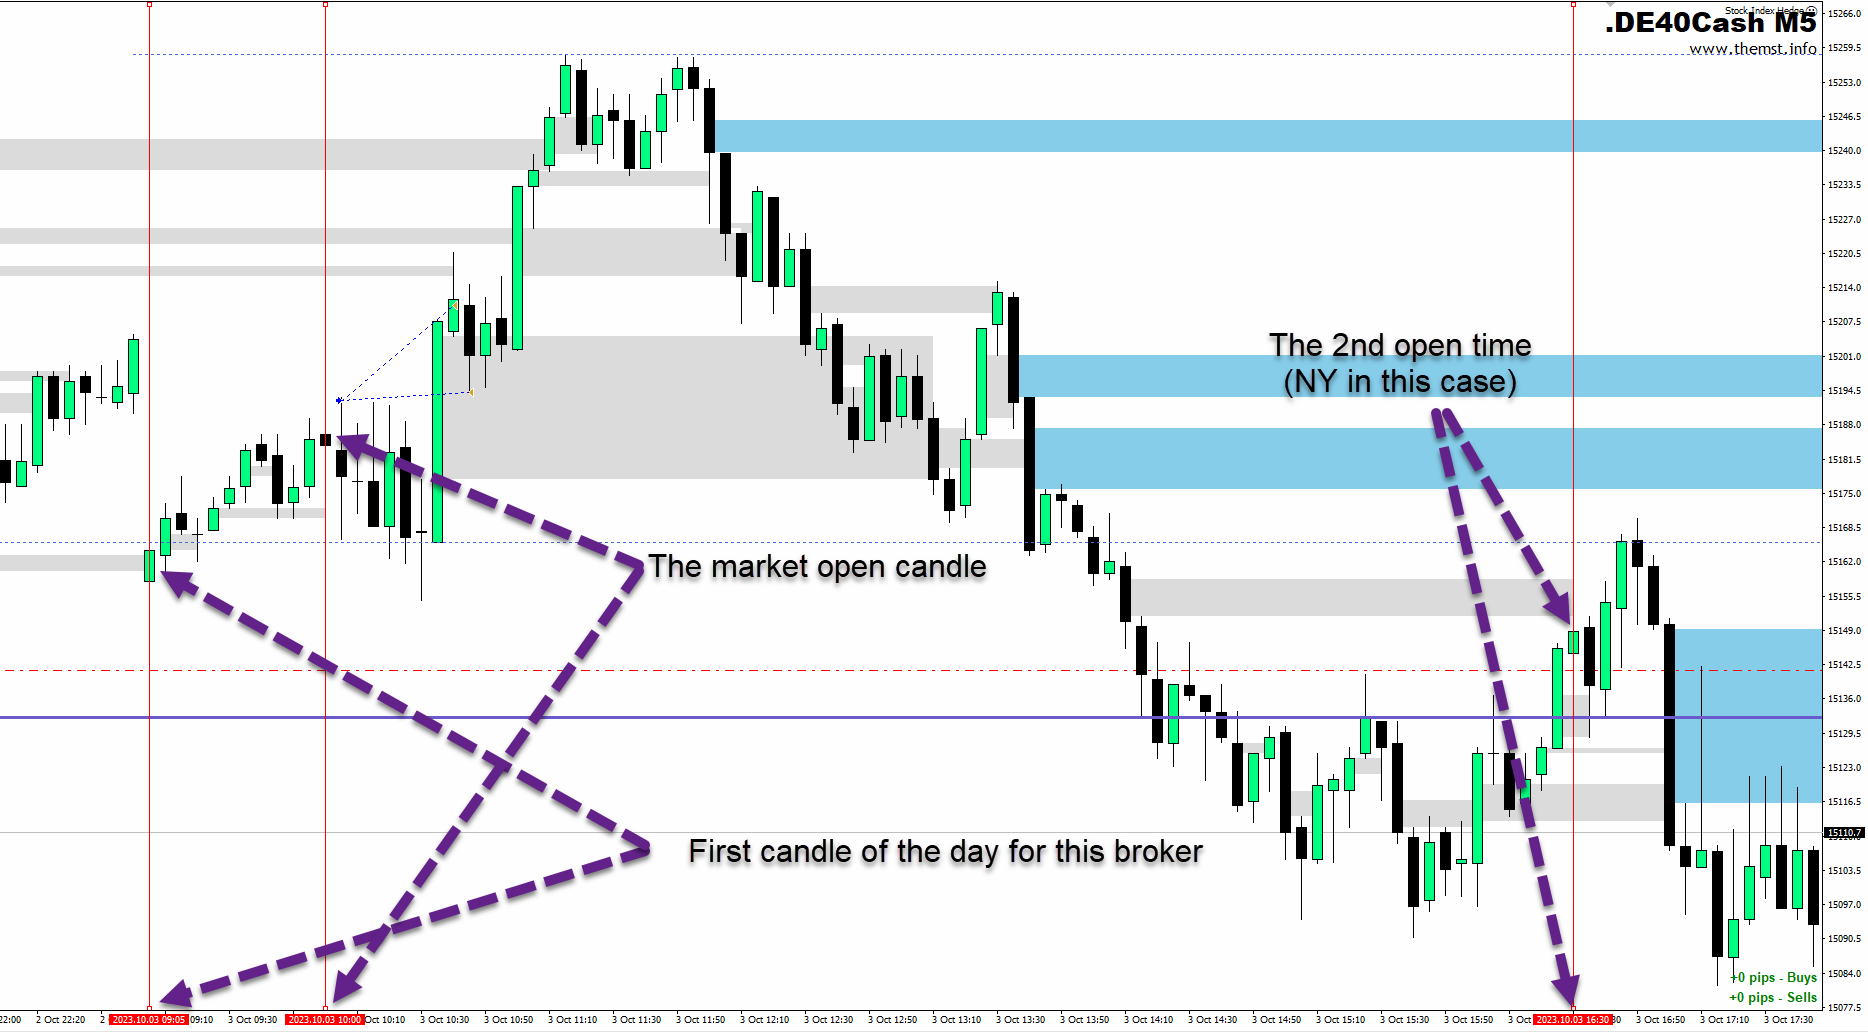
First candle your broker uses - This is the first M5 candle on your chart. This is used to draw the horizontal lines on your chart from the open of the day.
Last candle your broker uses - This is when the EA takes a screenshot if you are using that feature.
Premarket candle close time - This is the last candle before the market open on your chart. This is used to analyse the pre market movement and see if there is a compatible range to take for a pre-market break.
Market open time - This is the candle at the market open or the time the market you are trading opens. This is what we use if there is no premarket range to trade or if you have chosen not to trade premarket in the settings.
Initial range after open to trade - This must be the 5 minute candle that closes at the open. It will always be 5 minutes after the market open time.
Stop trading time - This is the time the EA will close your positions and you would typically set this to the end of the day candle or just before the open of the next session in the case of the DAX.
Second open line - This draws in another vertical line at the open of another index if required. Typically used when trading the DAX so you can see the open of the US indices also on the chart, handy for the screenshot feature. Set to the same as the open if you dont want to see it.
Finding the open for Frankfurt and New York:
The EA was developed to trade the open of the Frankfurt and New York stock exchanges so you need to tell it when these times are. As brokers candle close times wil vary you will need to work this out and it can be tricky but there is a very simple way to do this using volume.
If you are using the EA to trade the Frankfurt open that is at 9am (8am GMT), the New York open is 9:30am (14:30pm GMT). Your brokers candles however will likely not be those times. For example with the broker Roboforex who uses UTC+2 candles (which the majority of brokers now do) will have the open in Frankfurt at 10:00 and New York at 16:30.
So lets use volume to confirm we've got the right open time.
First open the instument you want to trade like the DAX, DOW, NASDAQ etc....
Then right click on the chart and make sure you have volume checked in the common properties tab as shown below.
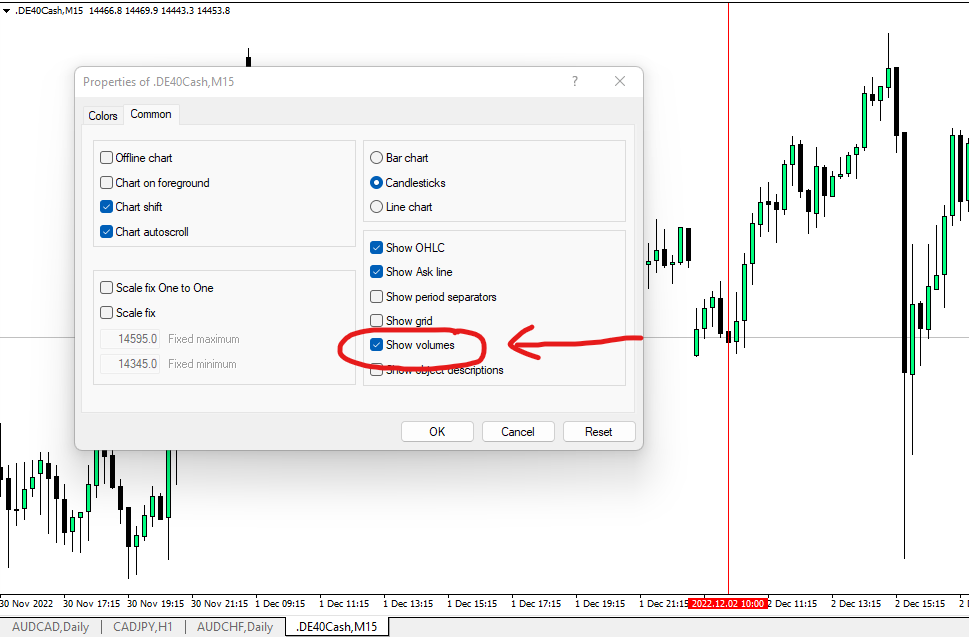
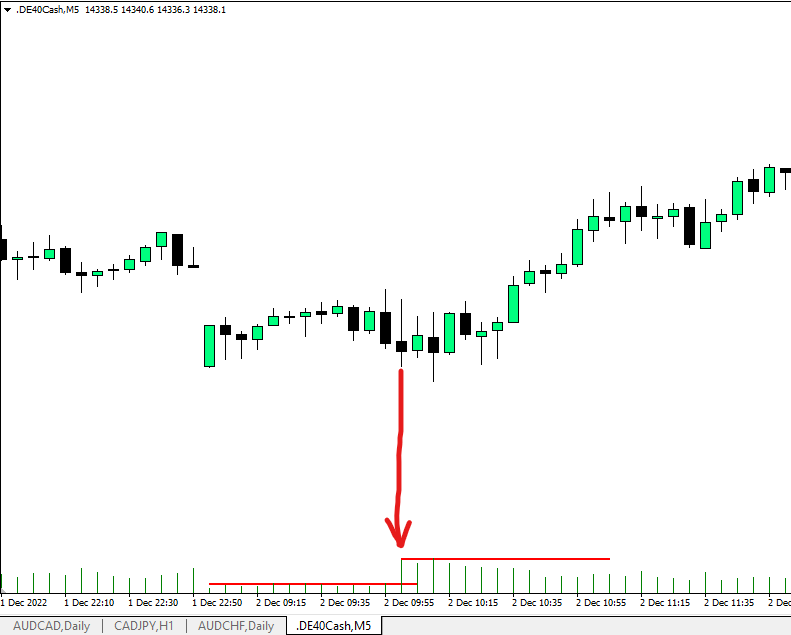
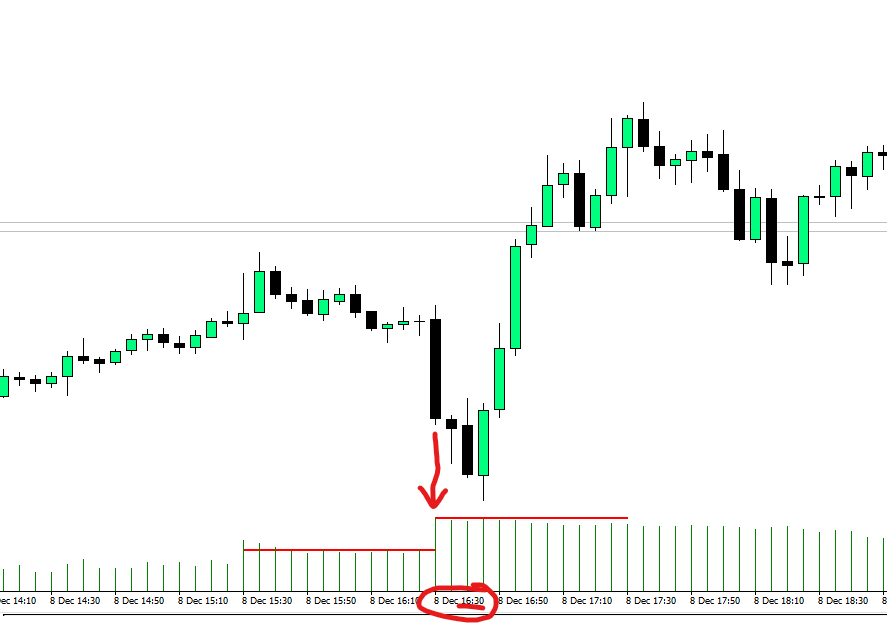
Now you will see the volume from your broker shown on the bottom of the chart. You can clearly see at 10:00am on the DAX index on my brokers chart that the volume doubles and is often even larger.
Likewise on the US indices like the NASDAQ in the example below you will see a substantial increase in volume at 16:30 on the chart which is 2:30pm UK (9:30am NY).
This is the open.
INPUTS FOR THE EA:
Here I'll detail every input and what impact it has on trading activity. I would strongly recommend you put the EA in the visual backtest, play with these settings and see for yourself what happens. How YOU PERSONALLY want the EA to trade to help with either your personal account or passing a prop firm evaluation will differ from the next trader so set it to trade how YOU want it by seeing how it works.
INPUTS:
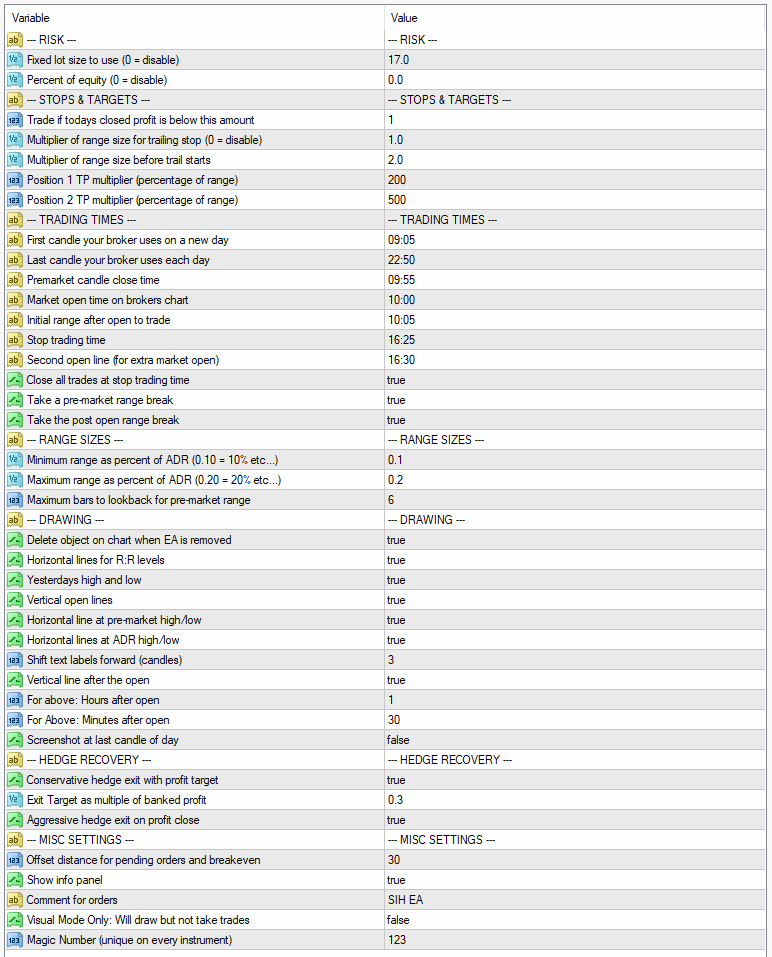
--- RISK ---
These settings are for each trade taken by the EA not the total. The EA takes 2 trades in each direction so this needs to be taken into account when setting these.
Fixed lot size to use - Set the lot size the EA will use to take all trades. Set to 0 if you dont want to use fixed lots.
Percent of equity - Set the risk as a percentage of your account equity. The risk is based off the stop being at the opposite end of the range you are trading so will vary each session. Set to 0 if you dont want to use fixed lots.
--- STOPS & TARGETS ---
Trade if todays closed profit is below this amount - You can set a target to reach for the day here for this instrument. This is defaulted to 1 and advised not to change it. This would only be used if you wanted to have the EA take more than one trade on an instrument per day by adjusting the times to trade another range. Leave at 1 for best performance.
Multiplier of range size for trailing stop - This is how far you want to trail the stop loss. It works in multiples of the range size being traded. e.g. if the range is 50 your trailer will be 50 and so on. Set to 0 to disable trailing stops.
Multiplier of range size before trail starts - This is when your trailing stop will kick in. e.g. when price hits 2R from the break you can start to trail. 2.0 would be 2X the range. A good practice here is to set this to the target for TP1. e.g. if you target 2R start trailing at 2R.
Position 1 TP (percentage of range) - Take profit for the first entry. This is a percentage of the range being traded. These will equate to the R levels drawn on the chart by the EA. e.g. 2R = 200, 3R = 300 and so on. This will take into account your offset also.
Position 2 TP (percentage of range) - As above, this is the target for the 2nd entry. The runner trade. This is also the level all TPs get adjusted to if your position gets hedged so ideally you should always have this higher than the initial target but not too far.
--- TRADING TIMES ---
THIS HAS BEEN COVERED FURTHER UP THE DOCUMENT IN THE INITIAL SETUP
There are 3 inputs here that are not times to be entered which are:
Close all trades at stop trading time - If set to true the EA will close the trades open regardless of profit or loss at the time you have specified. Usually end of trading session (just before NY open if trading European indices) or just before the end of the day.
Take pre-market range break - If true the EA will look for a range before the market open to trade and take that. If there is no range within the set perameters it will then move on to try and trade the post market range (the opening 5 minutes).
Take the post market range break - If true the EA will take a trade of the opening 5 minute range.
--- RANGE SIZES ---
Minimum range as percentage of ADR - Enter as a percentage of the ADR10 (average daily range) figure and the pre-market and opening range must be above this for the EA to place a pending order to trade.
Maximum range as percentage of ADR - As above but this is the maximum the range can be for the EA to take a trade.
Maximum bars to lookback for pre-market range - The number of bars the EA will look back in time for the pre-market range to be formed. e.g. it will start at the last bar if that is too big or small it will look at the range of the last bar and the one before it and so on. Up to the maximum you se here. So as we trade the M5 chart an entry here of 6 will be 6 X 5 minute candles before the open.
--- DRAWING ---
Delete object on chart when EA is removed - When the EA is removed all drawing items will be deleted if set to true.
Horizontal lines for R:R levels - Draws in the 1R, 2R etc lines to show multiples of the range the EA will target.
Yesterdays high/low - Draws in yesyerdays highs and lows which can be used as support/resistance targets.
Vertical open lines - Draws in the open lines at market open so you can see where the open occurred. Useful for analysis of screenshots.
Horizontal line at pre-market high/low - Draws a line at the high and low of the day before the market opened. Often these can act as support and resistance levels too, especially during the NY session as these are the automated trading times for the CME Globex system.
Horizontal lines at ADR high/low - Draws in the average daily range high and low of the instrument. Often these areas are where price moves will start to fade as normal daily ranges are being hit or exceeded.
Shift for text labels forward (candles) - How many candles forward to shift the text labels at the horizontal lines.
Vertical line after the open - Draws another vertical line after the session open. Useful for those that look for mid session reversals which can often happen around 1.5-2 hours into a trading session.
For above: Hours after open - The number of hours after the open
For above - minutes after open - The number of minutes after the open.
Screenshot at last candle of day - Takes a screenshot of the chart at the very last candle of the day you specify in the times settings area above.
NOTE: This will be stored in the files folder in one of the following locations which you can access by going to files > open data folder in your terminal:
Live trading - MQL4 > Files
Strategy Tester - tester > Files
--- HEDGE RECOVERY ---
Conservative hedge exit with profit target - If set to true the EA will attempt to get out of a hedge when a pullback happens after one direction is closed. e.g. if the market pushes up to 5R where your targets are for longs and they close it will wait for a pullback which makes your short positions move into profit. The amount is set in the next input.
Exit target as multiple of banked profit - This is entered as a percentage of the closed profit. e.g. 0.3 = 30%. So if your long positions are closed with $1000 profit the EA will wait until the nett profit of your closed long s and open shorts is equal to $300 (30% of $1000) and close out your short positions. If you would like to simply achieve a breakeven day when you get hedged and the market has pushed hard in one direction you could enter 0.01 here and as soon as you have a short position equal to your banked long the EA will close out for breakeven (or there abouts).
Aggressive hedge exit on profit close - This requires the above 2 settings to be active. It will place further pending orders above/below the last closed candle to add to your positions which is in drawdown. This gives you a much faster exit of the position in drawdown and will delete the pendings and replace them if price continues to push against you. It will close out at the same target set in the input above but you will find it will get hit much faster as you are averaging into the losing hedge.
--- MISC SETTINGS ---
Offset distance for pending orders and breakeven - The distance above or below the range where your pending orders will be placed. NOTE: This is measured in pippetes so may be 30 or 300 depending on your broker. Test in the strategy tester to ensure the correct setting. 0 would enter the pending orders at exactly the range high and low.
Show info panel - Displays certain profit and price data on the chart.
Comment for orders - This acts as the title for the info panel and also will be added as a comment to the trade orders placed.
Visual mode only - Setting this to true will make all functionality work as normal but no trades will be taken.
Magic Number - This should be unique for every instance of the EA so it knows which trades to manage. It will only manage trades it has opened with this number. If you want to run multiple versions of the strategy on the same instrument use multiple magic numbers on each instance.


