
- How to download a free trial version and test the performance of the indicator in MT4/MT5.
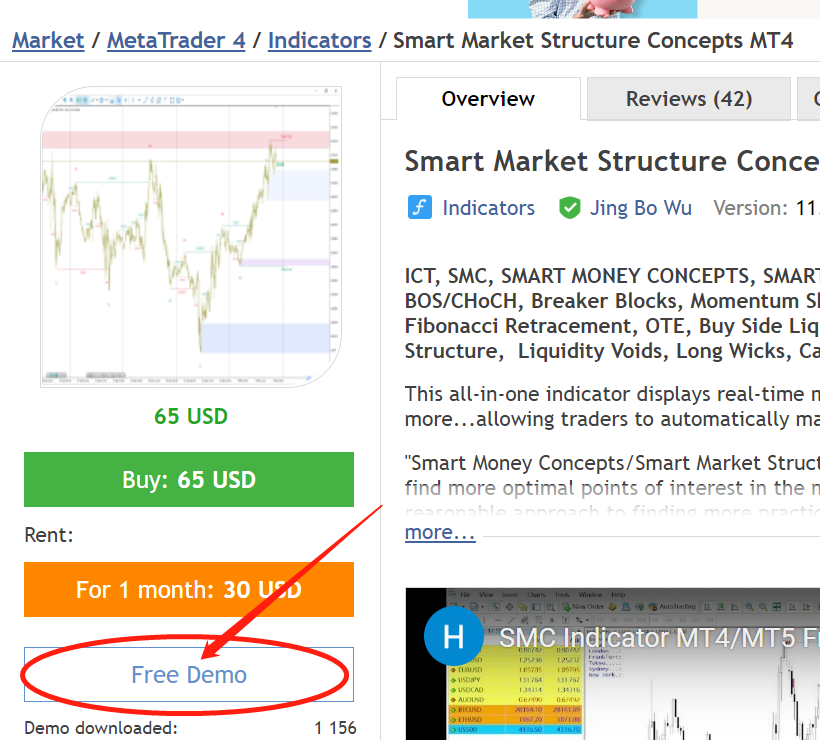
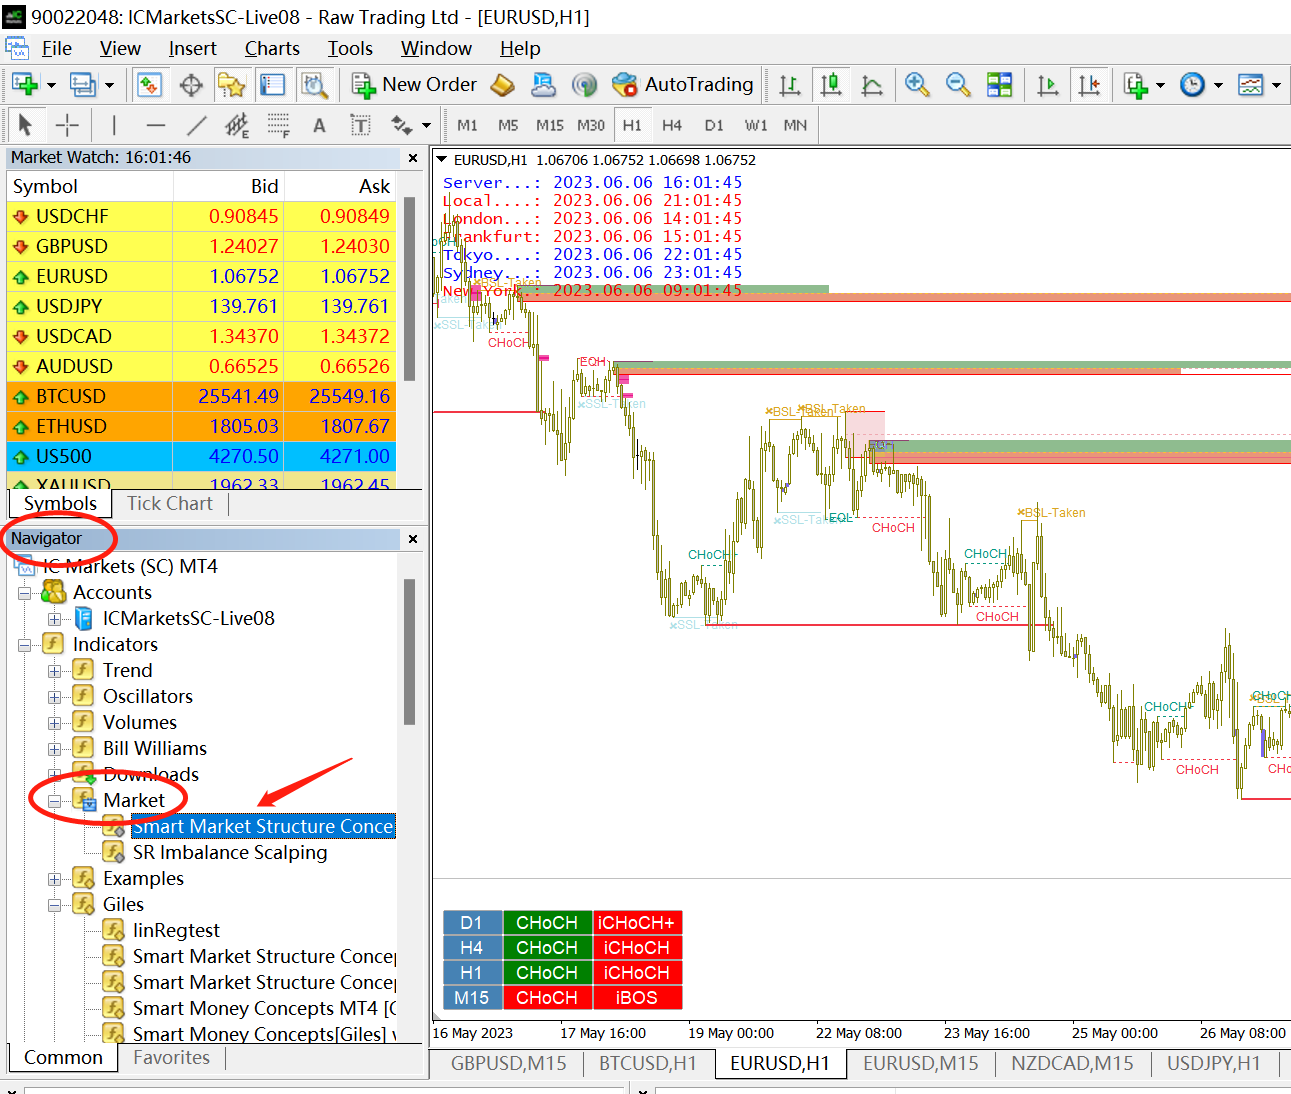
On the indicator page, click the "Free Demo" button to download a free trial version to your MT4/MT5 software. After downloading, under the Indicators directory on the left navigation bar of your MT4/MT5 software, you can see that the indicators have been downloaded to the Market subdirectory, and all indicators downloaded by the MQL market will appear here.
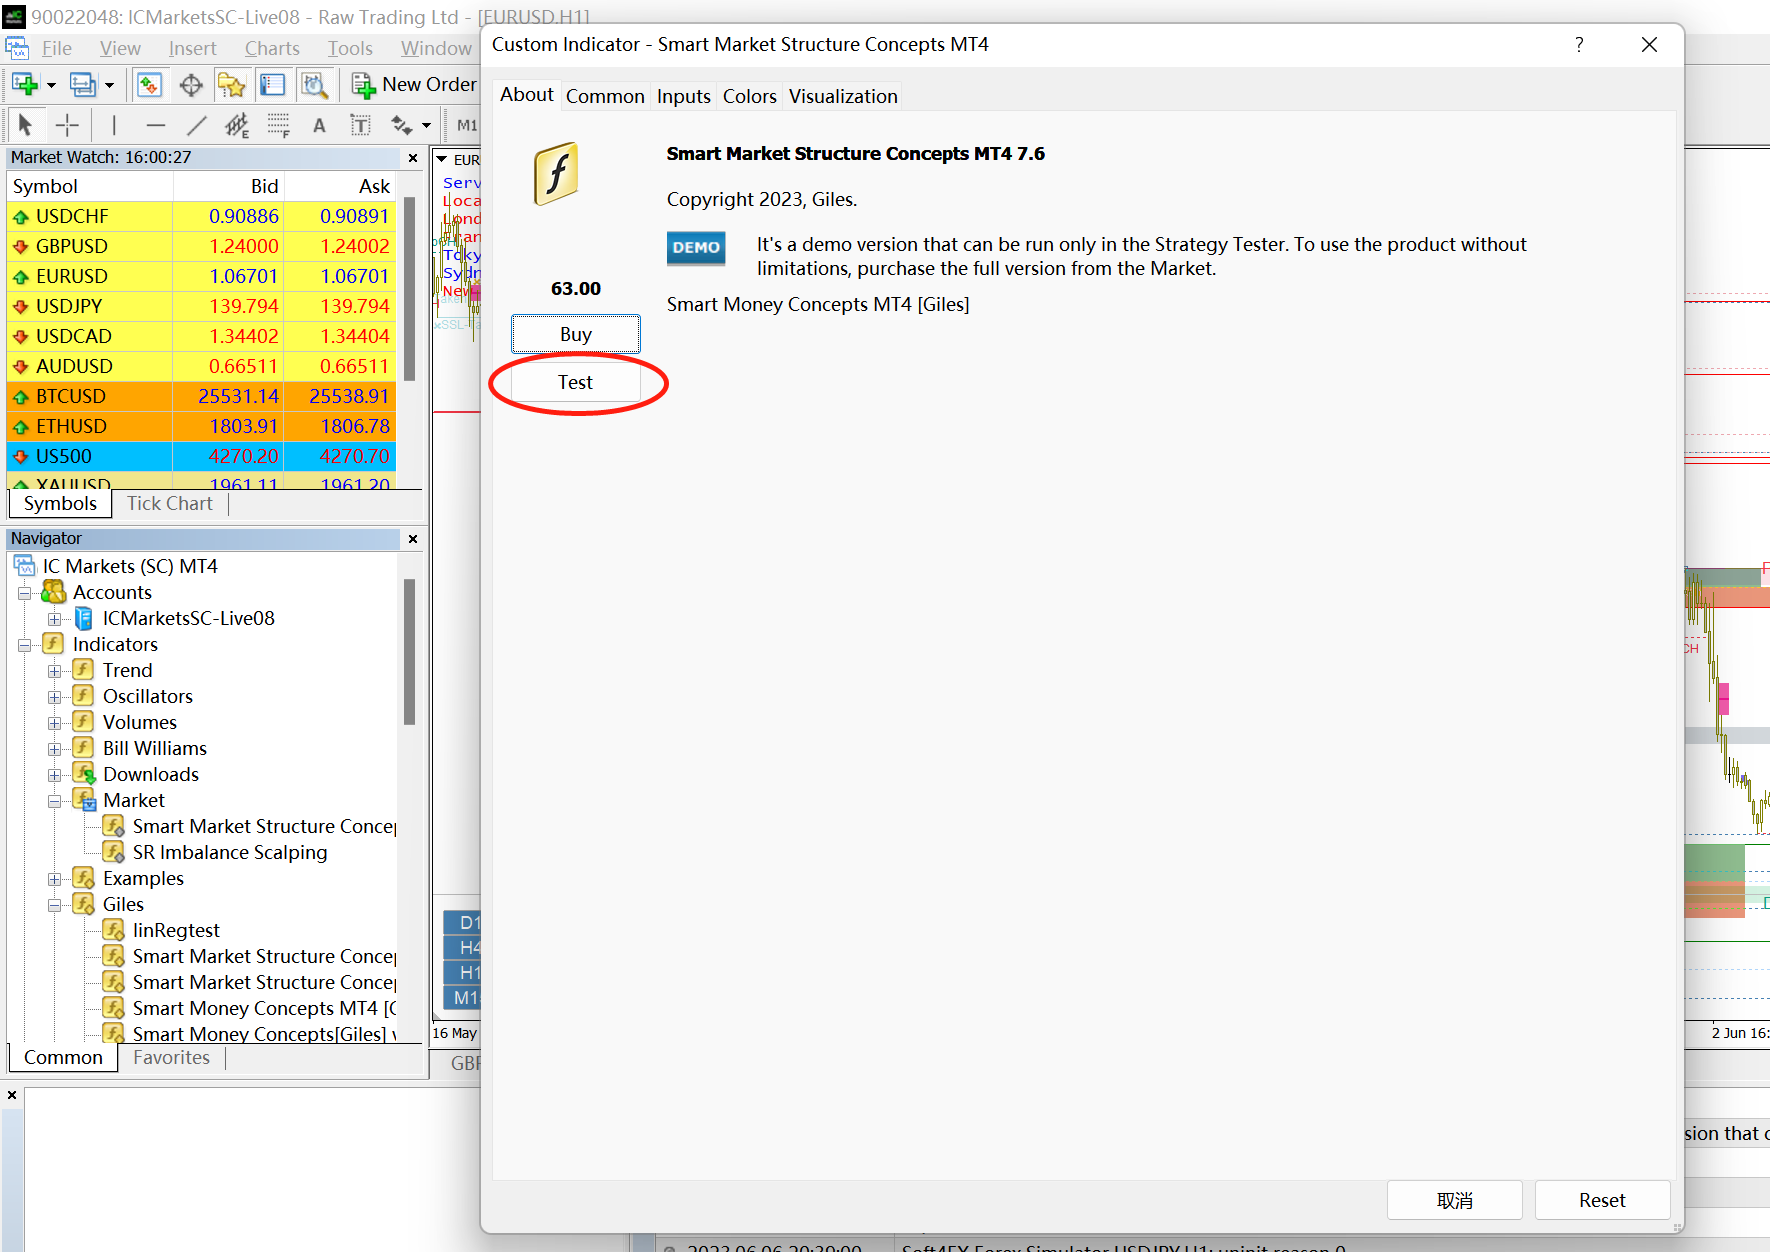
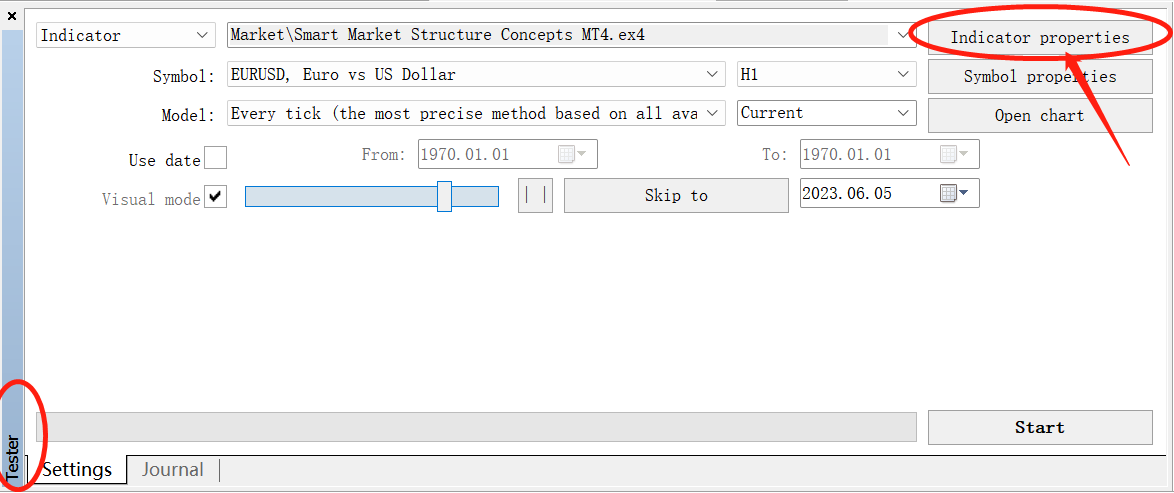
If it is the MT4 version, double-click the indicator name directly, in the pop-up window, click the Test button, and you will see the MT4 Tester window. Here, you can choose the symbol of the test and the cycle of the test. Click Indicator properties to open the indicator setting window and set various parameters of the indicator. After setting the indicator parameters, click the Start button to start the test.
After the test program starts running, we can click Pause and adjust the chart settings to read the chart better. Right-click -> Properties, adjust the parameters you need, OK, click to continue testing. In the MT4 test program, Time Zone Panel and MTF Dashboard cannot work normally.
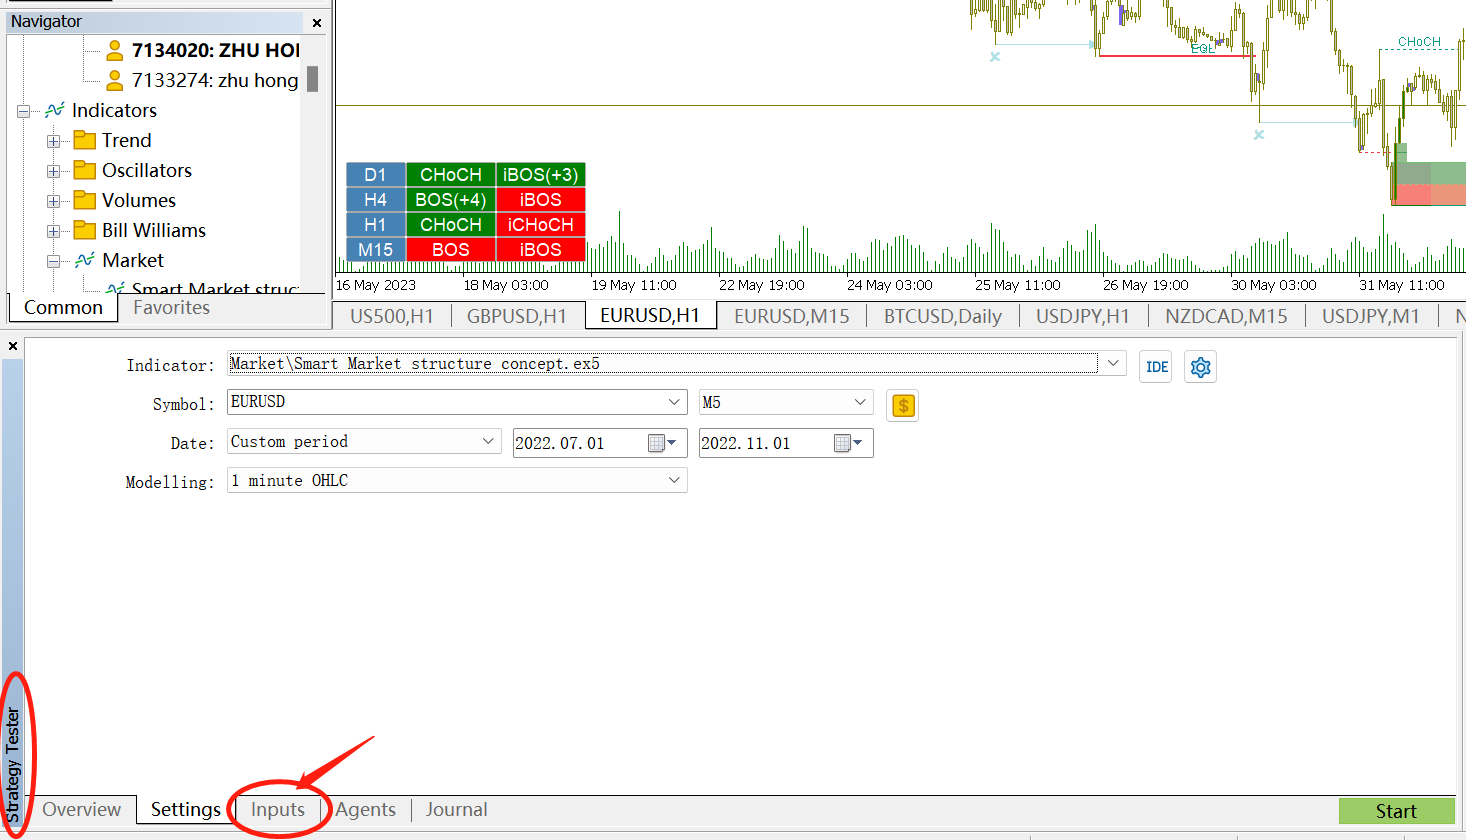
If it is the MT5 version, click on the name of the indicator, right-click, and select Test in the pop-up window, and you will see the Strategy Tester window of the MT5 software. Click Inputs to open the setting page of the indicator, and set various parameters of the indicator. After setting the indicator parameters, click the Start button to start the test.
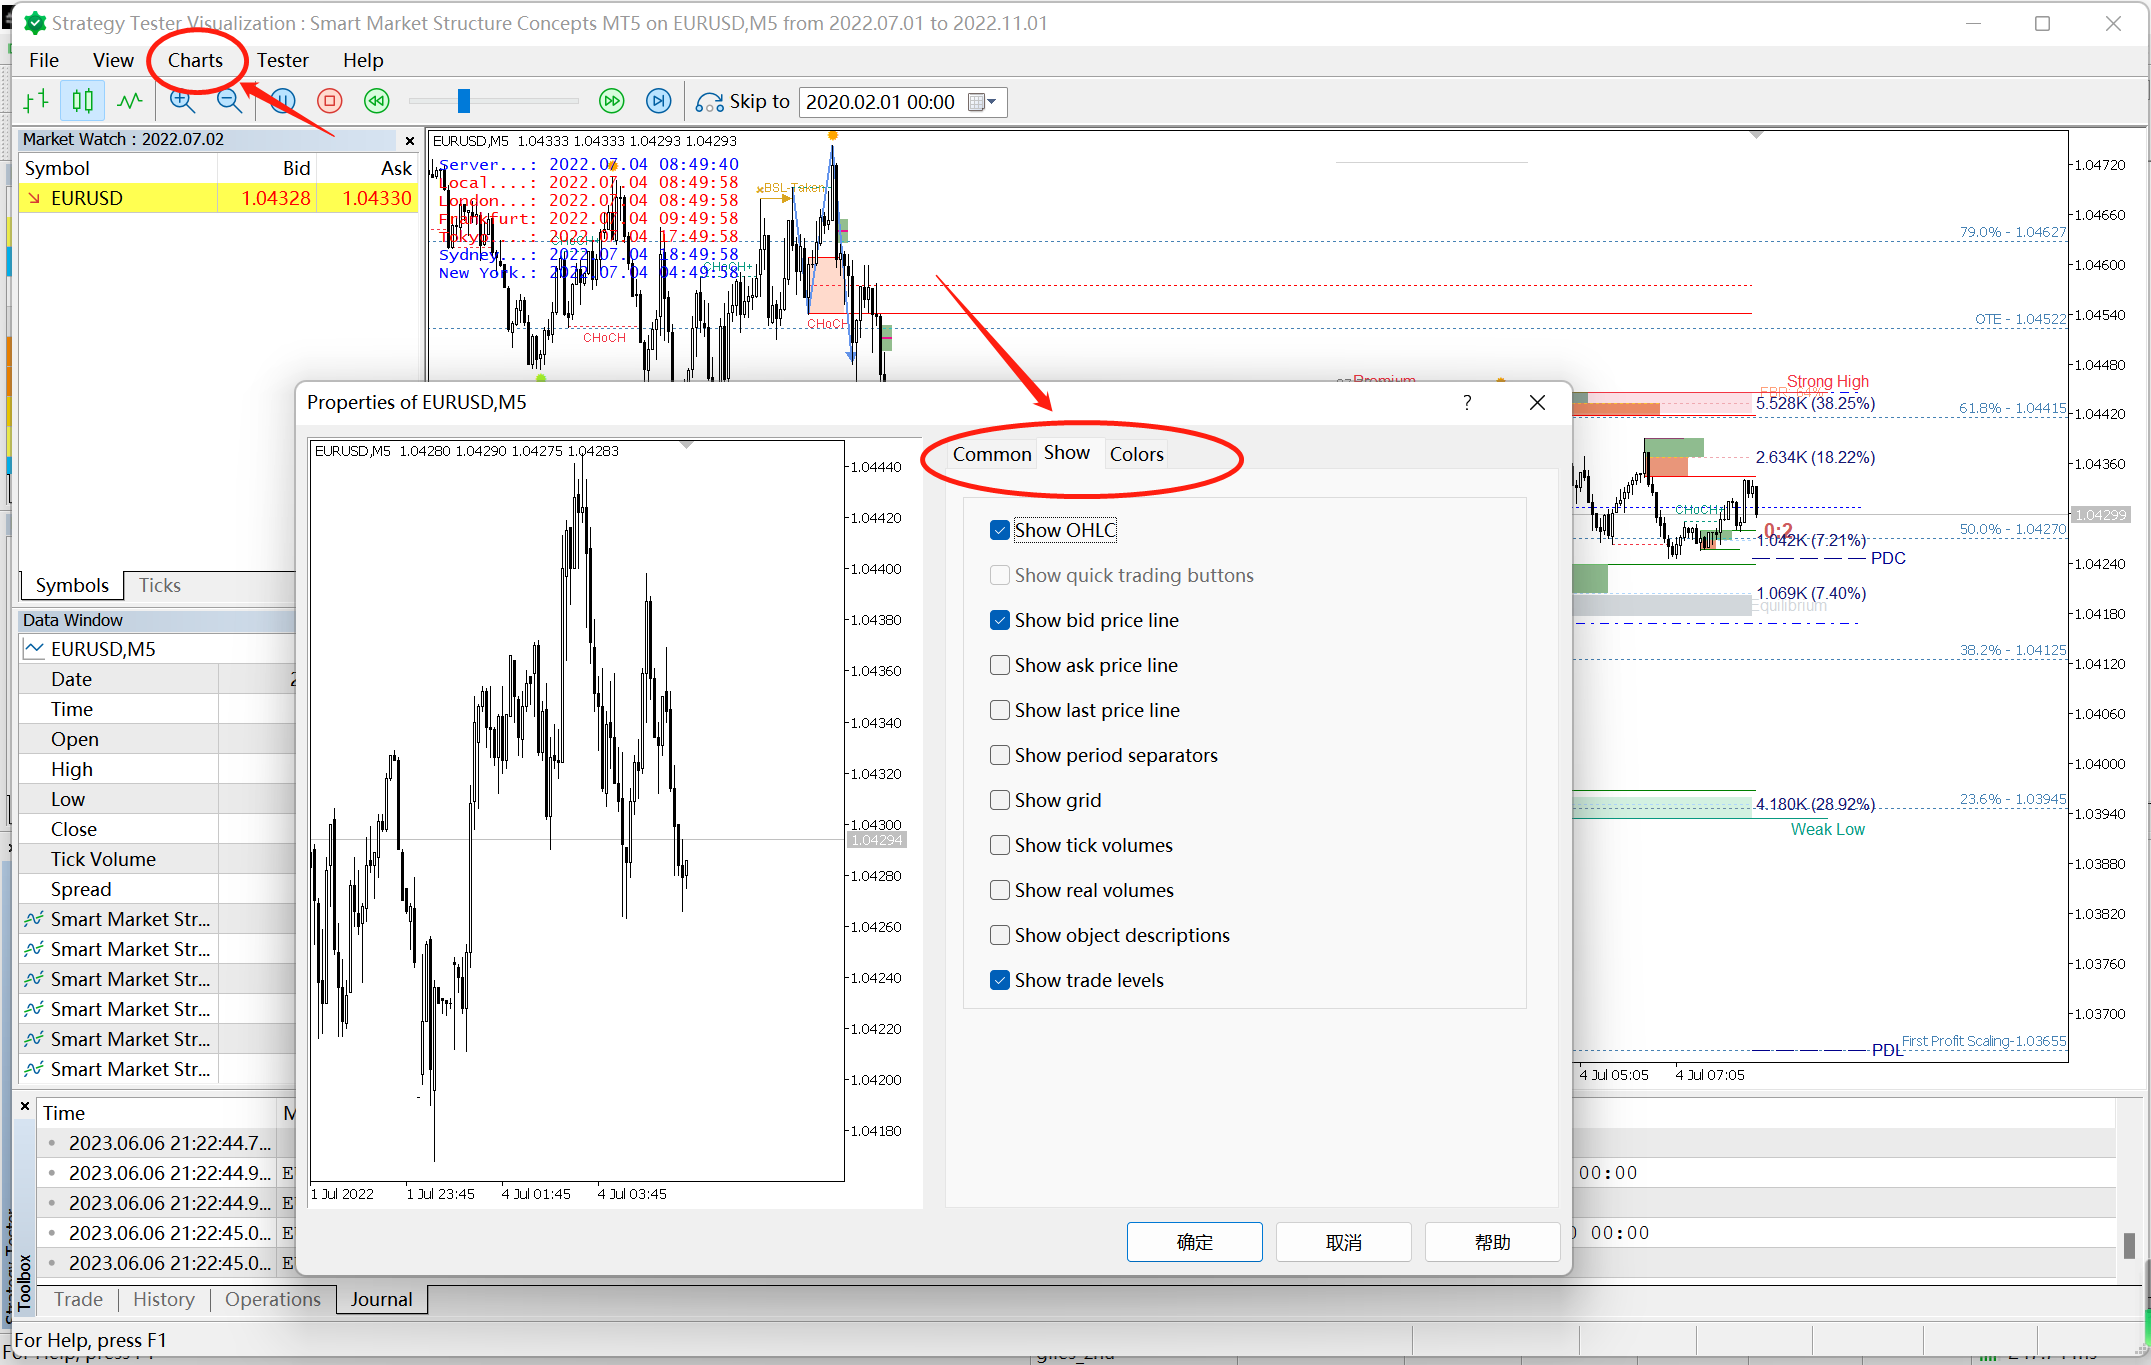
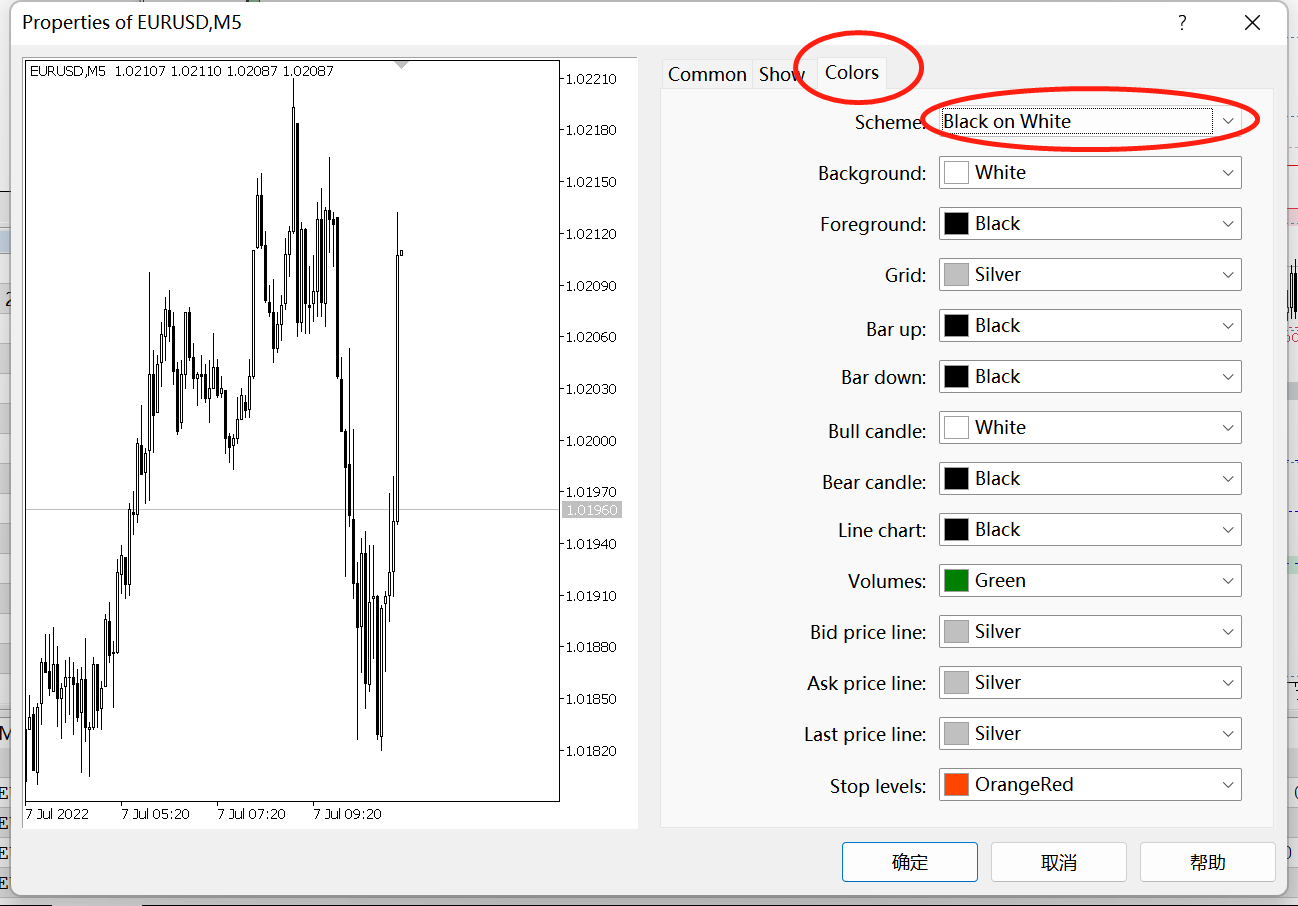
The MT5 software will open a separate test window. You can click the menu bar -->Charts-->Properties to open the test chart property window to modify the chart property parameters for better reading of the chart. It is recommended that users select the Scheme attribute as Black on White under the Colors column.
If you want to adjust the indicator parameters and then check the effect, you must first stop the test program, then set the new parameters, and then start the test again. In the MT5 test program, Time Zone Panel and MTF Dashboard are available.
- Explanation of indicator functions and parameter settings.
1. General Settings
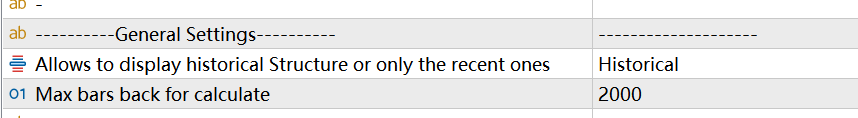
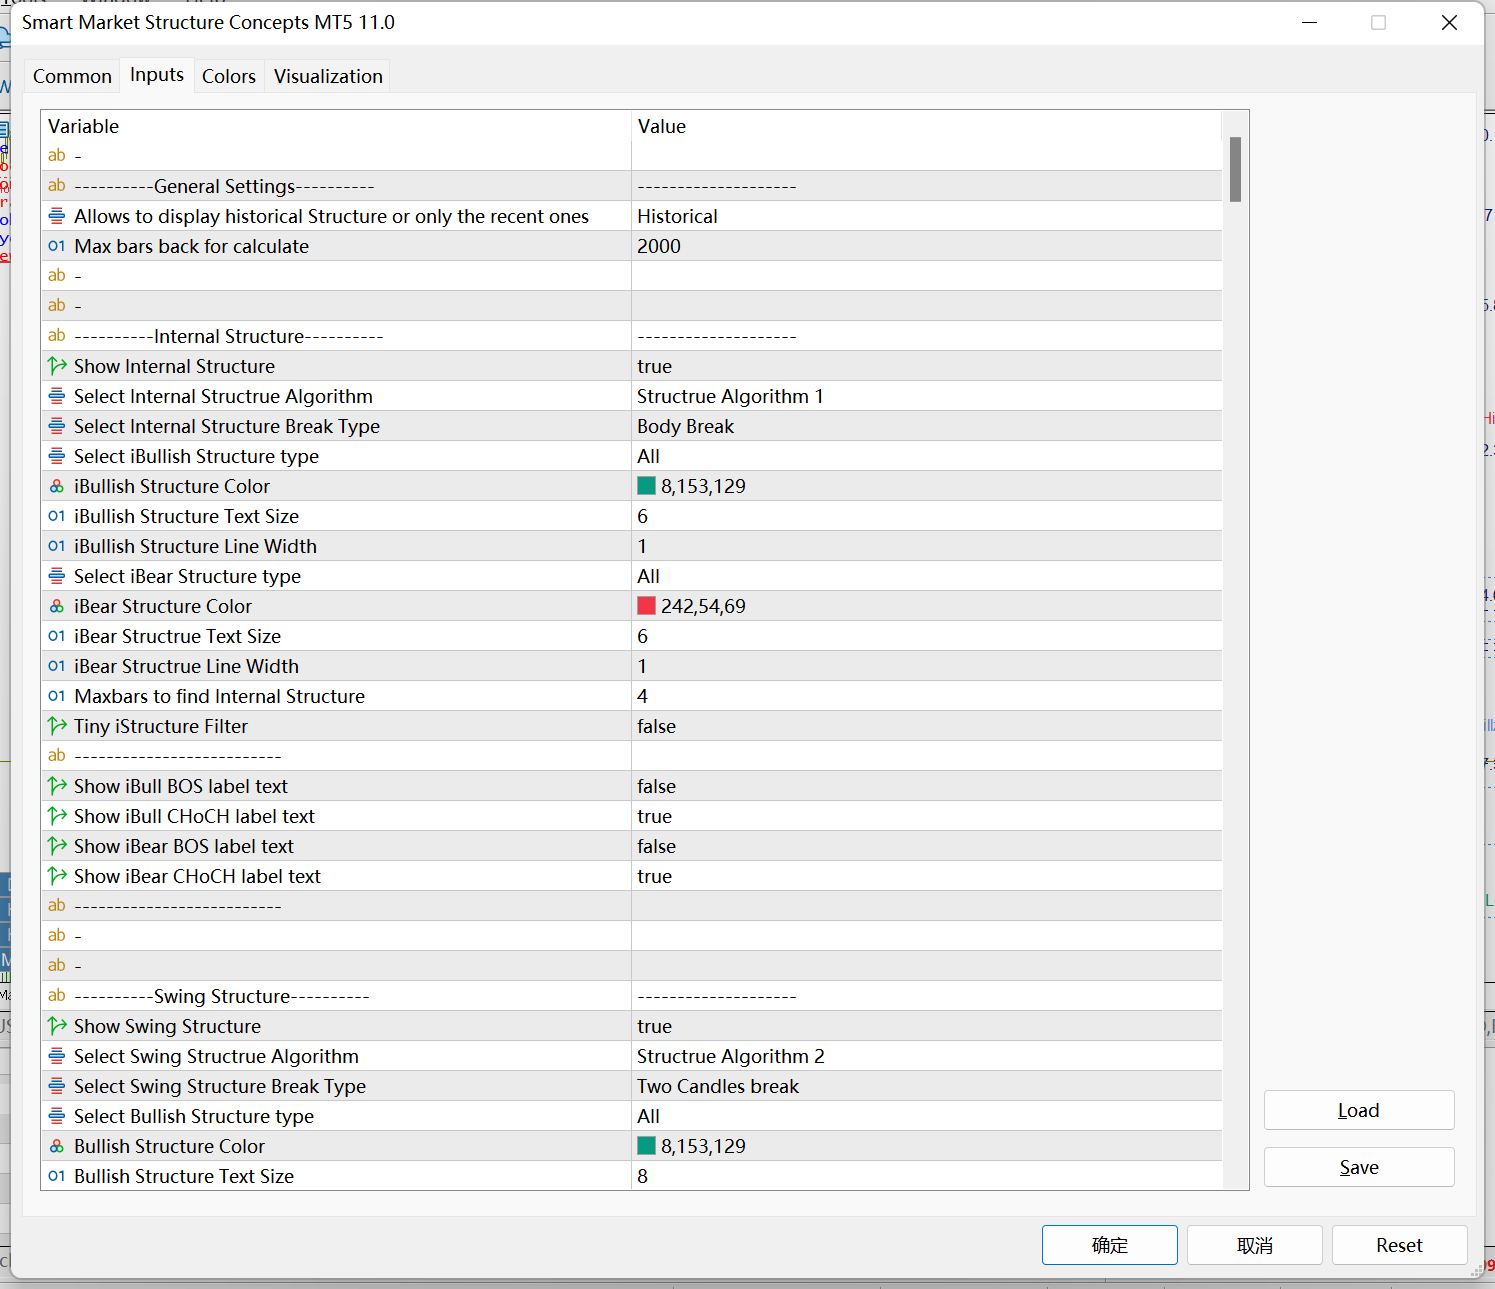
The first setting item has three options. Historical, Present, and Data. By default, historical is selected, and the indicator will be calculated and displayed in historical data. If Present is selected, the indicator is only calculated and displayed in real-time data. The Data option is used internally by the program, and the user does not need to pay attention to it.
The second setting specifies the number of historical candles to be calculated for the program, and the default is 2000. If you need to observe more historical data, set this value higher, but at the same time the indicator loading speed will be slower.
2. Internal Structure and Swing Structure
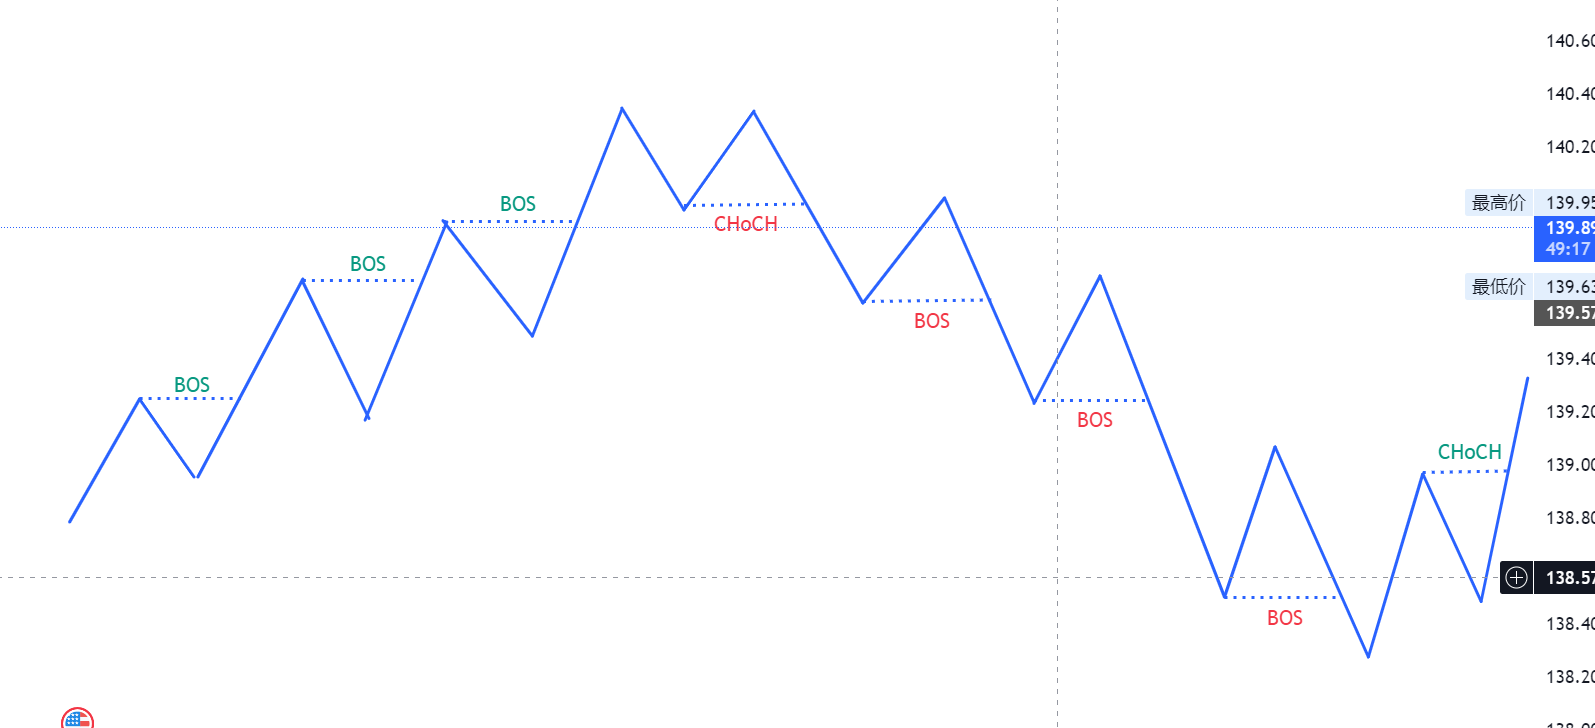
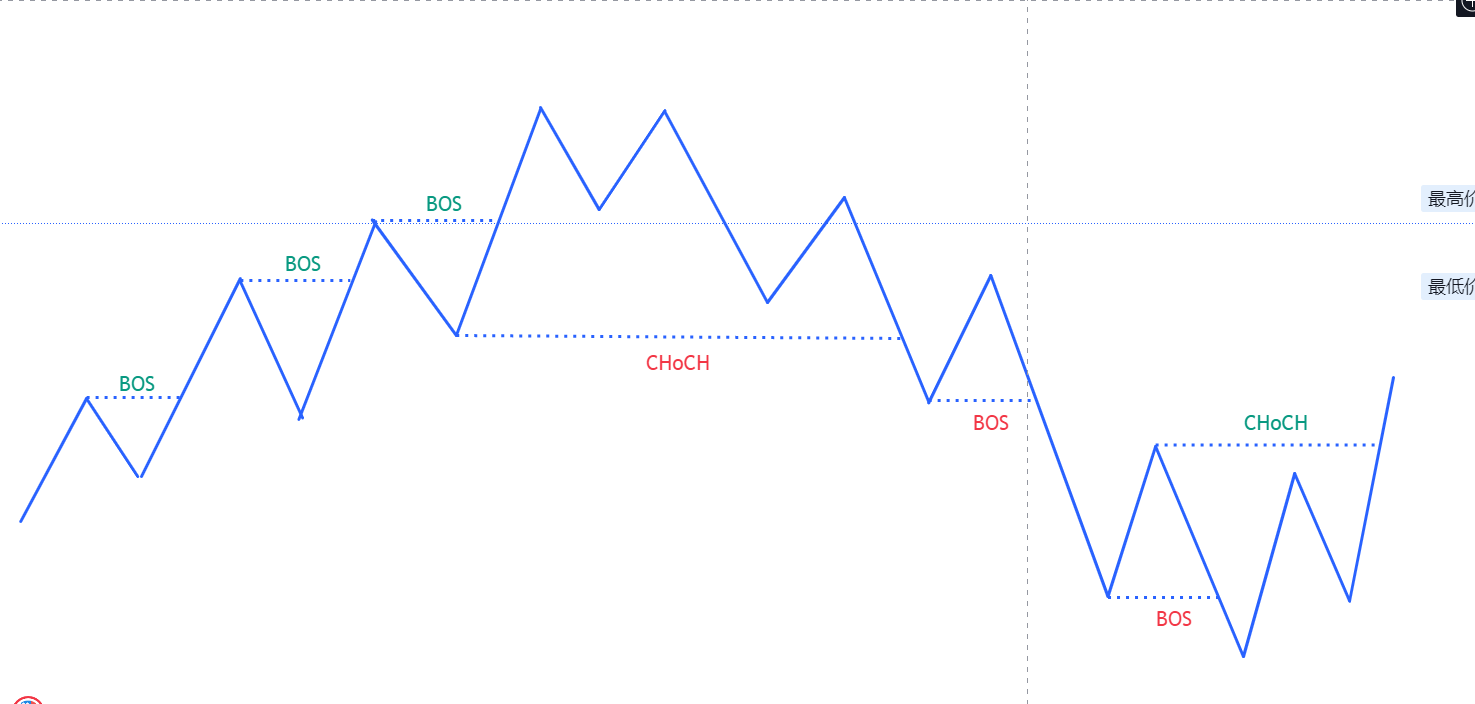
The market structure is generally divided into the main structure and the secondary structure. The main structure marks price fluctuations and structural breakthroughs in a larger period, and the secondary structure marks price fluctuations and structural breakthroughs in a smaller period.
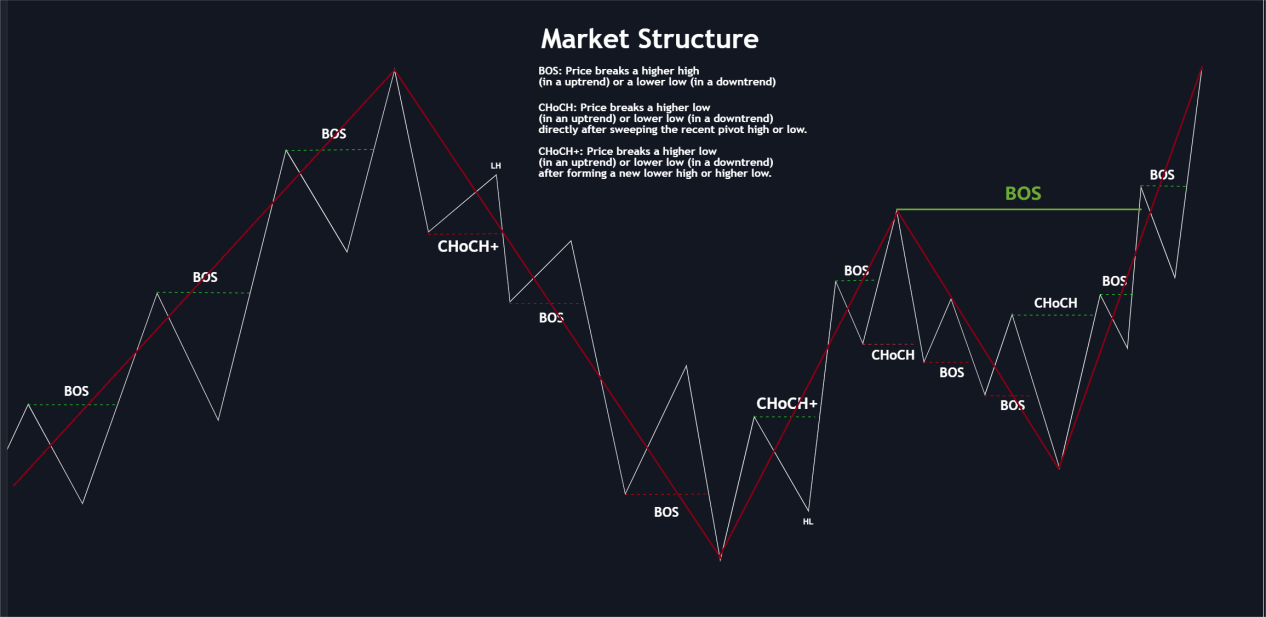
Let's take a look at this market structure chart. The white line shows the secondary structure, that is, the breakthrough of high and low points formed by small cycle price fluctuations, which is defined as internal structure in the indicator. The red line shows the main structure, that is, the breakthrough of high and low points formed by large-cycle price fluctuations, which is defined as swing structure in the indicator.
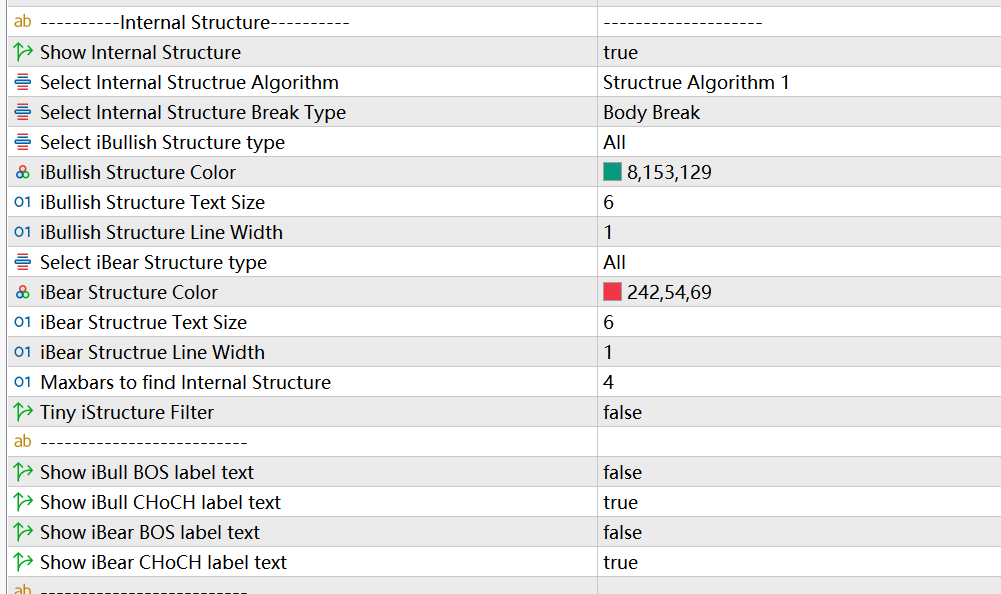
In the setting interface, the value of maxbars for find internal structure determines the number of candles needed to confirm the high and low points of the small period. The default is 4, which means that at least 4 candles are required to confirm the high or low point of a secondary structure. You can set this value yourself according to your own experience or the volatility characteristics of the trading variety.
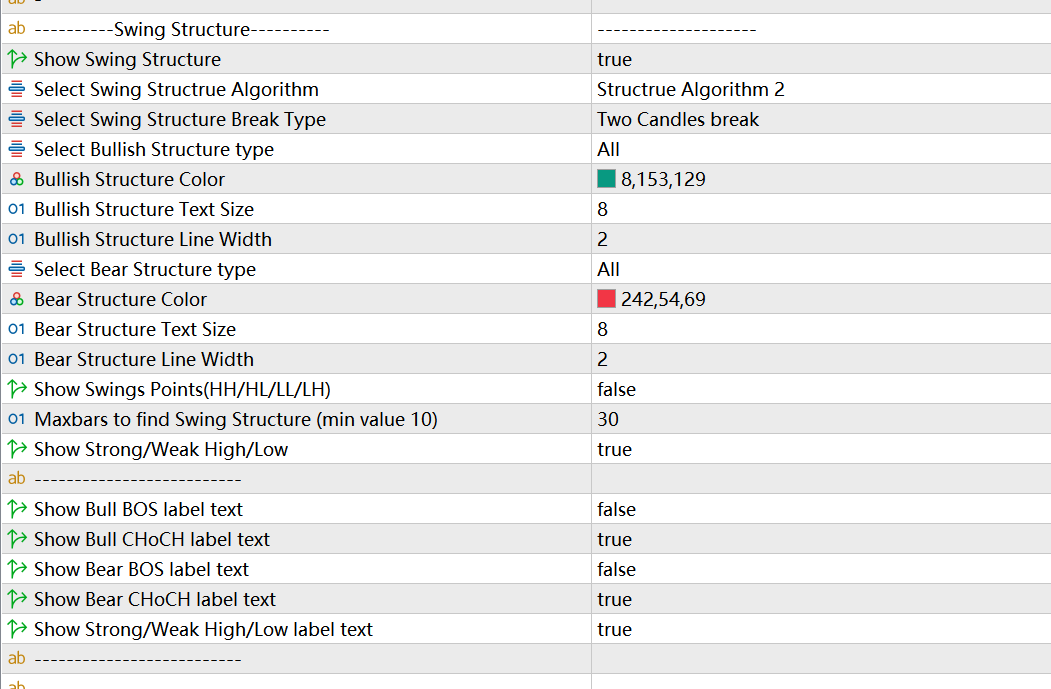
The value of maxbars for find swing structure determines the number of candles needed to determine the high and low points of the main structure. The default is 50, which means that 50 candles are needed to confirm the high or low point of a large period. Again, you can set this value according to your needs. If ALGO2 is selected for the "Select Swing Structrue Algorithm", it is recommended to set the value of maxbars to be smaller, such as between 20-30.
Select Internal/Swing Structrue Algorithm to select the algorithm for the market structure. This program provides two algorithms, and users can choose one of them according to their preferences. The difference between the two algorithms is shown in the following two figures.
ALGO1
ALGO2
In the settings of internal structure and swing structure, there are two important settings, internal structure break type and swing structure break type. At the micro level, there are mainly three situations in which the price breaks through the structure, all of which can be counted as effective breakthroughs. Introduced in the SMC profile available on the indicator's main page. The article mainly introduces three situations: the shadow line breaks through, the shadow line breaks through the shadow line, the entity breaks through the entity, and the entity breaks through.
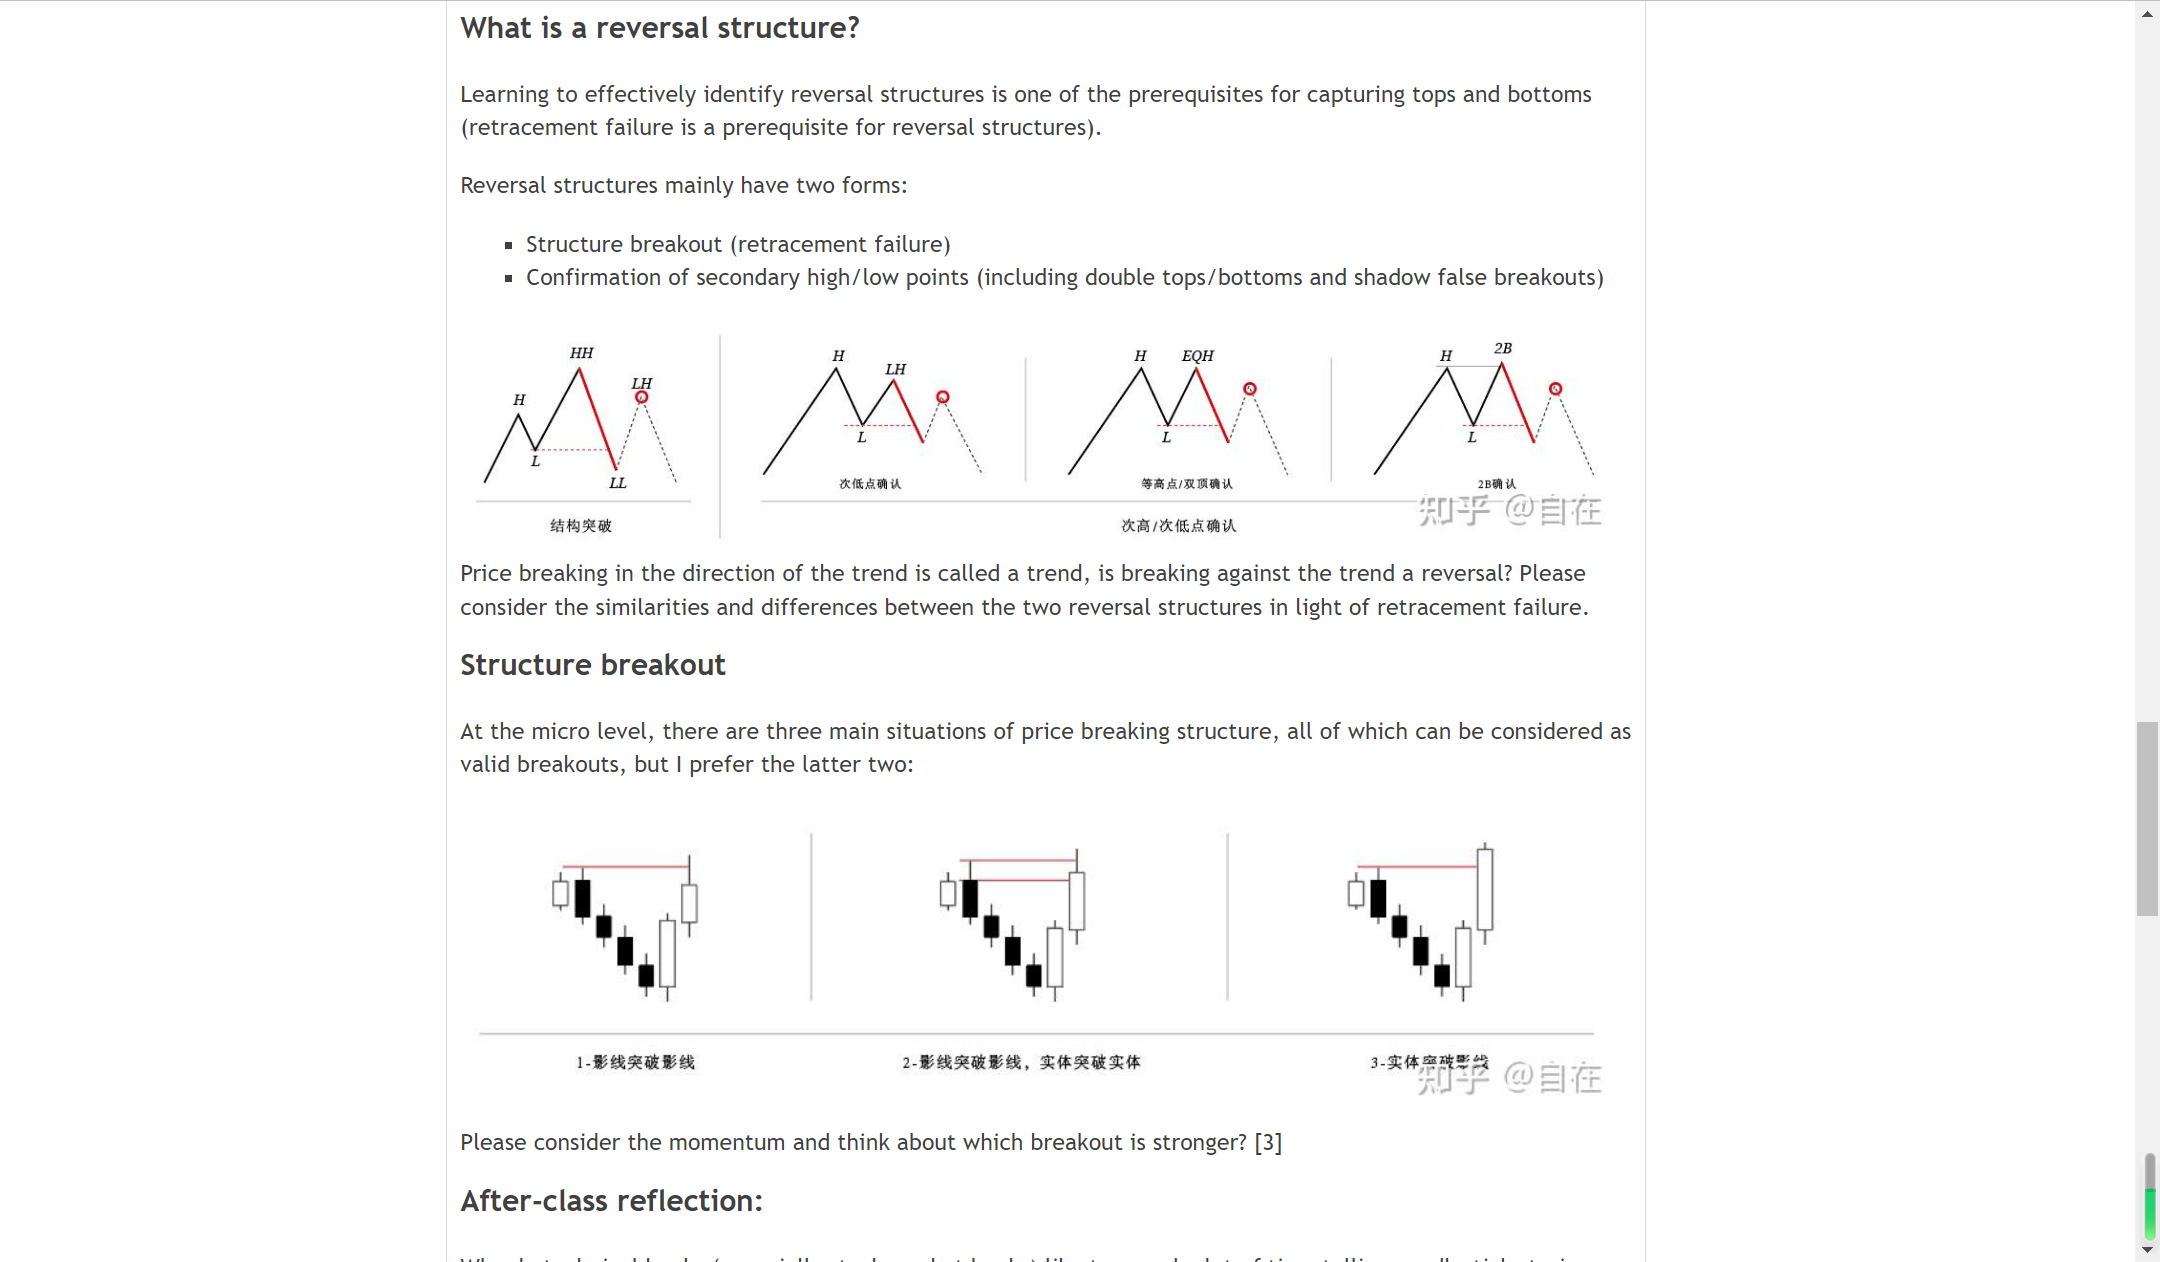
The indicator also provides three types of breakthroughs for selection, shadow line breakthrough, entity breakthrough and double candlestick breakthrough. The program uses entity breakthrough by default, and users can choose the type of breakthrough they need.
The remaining settings are basically display settings, and users can set them according to their preferences.
For example, we can set not to display the internal structure at all, only to display the swing structure, or set to only display the internal structure but not the swing structure.
Or set to display only a certain type of market structure, bullish BOS/CHOCH , bearish BOS/CHoCH .
For experienced traders, they may not want to see too many labels, so the indicator provides a switch to display labels. You can also turn off all tags or choose to only display tags of a certain type that you are particularly concerned about.
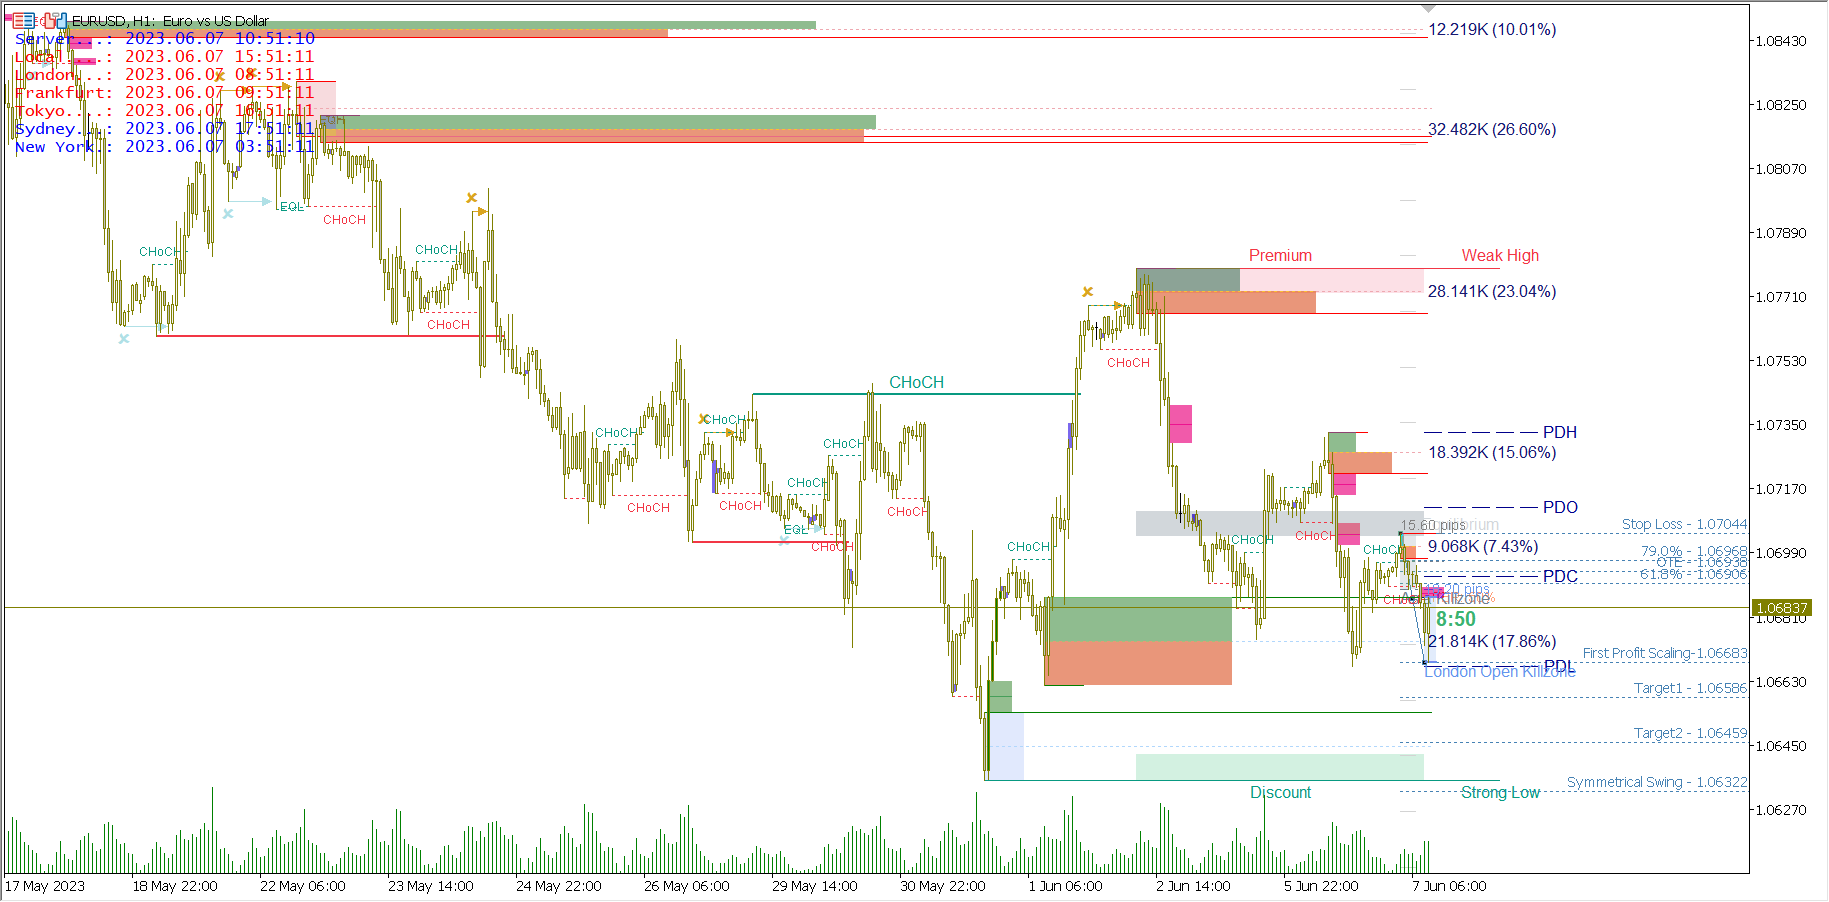
The show swing points setting turns on and off the display of large cycle high and low points ( HH LL HL LH ). The Show strong/weak high/low setting turns on the display of the recent high/low points of the main structure, marked with two lines extending to the current candle, and the high and low points consistent with the large-cycle price trend are marked as strong high/low. Otherwise, mark it as weak high/low.
Finally, I would like to add that in the internal structure setting, the Tiny internal Structrue filter setting is used to filter out the market structure formed by small fluctuations in small periods.
3. Fractal Points and Order Blocks
Below we introduce the two functions of Fractal and OB.
Fractal Points:
It mainly provides users with the function of displaying zigzag lines and fractal points, and can set the time period for zigzag and fractal separately.
Here fractal Points is that the program finds the high and low points of price fluctuations in a given period according to the algorithm, and then marks them with a dot. Usually, there are limit orders and stop loss orders near the previous high/low of the price, which is the so-called liquidity, which is the focus of many traders.
Zigzag uses segment line to connect these high and low points, so that traders have a clearer and more intuitive perspective on price fluctuations, and can avoid the interference of some smaller periodic fluctuations.
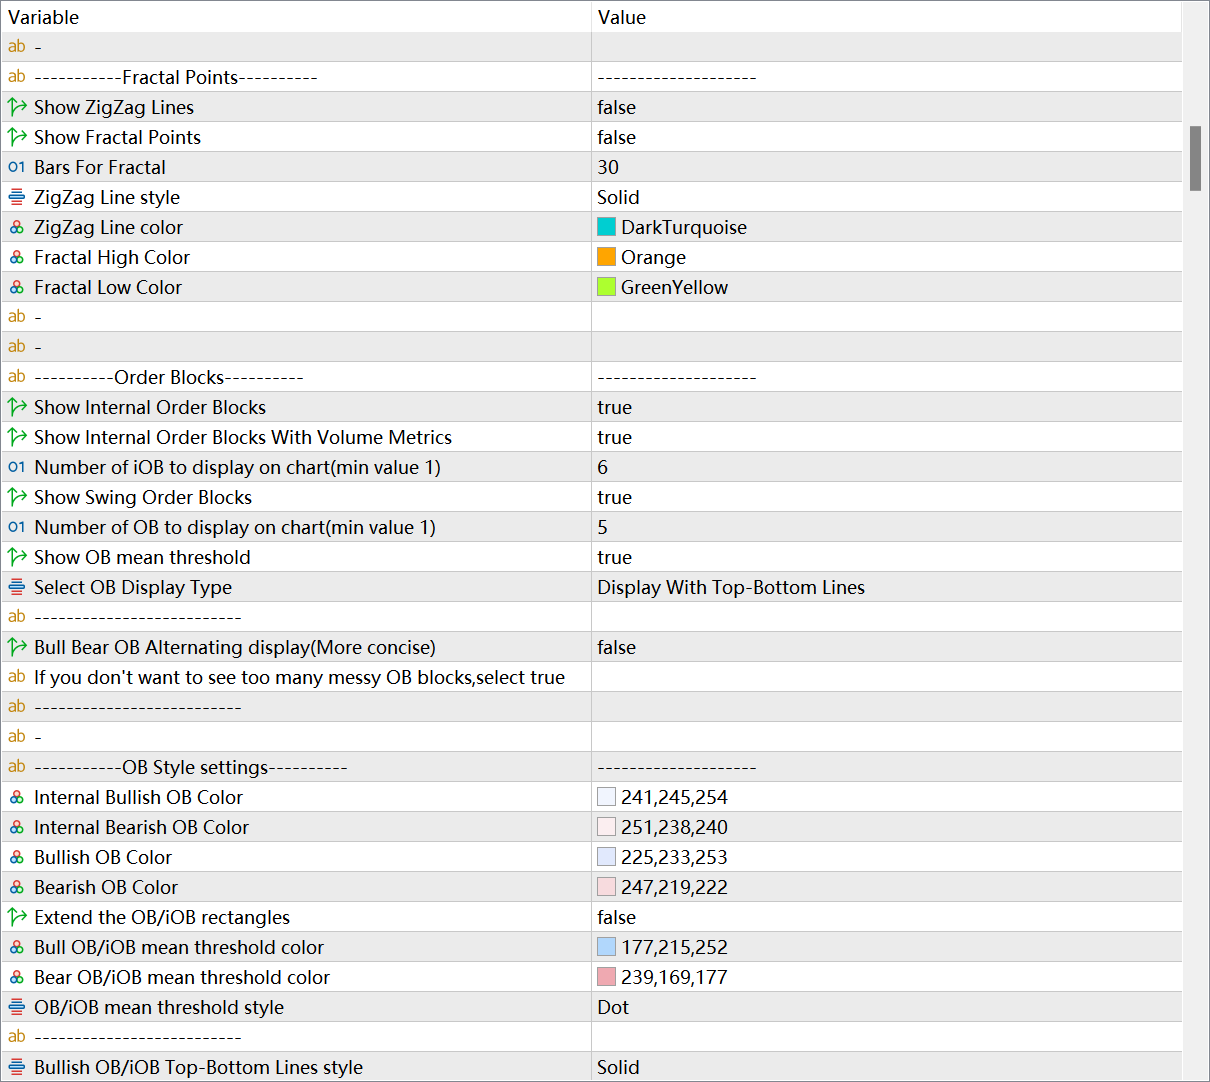
The first setting item is to turn on and off the display of zigzag, the second setting item is to turn on and off the display of fractal points, and the third setting item is to specify the period for the program to calculate the high and low points, which is the number of candles required to confirm the high and low points. The default is 4, if it is changed to 6, and the Timeframe of the current chart is daily, it means that the program will mark the high and low points under the one-week fluctuation period for you.
Below are the formatting for the zigzag, and the formatting for the fractal points.
Order Blocks:
Before introducing the OB settings, we need to briefly introduce the order flow strategy. Here I recommend everyone to read the SMC article I shared on the indicator page, which contains an introduction to the chapter on order flow strategy.
At the beginning of the article, it stated that the order flow trading strategy seems to be the opposite of the idea of trend trading. Trend traders are keen on trading price breakthroughs and selling at higher prices. For the order flow strategy, price breakthroughs or structural breakthroughs are only used to assist in estimating the direction, and the entry position is to wait for the price to return to the wholesale price, that is, to buy near the OB, and then sell at the retail price after the price rises , that is, wait for the price to rise to the previous high or sell after breaking through the previous high.
Look at the definition of OB again:
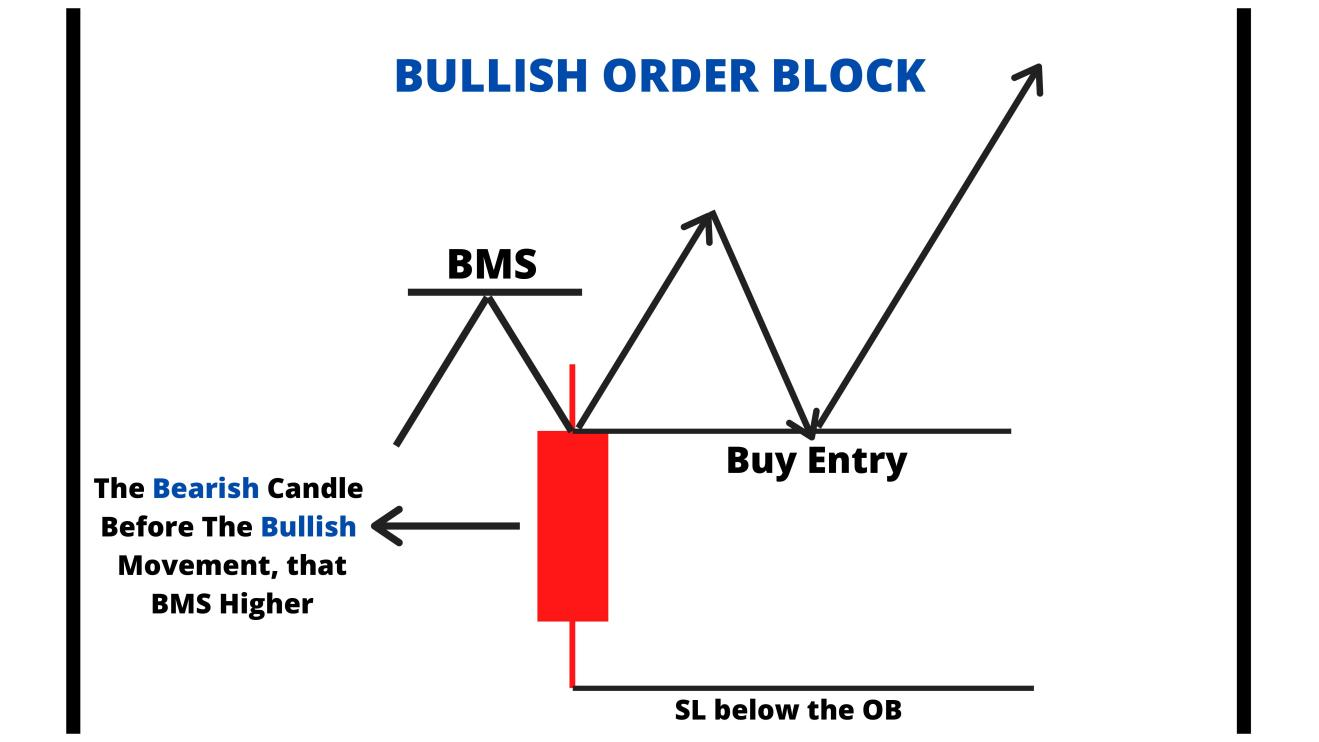
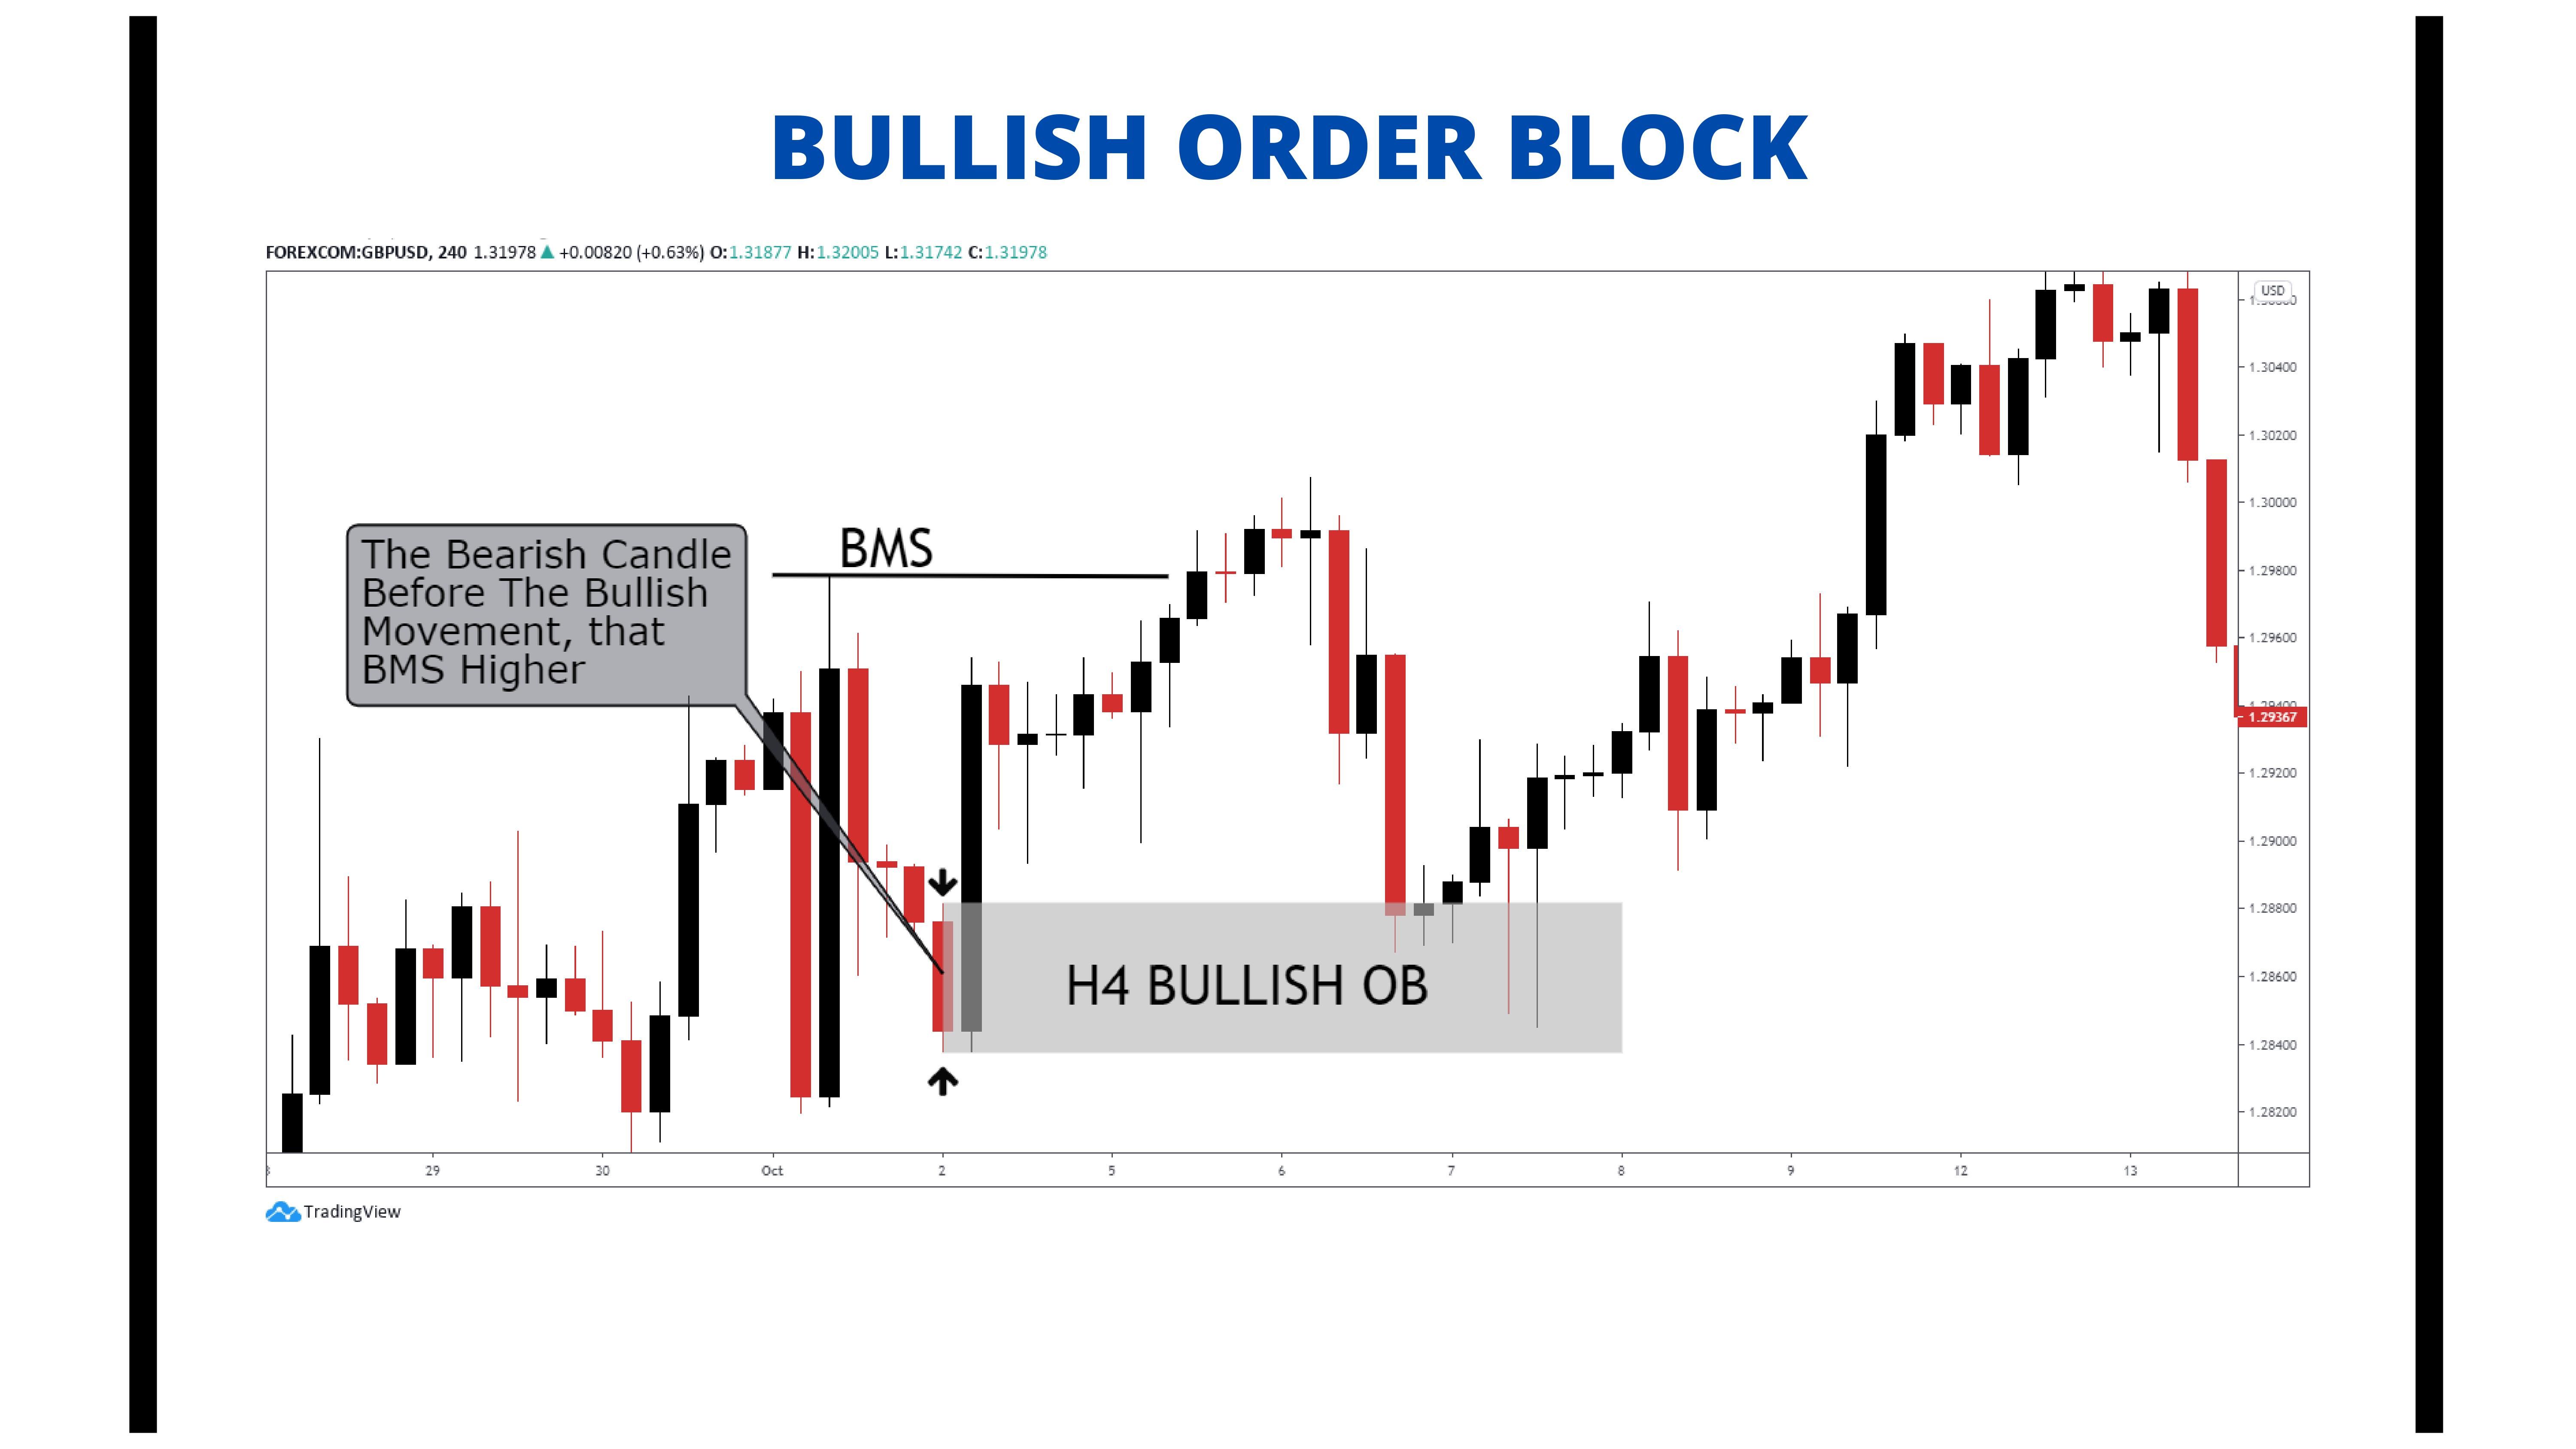
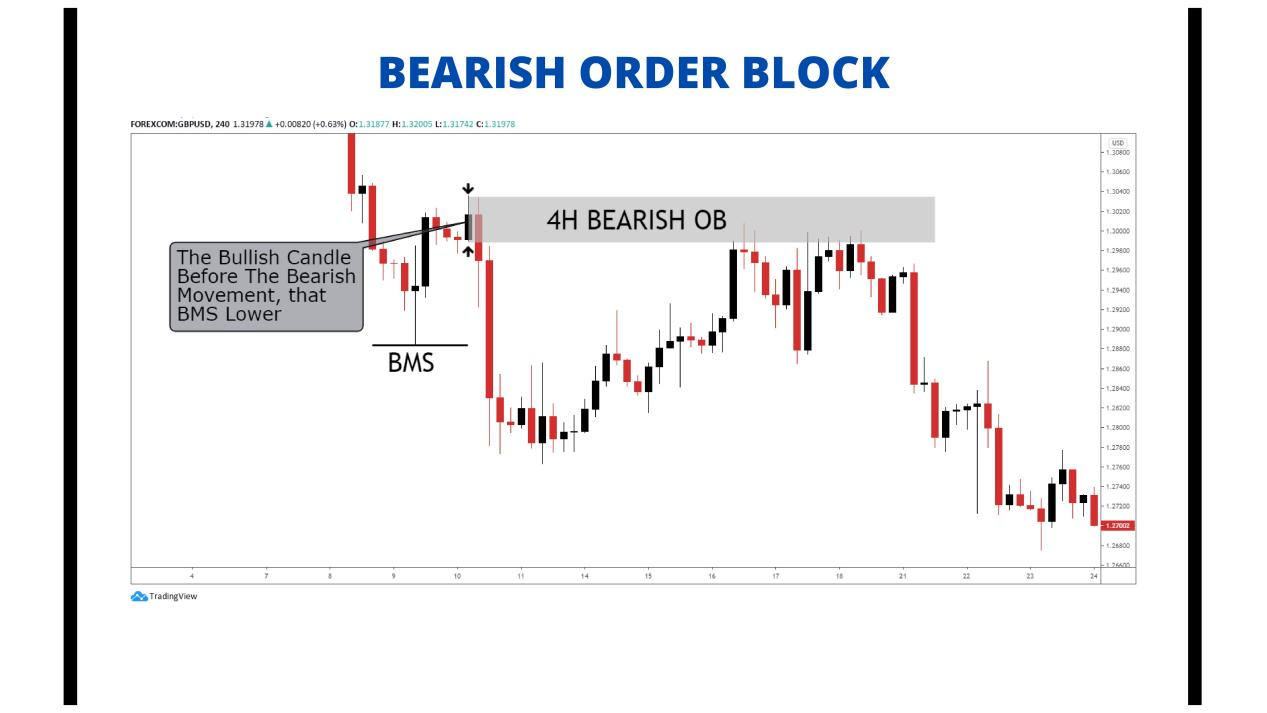
An order block (OB) refers to the last bearish candlestick before a strong upward breakout of a structure or the last bullish candlestick before a significant downward breakout of a structure in any time period.That is, whenever there is a valid structural break, an OB is formed, a bullish structure break forms a bullish OB, and a bearish structure break forms a bearish OB.
Take a look at the following pictures:
Let's take a look at the cause or principle of OB, and the role of OB. Refer to the SMC article I shared:
"Causes and Effects:
As for the causes, I don't know the specific truth, but the order flow theory can explain it, so for now, let's assume that it is true, because no one can understand all the market truths.
The key is how you view the market, what kind of market outlook you have, and how to trade based on your market viewpoint.
In order to go long, someone has to go short, and in order to go short, someone has to go long. Only when there is a buyer and a seller can a transaction be completed. If there is a lack of buy orders when shorting, the market price will fall to find buyers. Conversely, the market price will rise to find sellers. (Please refer to Daemon Goldsmith's "Order Flow Trading" for more information.)
Large institutions mainly trade using algorithms, and even if their large orders are split, they can still have a significant impact on the market price. They usually complete price delivery on a daily basis or match orders during the periods of the highest liquidity.
To ensure that the orders are successfully executed, and to reduce the adverse effects of orders on market prices and slippage costs, institutions will use the "sell to buy" or "buy to sell" method of trading at critical positions.
That is, first pushing down the price by selling to break through the support of the previous low, and then matching the small breakout sell orders and buy stop-loss orders (i.e., market sell orders) of retail investors with the large buy orders of institutions (the main bodies of the completed transactions are the institutions' own sell orders).
After the price rises, the institutions' sell orders are trapped as costs. If it is a retail investor, they may have to stop loss. However, with abundant assets, institutions can recover costs by selling to make a profit (traditional technical analysis refers to this behavior as testing or pullback confirmation).
If the institution's orders have not been completely filled, they will use the order flow of the recovered costs to trade near the initial cost price. These behaviors are reflected on the chart as a confirmation of a price reversal, which opens a new trend.
The institution's cost accumulation area is the order block. A large number of order costs are stacked inside, which is an area that institutions will definitely protect.
Not all order blocks will be recovered quickly, and don't be too rigid about the concept of order flow. Don't try to seek certainty. The order flow strategy is just a probability advantage. "
Let’s see for yourself, his main principle is to analyze the principle of institutional Positions and find the traces of institutional Positions. OB is the cost area of institutional Positions, so our Position in the cost area of the institution is of course the place with the best winning rate.
Take a look at this picture again:
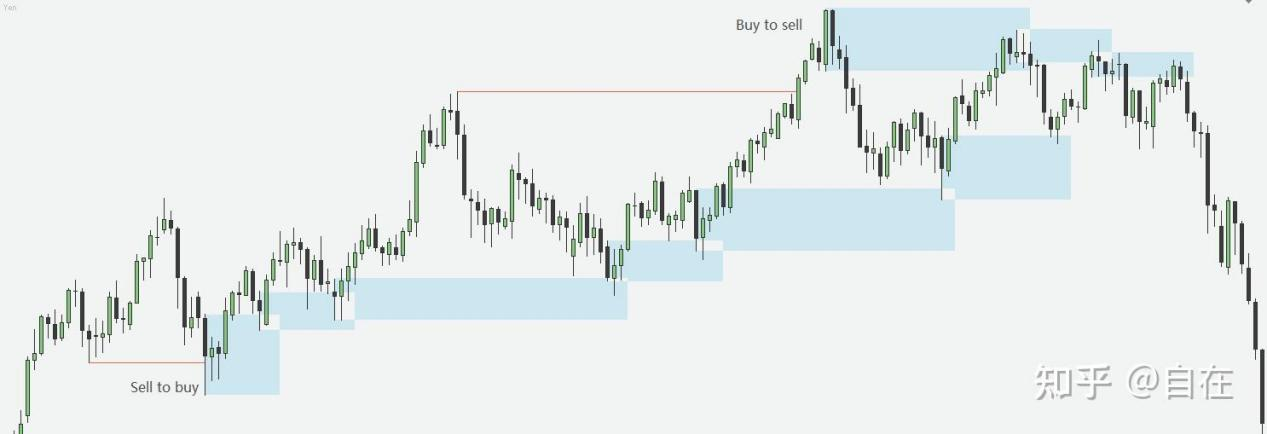
In the order flow strategy, it is more important to judge the price trend, so traders judge the direction in their own big cycle or direction cycle, and trade in their own small cycle or trading cycle. Multi-period analysis is very important in SMC trading, at least you need two periods, one direction period and one transaction period. Many people ask me what is the best cycle choice, but there is no unified answer. If you use the 5-minute chart as the trading period, then I think your direction period is at least 1 hour or 4 hours; if you use the 15-minute chart as the trading period, then I think your direction period is at least 4 hours or more. This is a combination that I personally think makes sense.
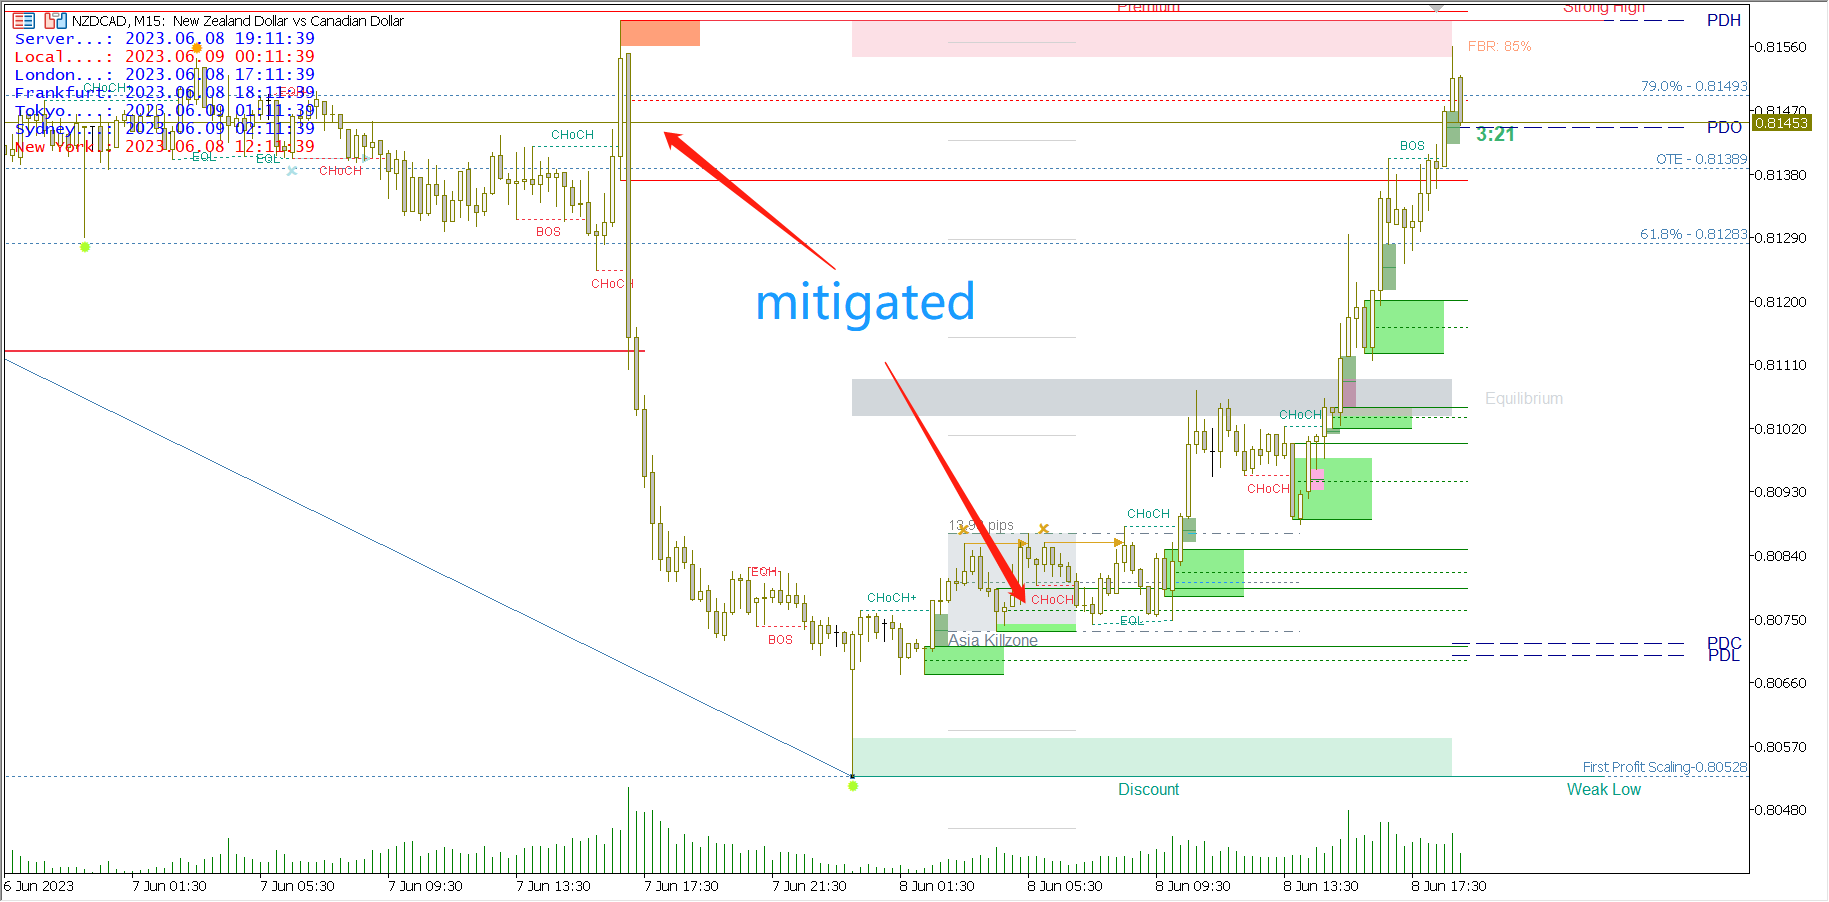
When the price completely crosses an OB, the OB is deleted.
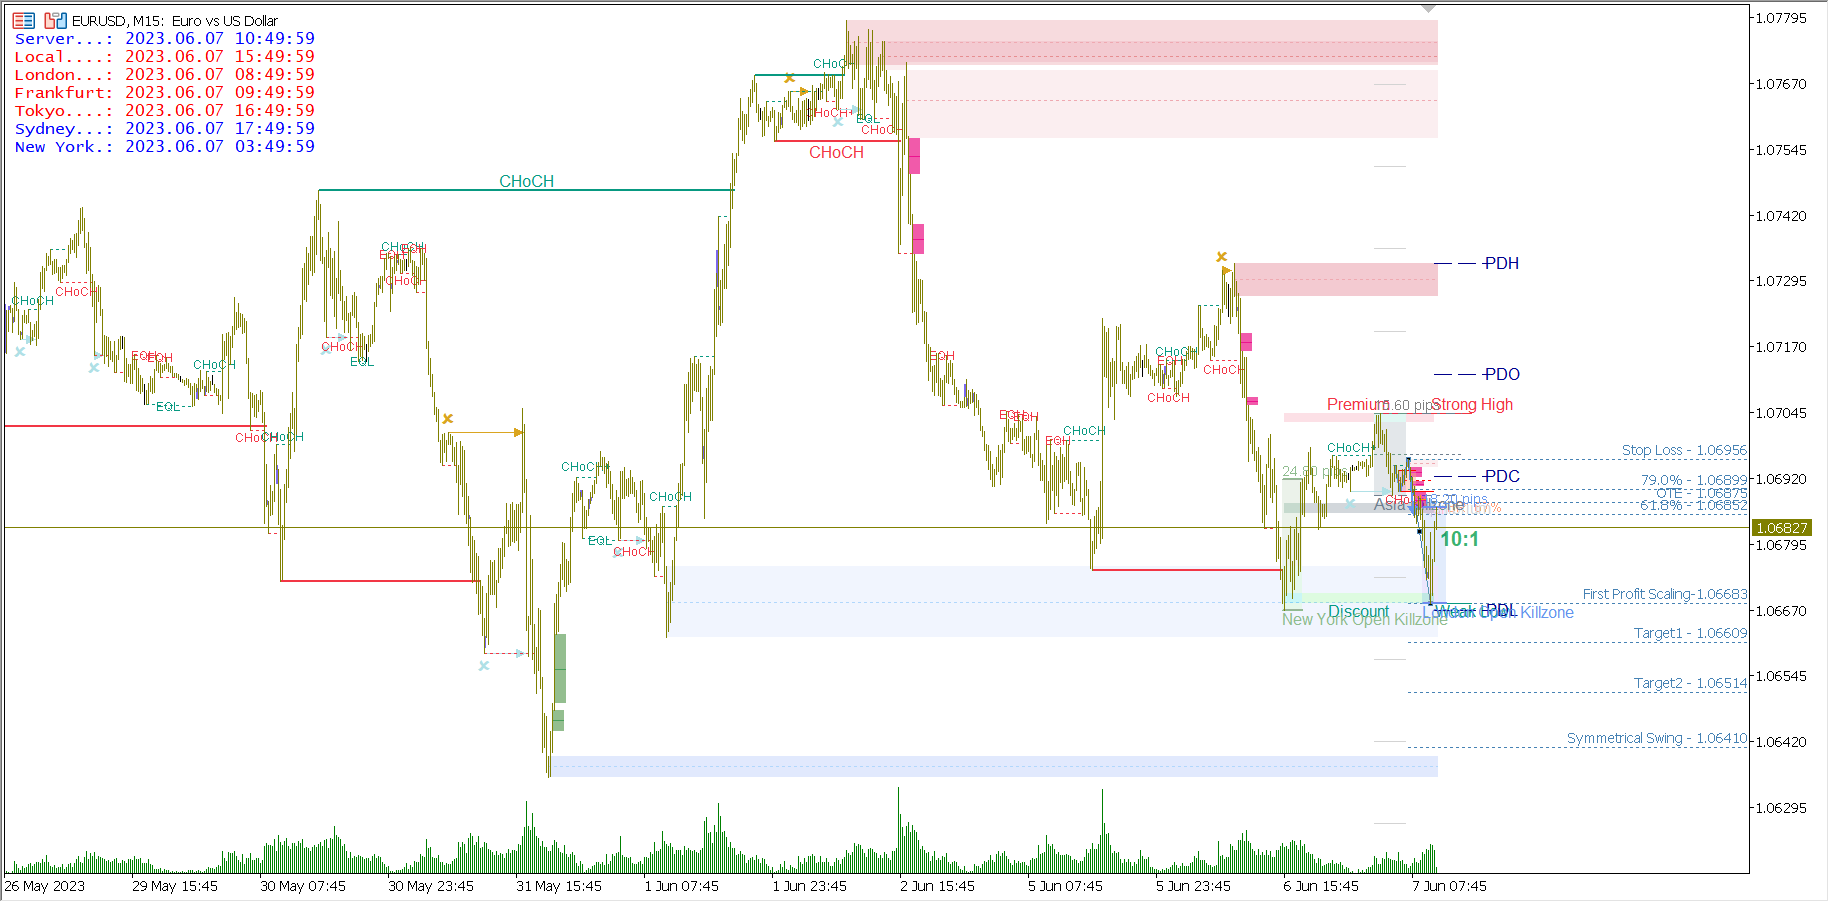
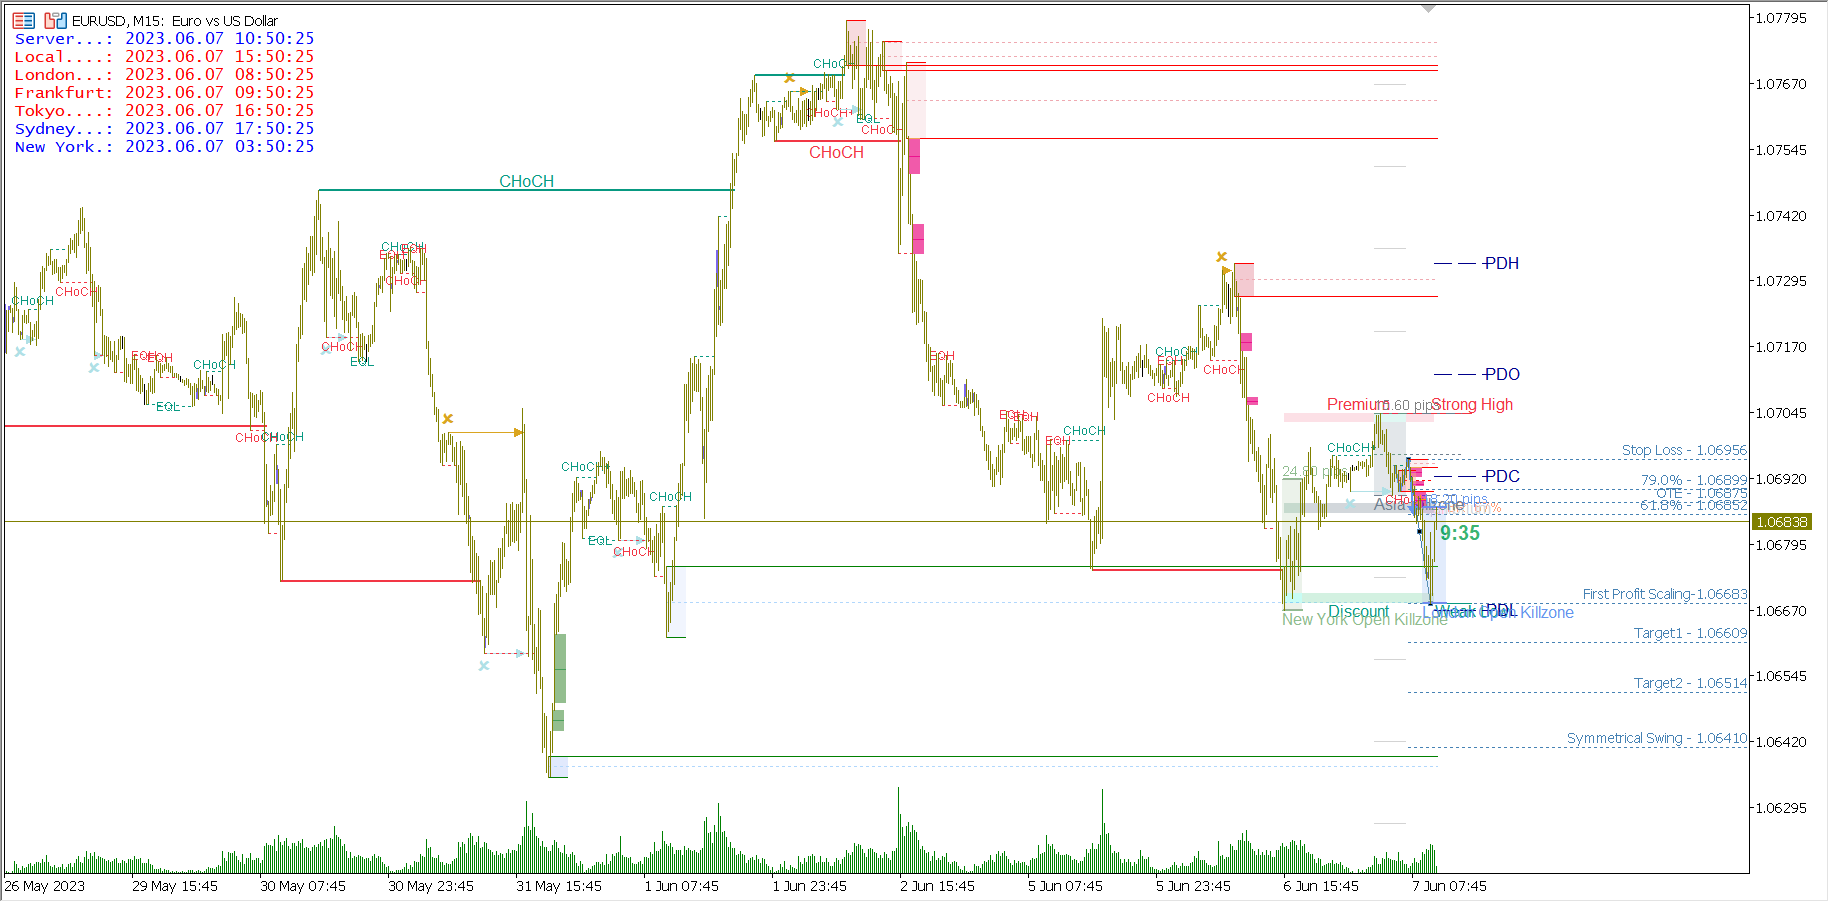
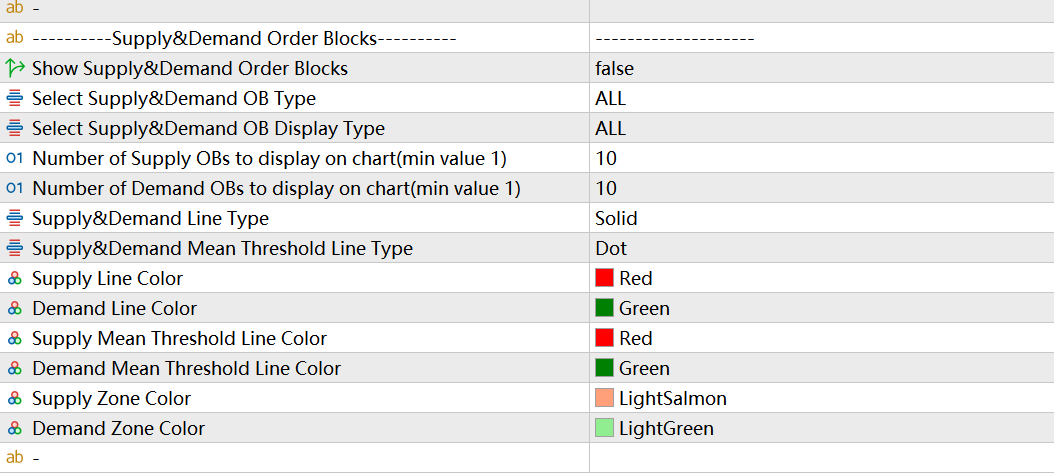
In the settings, we can set whether to display internal ob and swing ob, and the number of recent OBs that need to be displayed. Users can also set whether to display OB mean threshold and the way of OB display. There are two types of OB display methods to choose from. One is Display As Rectangles, which means that the program identifies the OB with a rectangular block filled with color. The second type is Display With Top-Bottom Lines, which means that the program will mark the high and low points of the OB with two straight lines up and down. This option is mainly used by traders who want a more concise OB display.
BULL bear ob alternative display, this setting enables the OBs on the upper and lower sides of the current price to be displayed alternately in the most recent order and meet the display quantity limit.
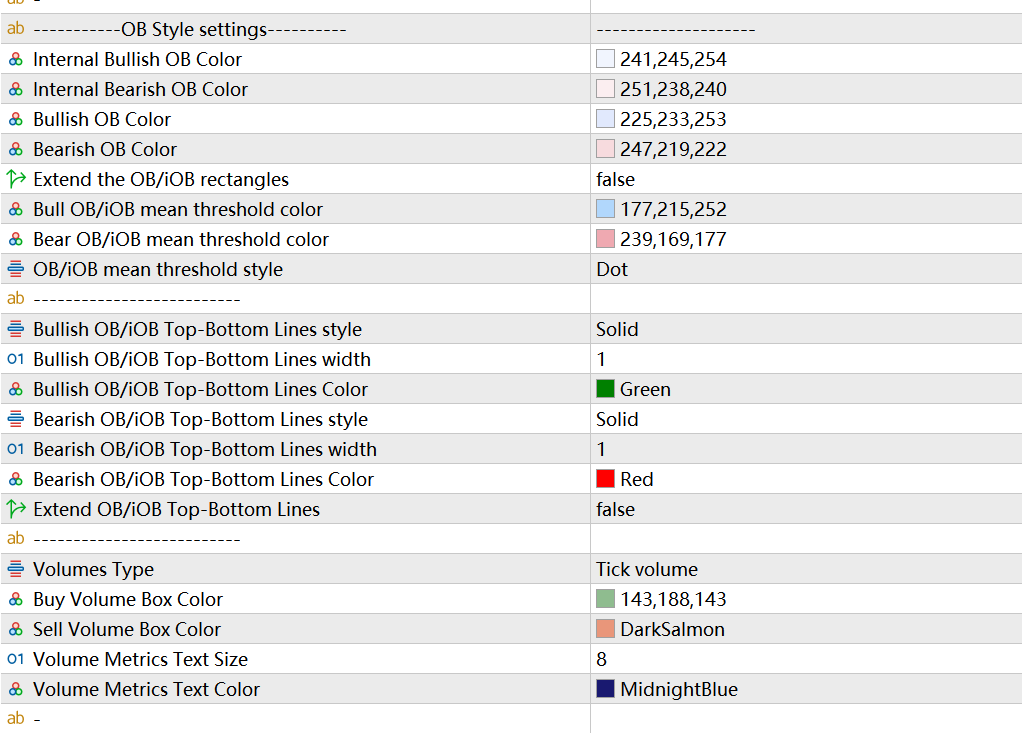
OB style settings, where users can freely set the color of OB to suit your chart style, making the chart look more concise and beautiful. Extend the ob/iob rectangles, this setting allows the OB block to automatically extend to the far right of the chart, if you like this OB display, you can set this to TURE. Below is the formatting for OB mean threshold line. You can choose solid or dashed lines and the color of the lines according to your preferences. Next is the place to set the format of OB top-bottom lines, the format, color, width and whether to extend to the far right of the chart.
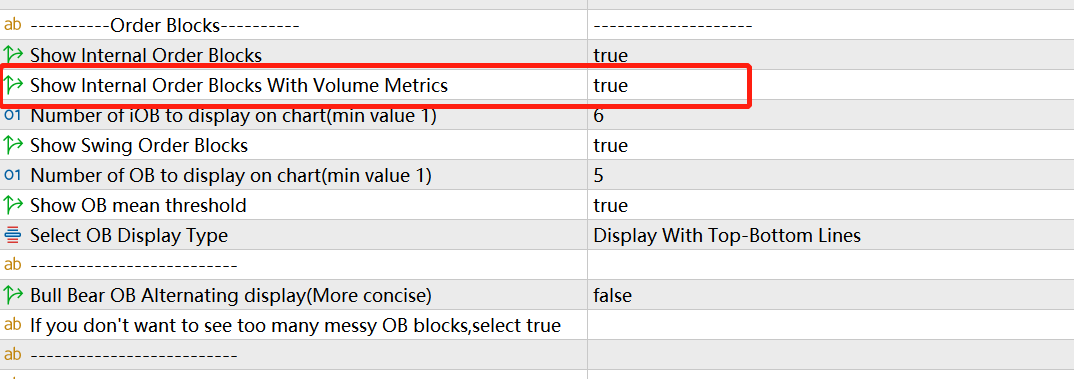
Below is the place to set the format of the internal OB with volume metrics. You can turn this feature on or off by setting Show Internal Order Blocks With Volume Metrics. Here we can choose two volume types, Tick Volume and Real Volume. If we trade currency pairs, there is only Tick Volume data.
This function will calculate and display the sum of the transaction volume in the structural breakthrough corresponding to the OB, as a reference for the OB in the transaction volume dimension. Here, the green rectangular block is the statistics of the trading volume of the bullish candles, and the orange rectangular block is the statistics of the trading volume of the bearish candles. The rightmost tab shows the sum of long and short volumes. Percentage is the ratio of this OB transaction volume compared with other several OB transaction volumes.
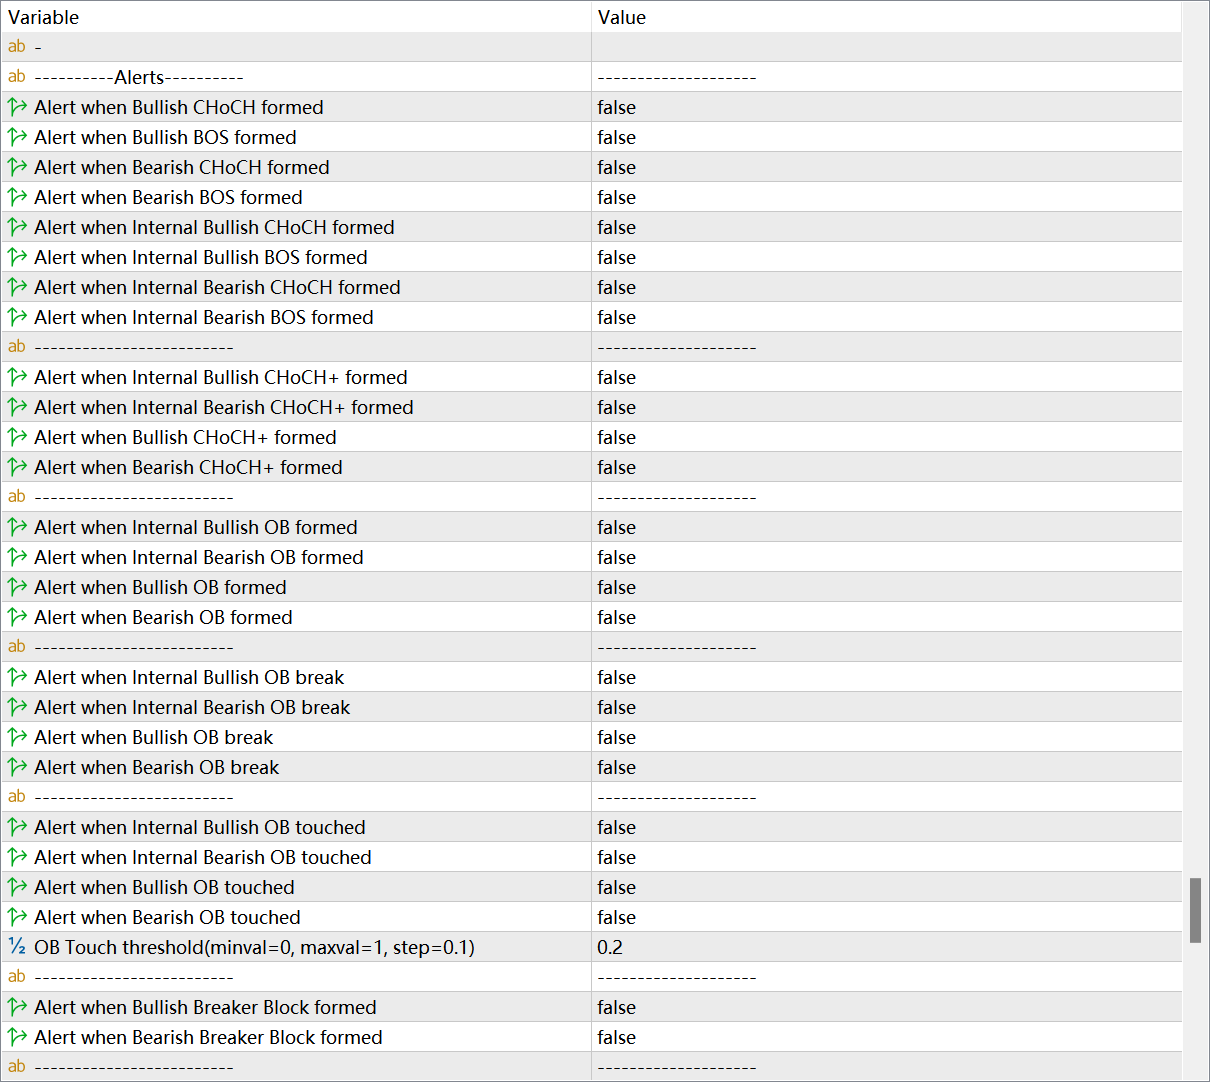
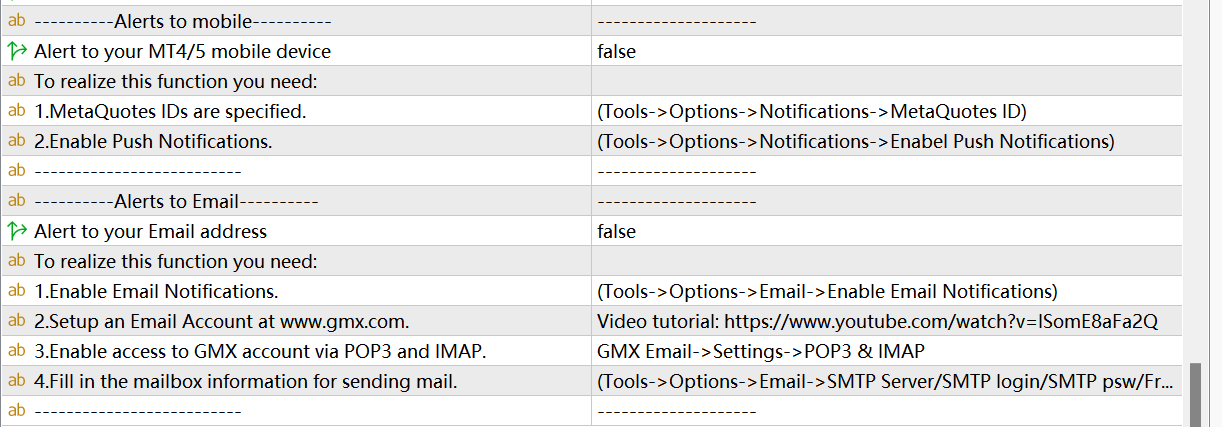
For market structure and OB, indicators have perfect and detailed reminder functions. At the very end of the setting interface is the area where ALERT is set intensively. Here you can set alerts for the formation of each market structure. OB formed , OB touched , OB break can also set reminders. On the MT computer side, a prompt window will pop up and a prompt tone will be played. If you want to send these reminders to the mobile terminal, you can set it under Alerts to mobile below. In order to send reminders to the MT4/5 software on the mobile phone, you need to perform a simple configuration in the MT software on the computer.
4. High Timeframe Structure
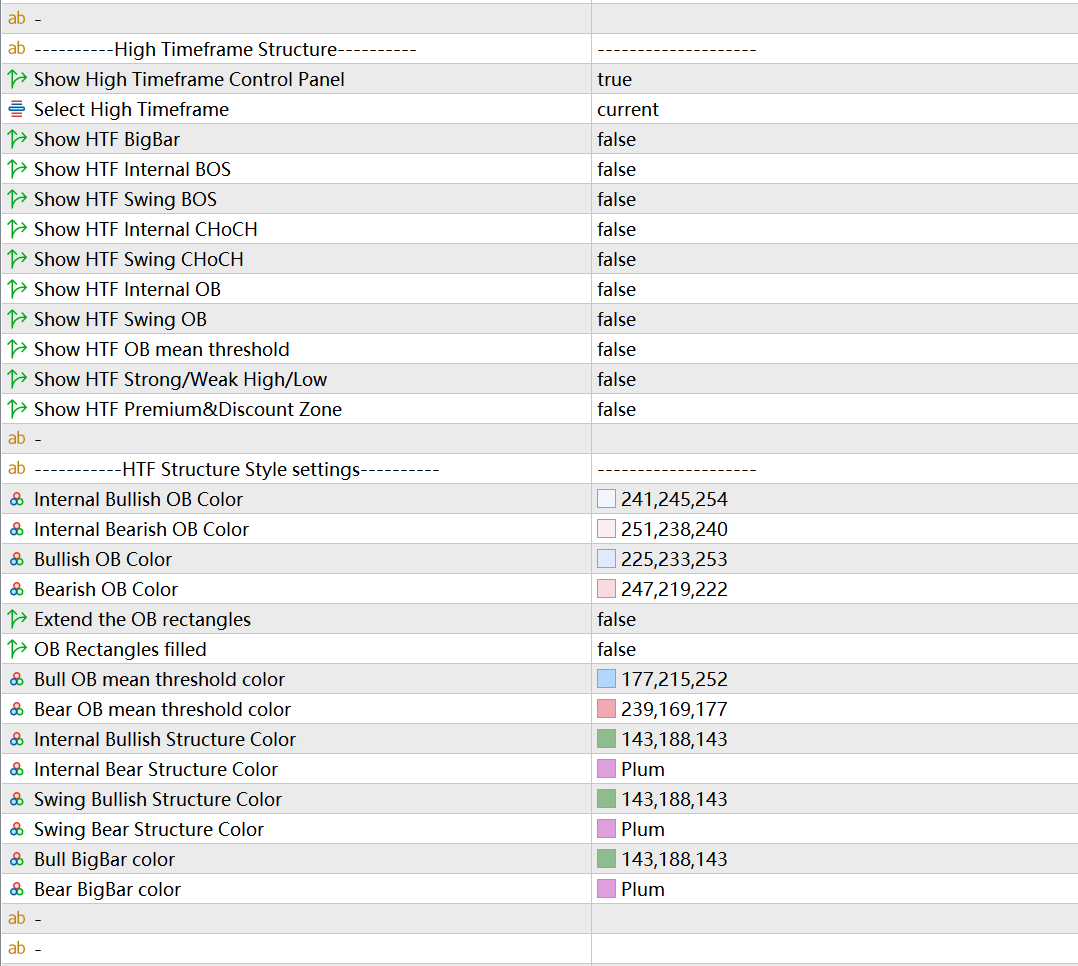
The HTF Structure function mainly provides users the market structure information of two different Timeframes simultaneously displayed on the same chart. As long as the first item is set to true and the second item "Select High Timeframe" selects a period larger than the current TF, then the HTF function will start. At this point, the control buttons for HTF will appear in the lower right corner of the chart.
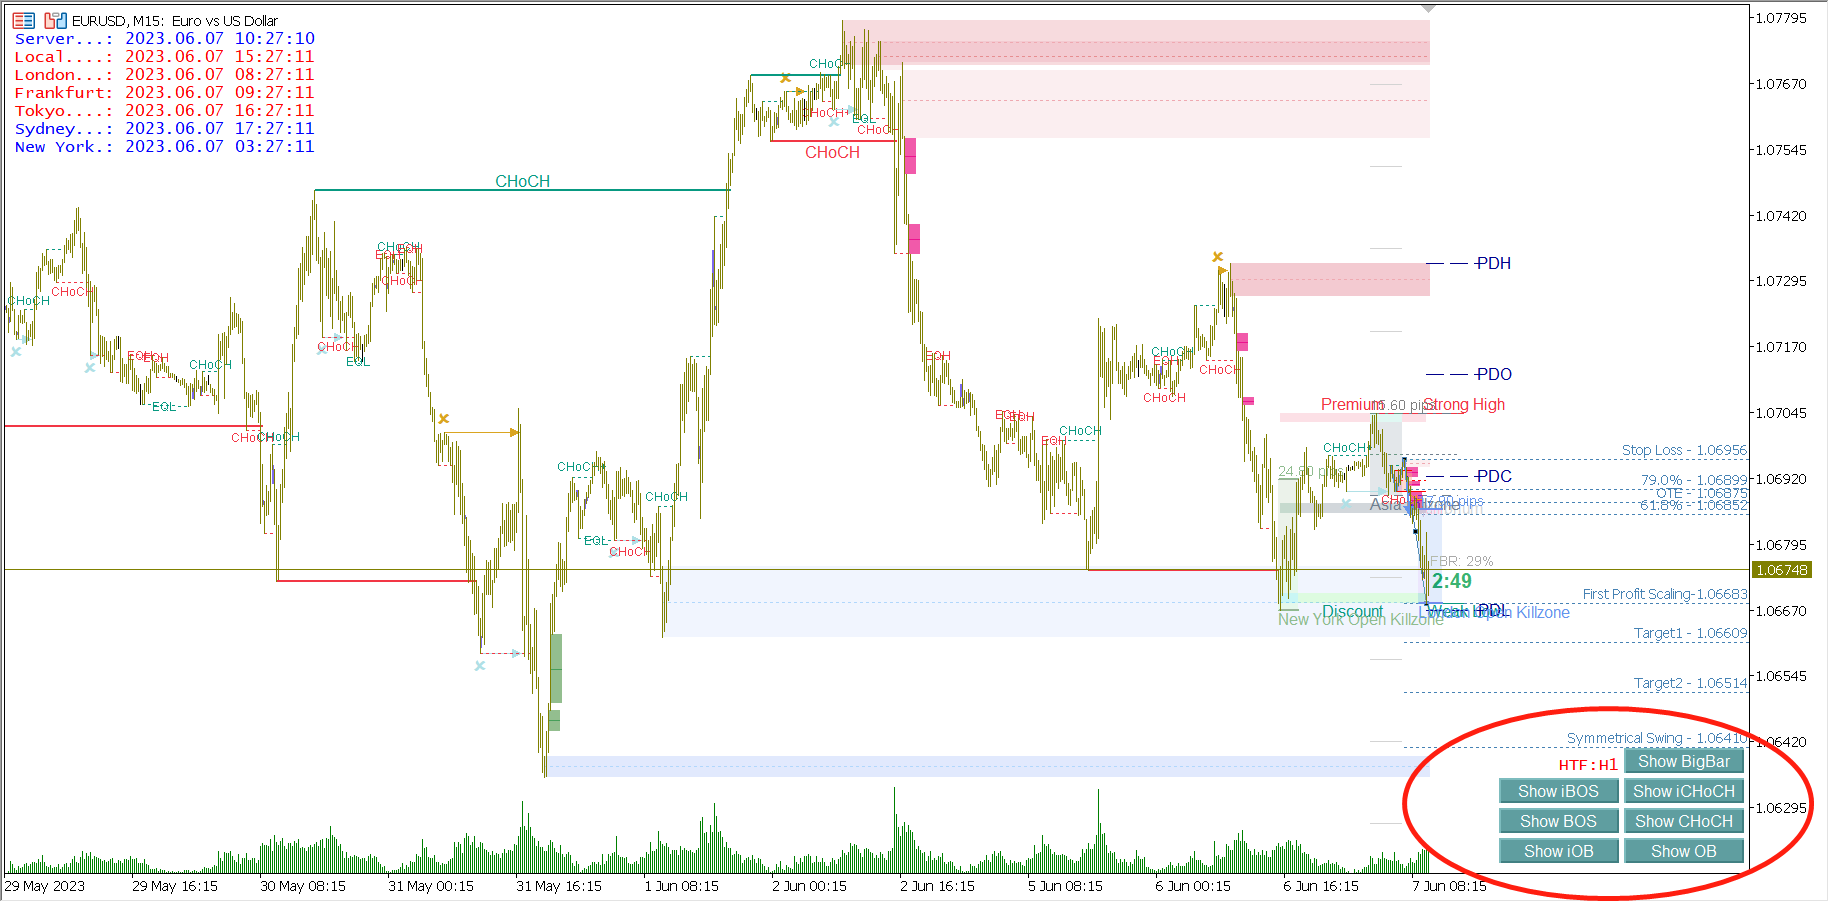
Clicking different buttons will display different information of HTF. The shortcut button functions of HTF BigBar, HTF internal BOS, HTF internal CHoCH, HTF swing BOS, HTF swing CHoCH, HTF internal OB, HTF swing OB are provided here. HTF OB mean threshold, HTF Strong/Weak High/Low, HTF Premium&Discount Zone functions need to open the setting interface for setting.
The HTF Structure Style Settings area is the style property setting area for HTF functionality. Users can set it according to their needs.
Version 14.8:Add a Magic Number option to SMC to support adding multiple SMC indicators to the same chart. This can enable viewing multiple HTFs info in the same chart. Magic Number Option is located at the bottom of the settings interface.
5. MTF Structures Dashboard
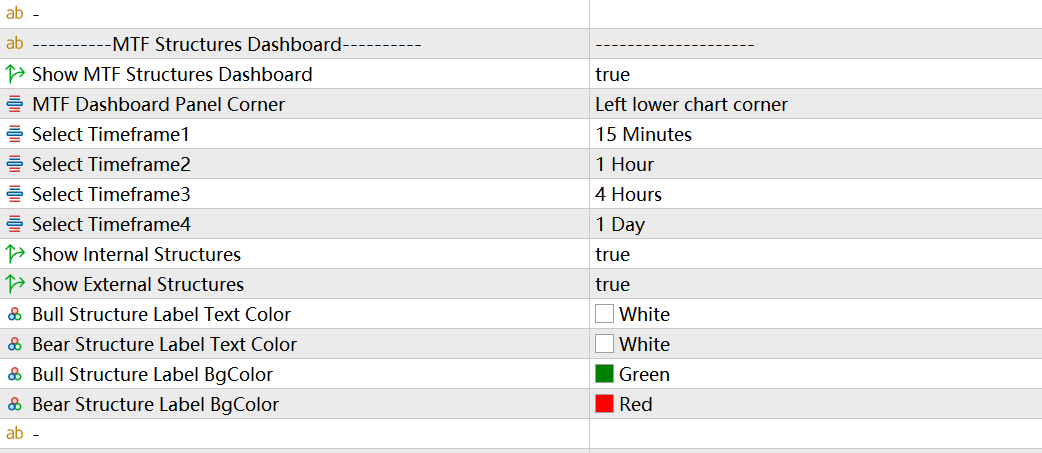
This function will display BOS/CHoCH information of 4 different periods in one panel on the chart at the same time, so that users can quickly understand the market structure information of other periods. Users can set the 4 periods they need in the settings, and can choose to display only internal structures or swing structures. Users can choose the display position of MTF Dashboard. The program provides four corners of the chart for selection, and the default is the lower left corner of the chart.
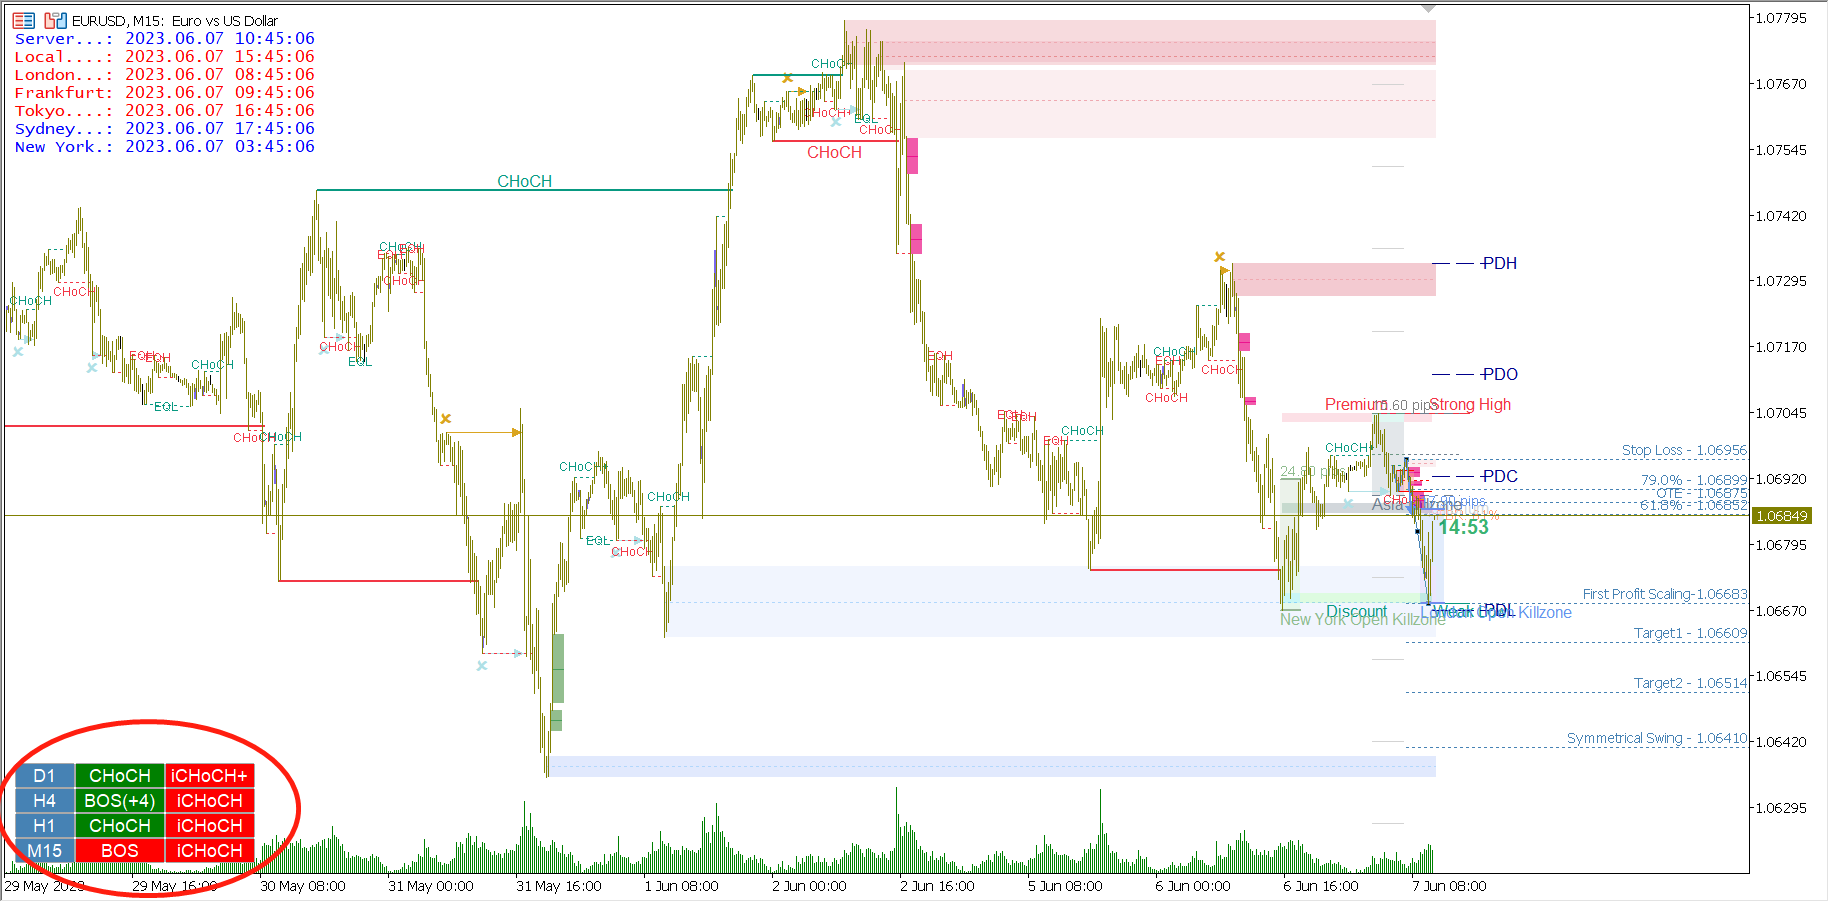
If there is no data as shown in the figure above, please right-click on the chart and select Refresh on the pop-up menu.
6. Fibonacci Retracement/Fibo OTE
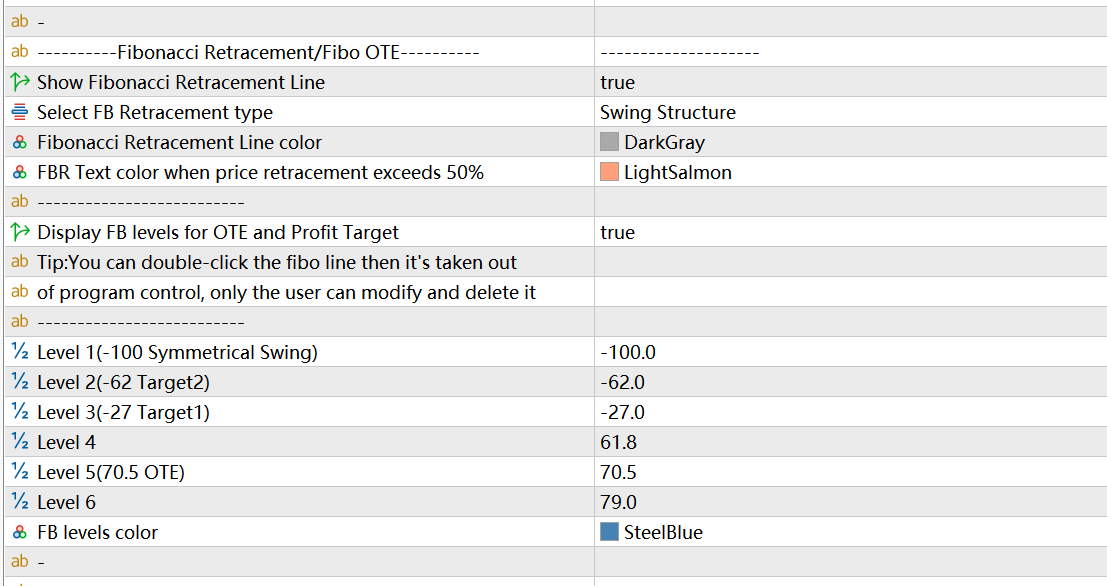
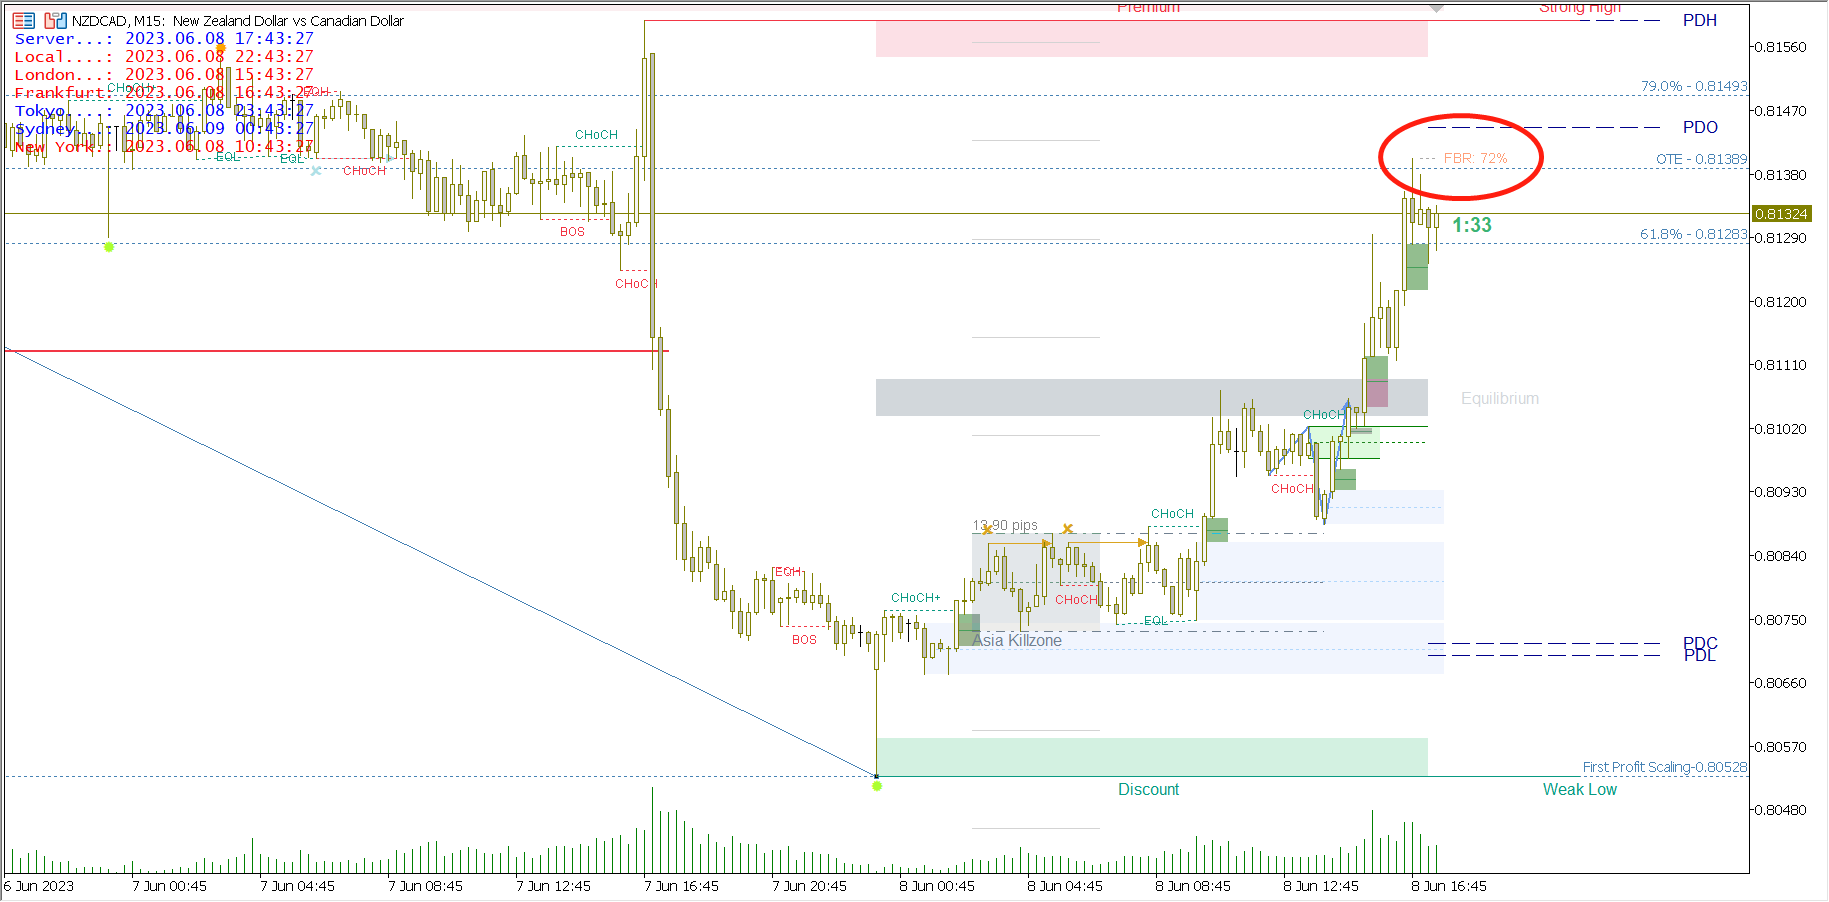
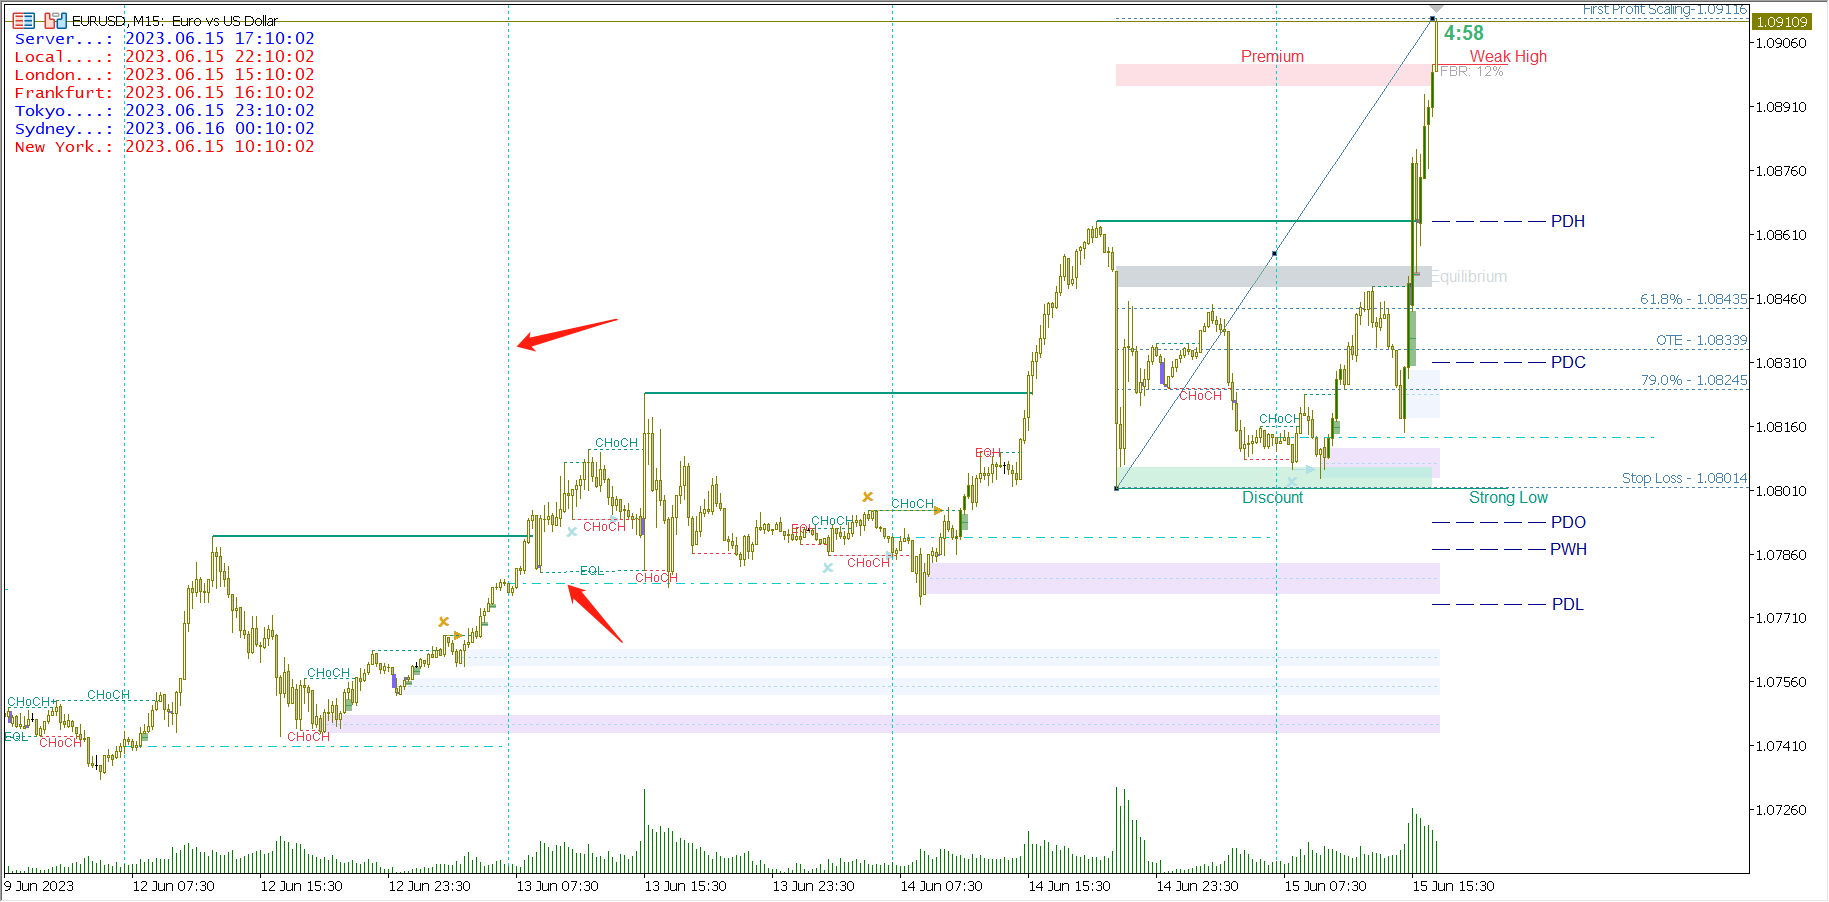
In the order flow strategy we mentioned that trend traders are keen to trade breakouts, while the order flow strategy uses structure breakouts to estimate direction and analyze institutional order blocks. Wait until the price pulls back to the discount area or the order block area before entering the position. Therefore, it is a very important function for SMC traders to use FIBO to mark a wave of price breakthroughs, and to predict and mark the possible retraction range of prices. The Fibonacci Retracement function can automatically draw a wave of FIBO based on break internal structures and break swing structures, and mark important positions that traders care about: Stop Loss(100%), OTE(70.5), 79%, 61.8%, First Profit scaling(0%), Target 1(-27%), Target 2(-62%), Symmetrical Swing(-100%). You can also set the callback range according to your own needs. Level 1-6 can be set freely.
In the setting, the first four setting items are for setting FBR, as shown in the figure below. According to the price trend, FBR displays the maximum correction range in real time. When the correction range exceeds 50%, it will be displayed in a more eye-catching color. You can also set reminders for FBR in the Alerts area.
The following setting items are for setting the Fibo Levels for OTE function. See below. If you feel that the high and low points of Fibo Levels automatically drawn by the program are incorrect, you can drag and adjust by yourself. If you need to display this Fibo Levels all the time and don't want the program to delete or modify it, then you can double-click this Fibo Levels to make it out of the control of the program.
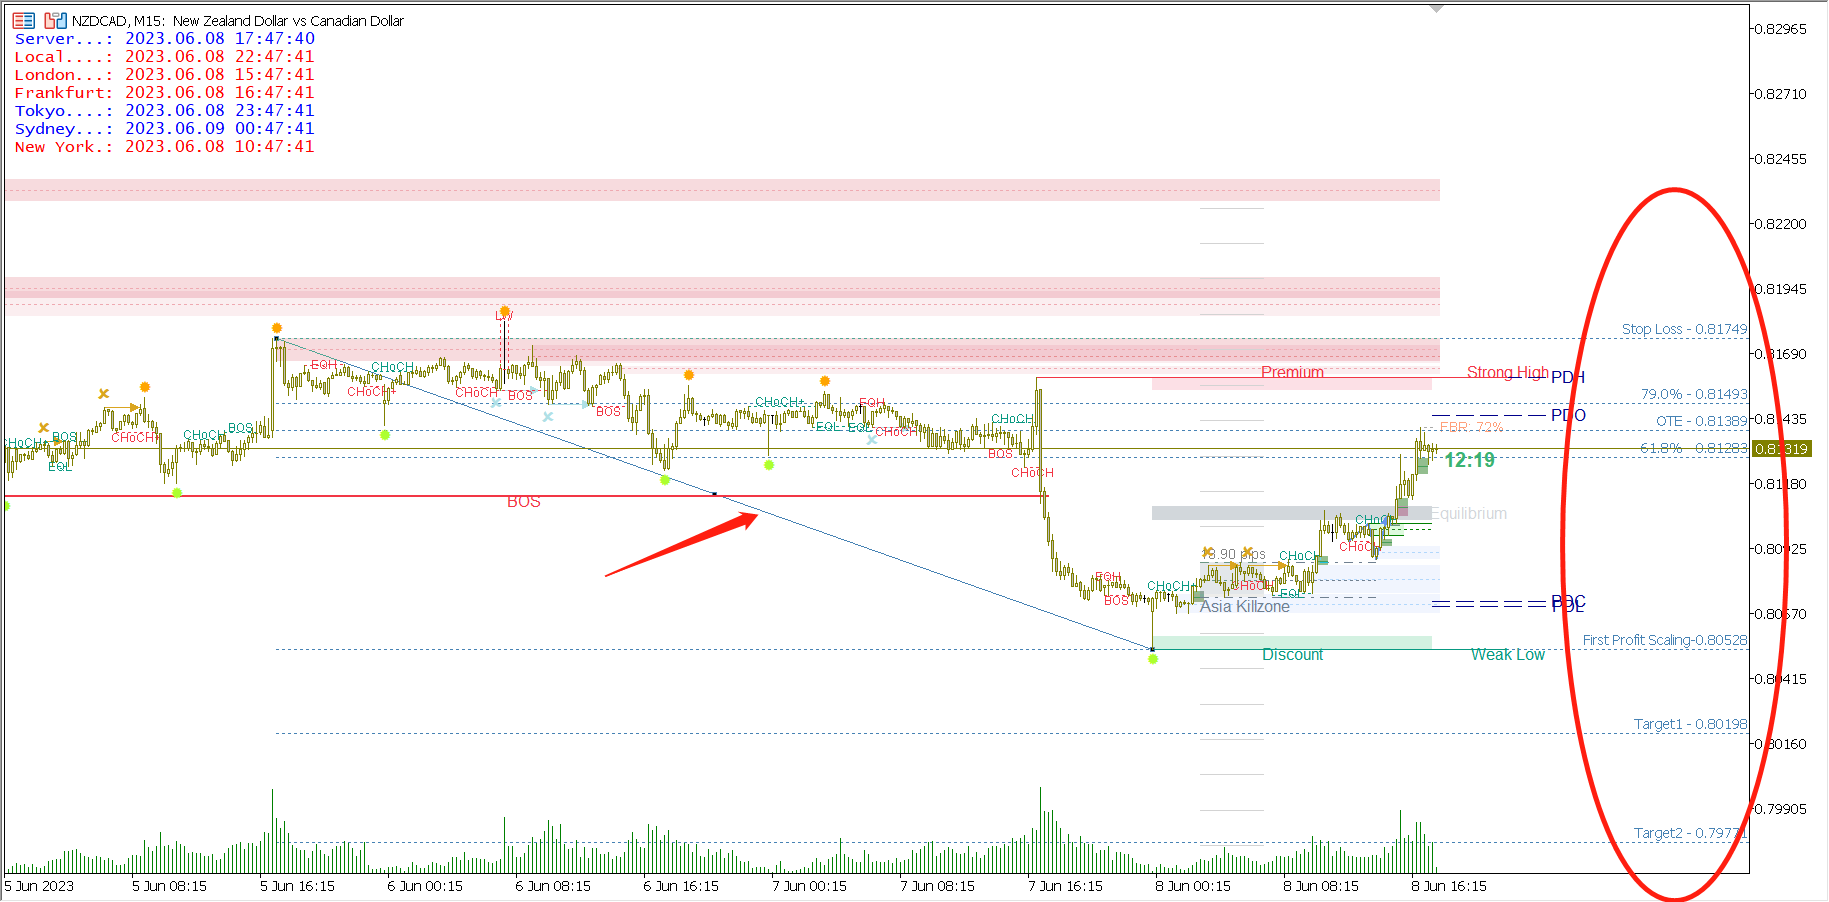
7. Breaker Blocks
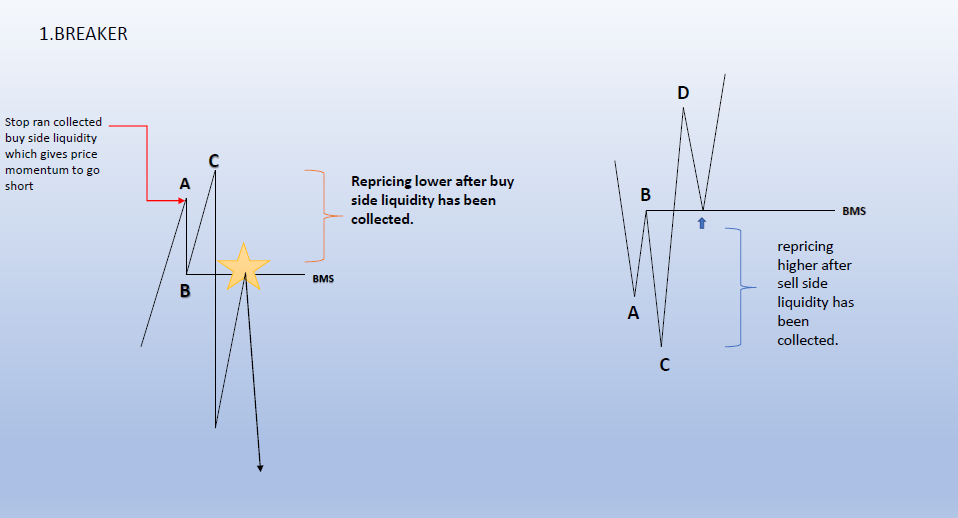
The definition of Breaker is shown in the figure above. Breaker Blocks are bullish candles or bearish candles at point B. There are many price movements that satisfy the N-shaped shape of ABCD, and what we hope is to find out the Breaker that appears when the price reverses at the end of the trend and the Breaker that occurs when the price reverses at the end of the callback. Therefore, the program has made some judgments on trend trends and callback trends, but they will not be very accurate. Users need to use their own experience, or combine momentum indicators and overbought and oversold indicators to filter and use them.
In addition, the CD line is the price breakthrough point B (the low/high point of the callback). If the CD is a strong momentum breakthrough (combined with FVG, Strong Imbalance, Volume Imbalance, etc.), then the probability of success of this Breaker will be higher.
The first setting is whether to enable Breaker Blocks (BB) detection and display. The second item sets the display type of BB, and there are also two types of filling rectangle and upper and lower lines for selection. The third item is to set whether to display N-Lines, N-lines is the connecting line of three line segments AB, BC, CD, forming an N shape. The fourth setting needs to display the latest BB quantity that has not been broken by the price. The fifth setting is whether to display BB mean threshold. The following settings are basically the settings of the appearance style, and the user can set it according to the needs.
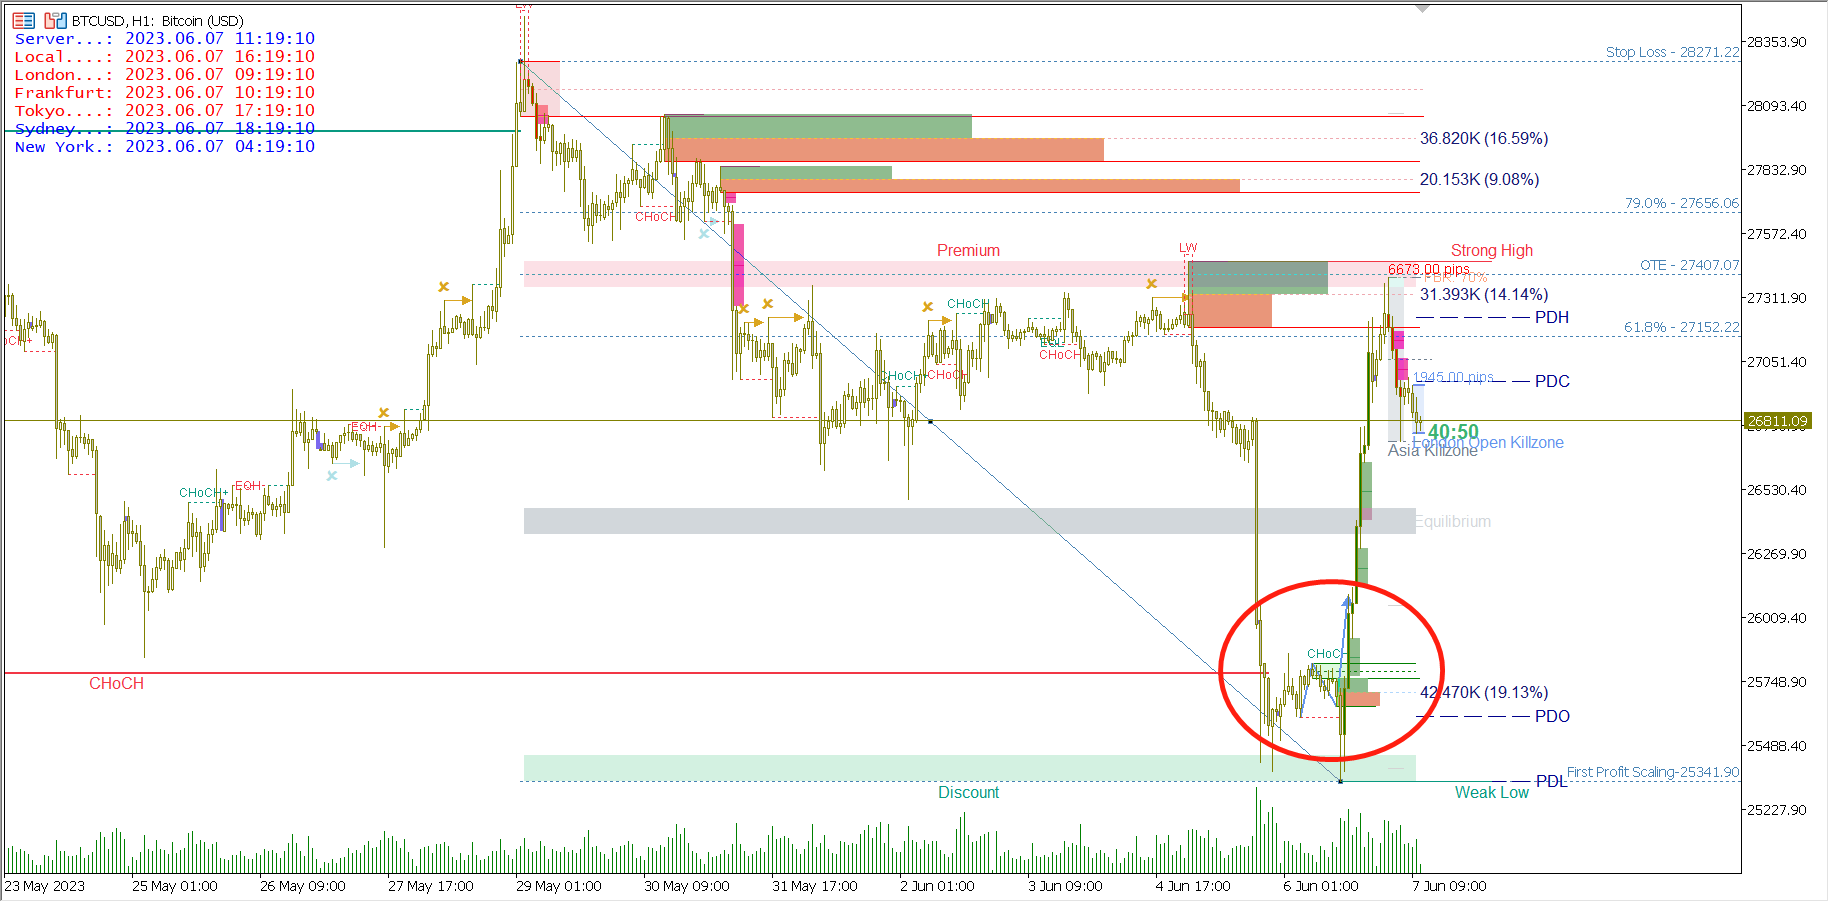
8. Supply&Demand Order Blocks
Before using the supply and demand order block function, please read the chapter "Structure-Based Supply and Demand Trading Strategy" in the SMC article I shared. It contains a detailed introduction of what is a supply and demand area (Institutional positions building area or decision area), how to identify a supply and demand area, and the type of a supply and demand area, etc. Simply put, supply and demand can be divided into two types: reversal structure and continuation structure. You can choose to display one or all of them in the indicator settings. The indicator also provides two display types of supply and demand OB, which users can set according to their preferences.
What is the difference between a supply and demand zone order block and an order block in order flow strategy? In my personal opinion, the theoretical basis of the two is different. Compared with the concept of supply and demand, the order block in the order flow strategy can be regarded as a generalized supply and demand area, or the supply and demand area can be regarded as a chivalrous order block. Because the supply and demand zone in the supply and demand strategy specifically refers to the interval candles with spindle candle/doji as the main shadow candle(the shadow candle are greater than 50%). But in practice, you will find that the supply and demand zone is somewhat impractical - the price often reverses at the large physical order block, rather than the supply and demand zone (spindle/doji etc. interval candles). Therefore, when the indicator calculates the supply and demand area, it does not strictly follow the definition to find the interval candles as the supply and demand block. Users can open OrderBlocks and Supply&Demand OBs at the same time to view their similarities and differences, or choose to use only the order flow strategy or only the supply and demand strategy based on their own trading experience.
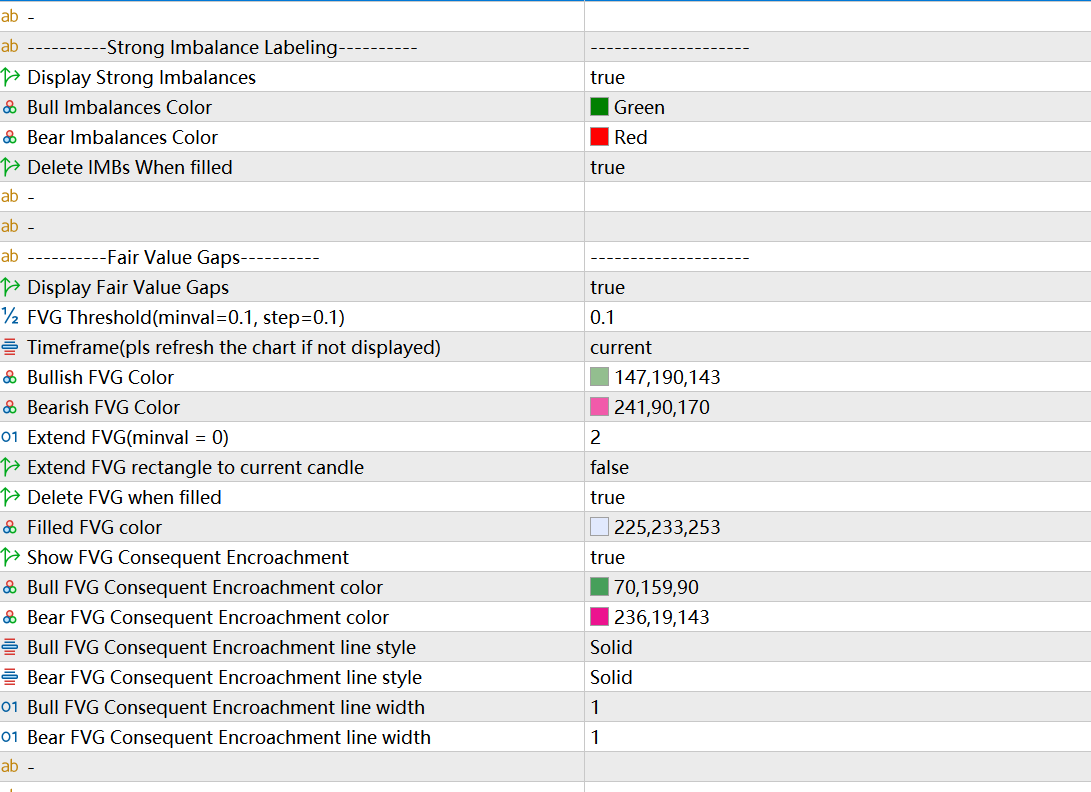
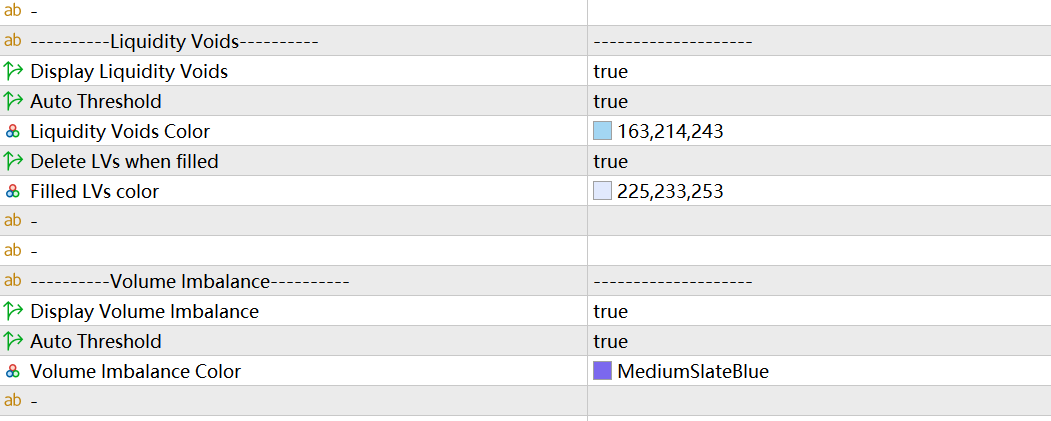
9. Strong Imbalance Labeling, Liquidity Voids, Volume Imbalance, and Fair Value Gaps
Before discussing these functions, please read the chapter on order flow strategy in the SMC article shared on the indicator page, which introduces the content of liquidity and liquidity imbalance.
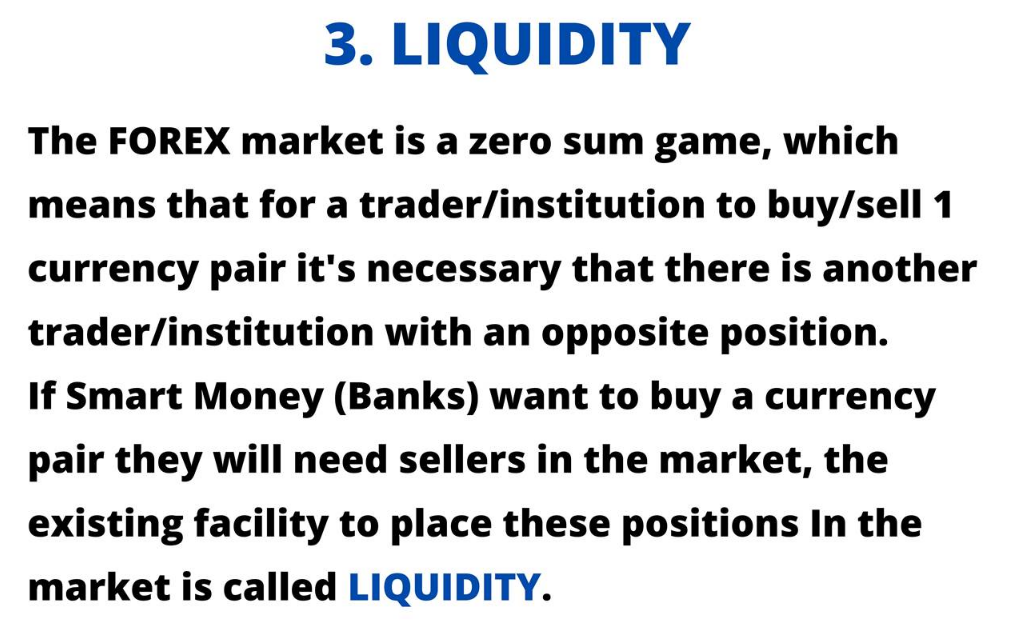
Liquidity:
In speculative markets, liquidity can be simply understood as pending orders.
There are roughly three types of orders:
market order
Limit order (limit order), also known as callback order
Stop order (stop order), I am more used to call a breakthrough order
Liquidity pool:
The liquidity pool refers to the area where a large number of pending orders are accumulated, usually located outside the high/low points of the large cycle.
At this key position, there are accumulated stop losses of entrants and stop orders of non-entrants. Once the price breaks through here, a large amount of liquidity can be obtained.
Liquidity Imbalance:
In any cycle, the large entity candle and the continuous candle in the same direction are all liquidity imbalances, which indicate that there are only buy orders or only sell orders in these candles. This situation is inefficient and unhealthy for the market. Institutions Algorithms will necessarily guide prices to (completely or partially) fill these areas (immediately or in the future).
There are two main types of liquidity imbalances that deserve attention:
Liquidity gap (LV, Liquidity void)
Fair value gap (FVG, Fair value gap)
The liquidity gap mainly refers to the continuous entity big candles and the gap.
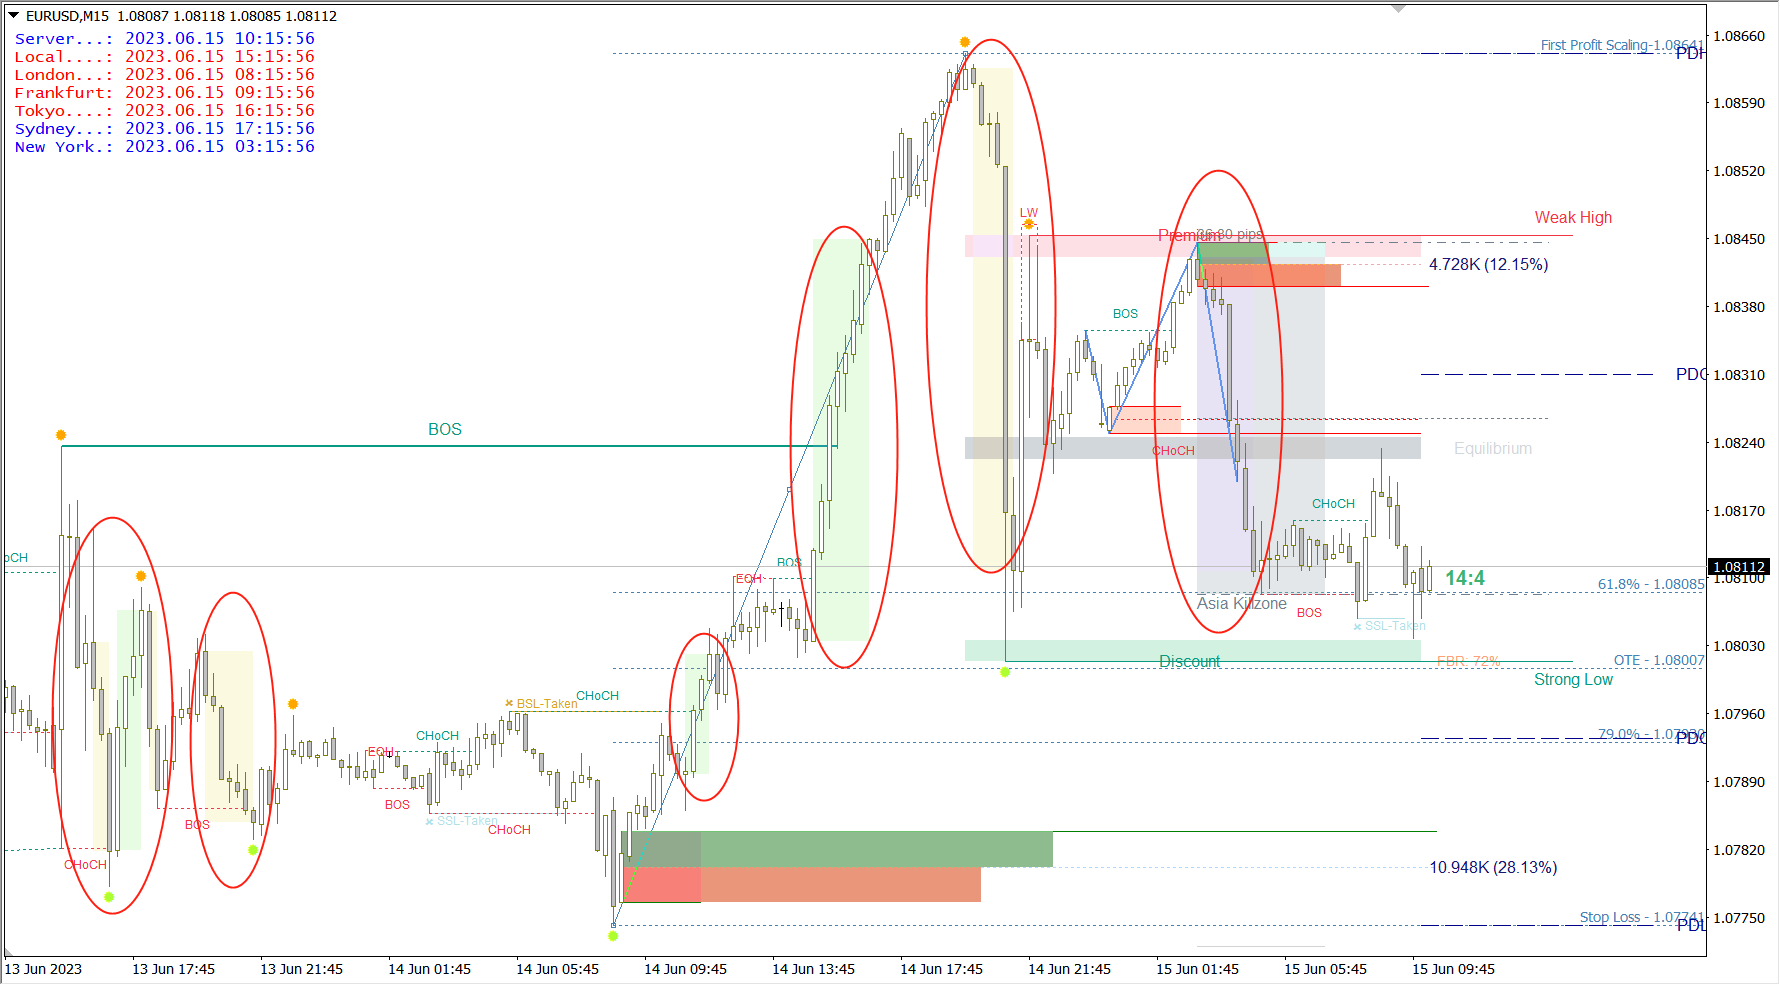
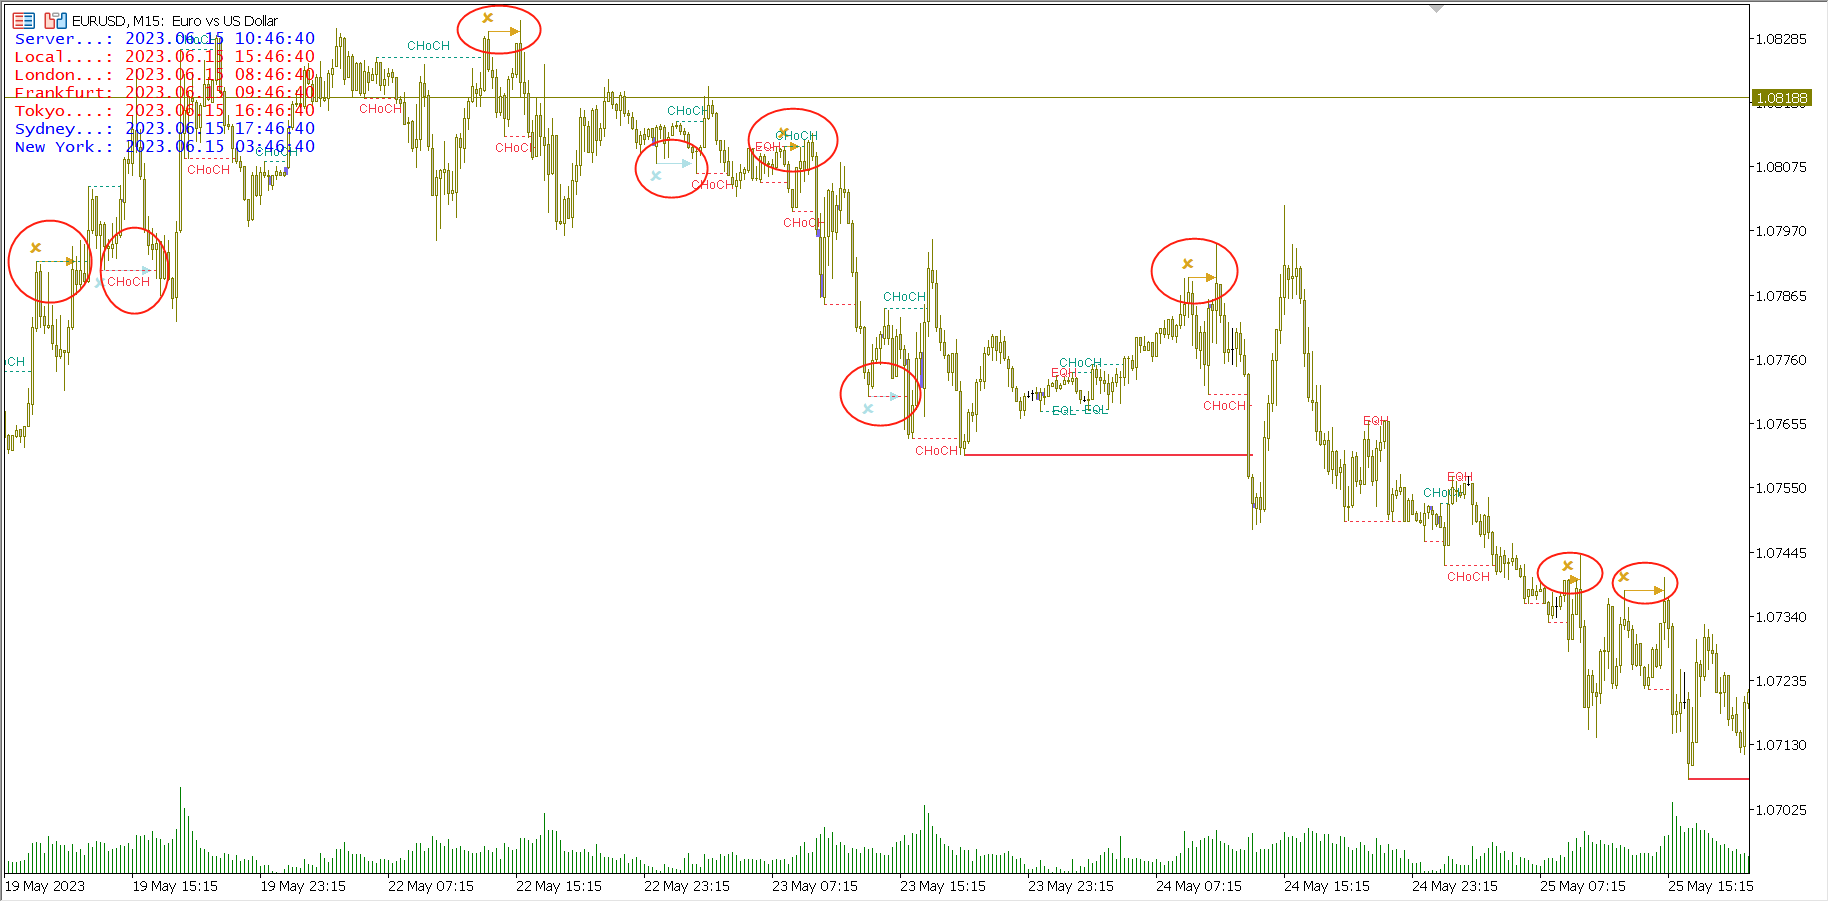
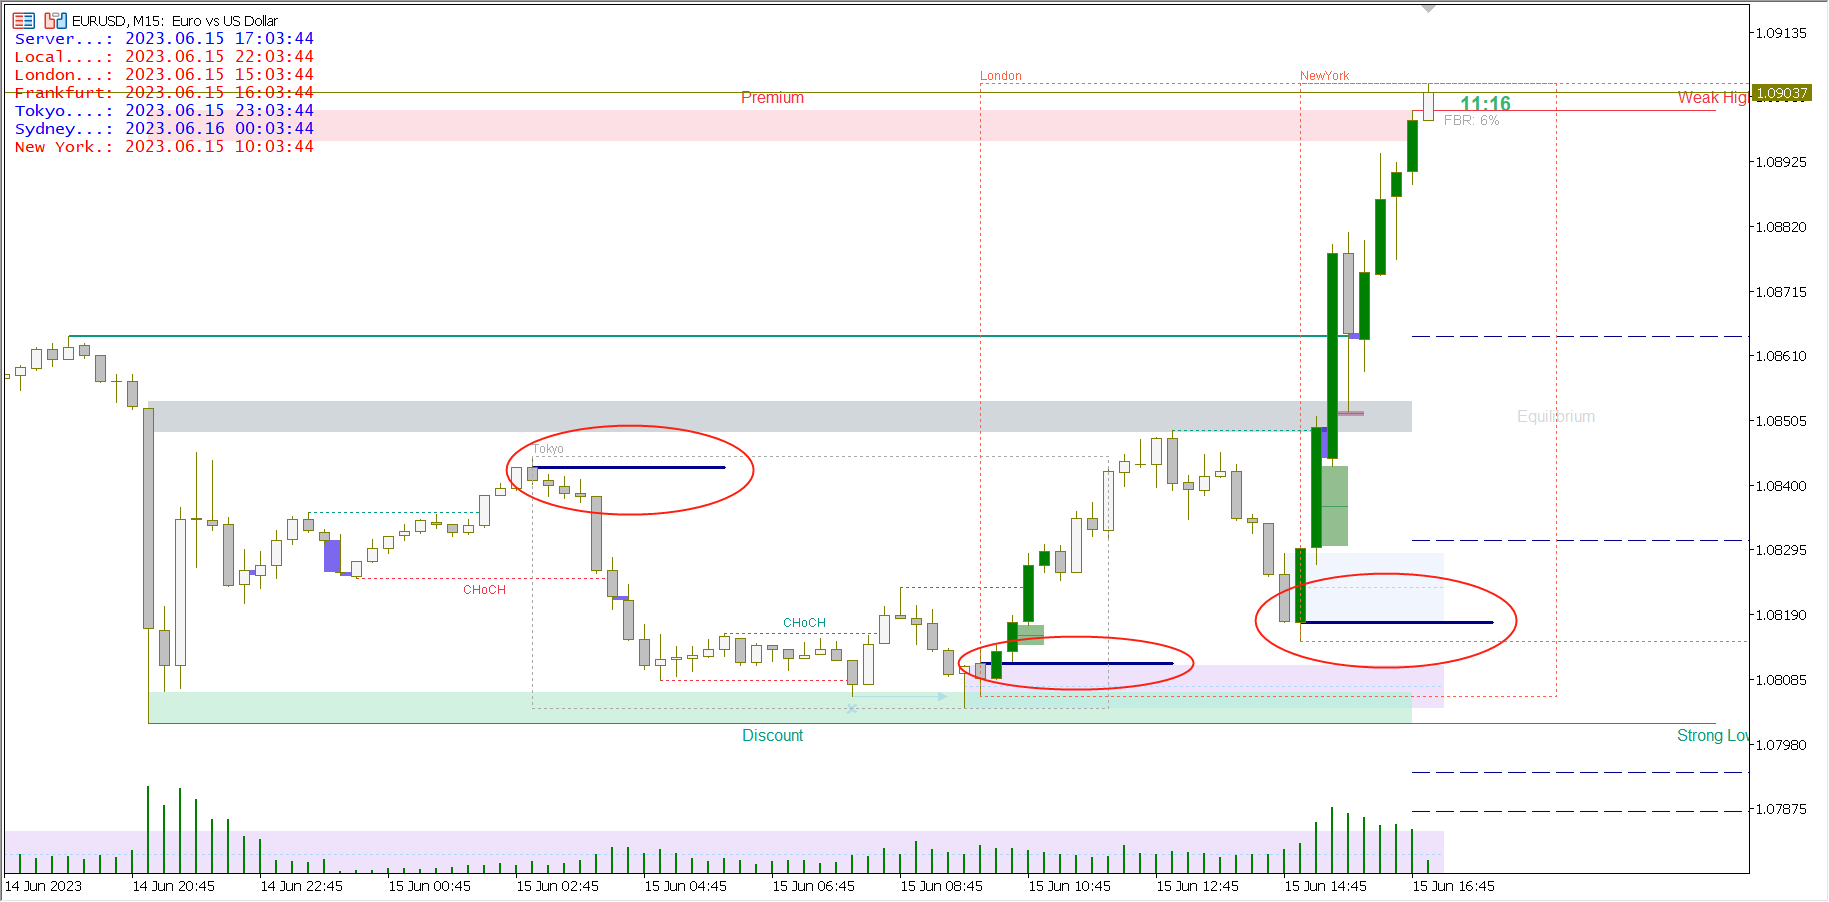
In the indicator function, Strong Imbalance corresponds to the liquidity imbalance of the continuous entity large candles. Liquidity Voids corresponds to the liquidity imbalance of the gap. Fair Value Gaps corresponds to the liquidity imbalance of the fair value gap. Volume imbalance is similar to a Liquidity Void, but its not a true open gap. It has the candle wicks overlapping one another, but the candle bodies are apart.
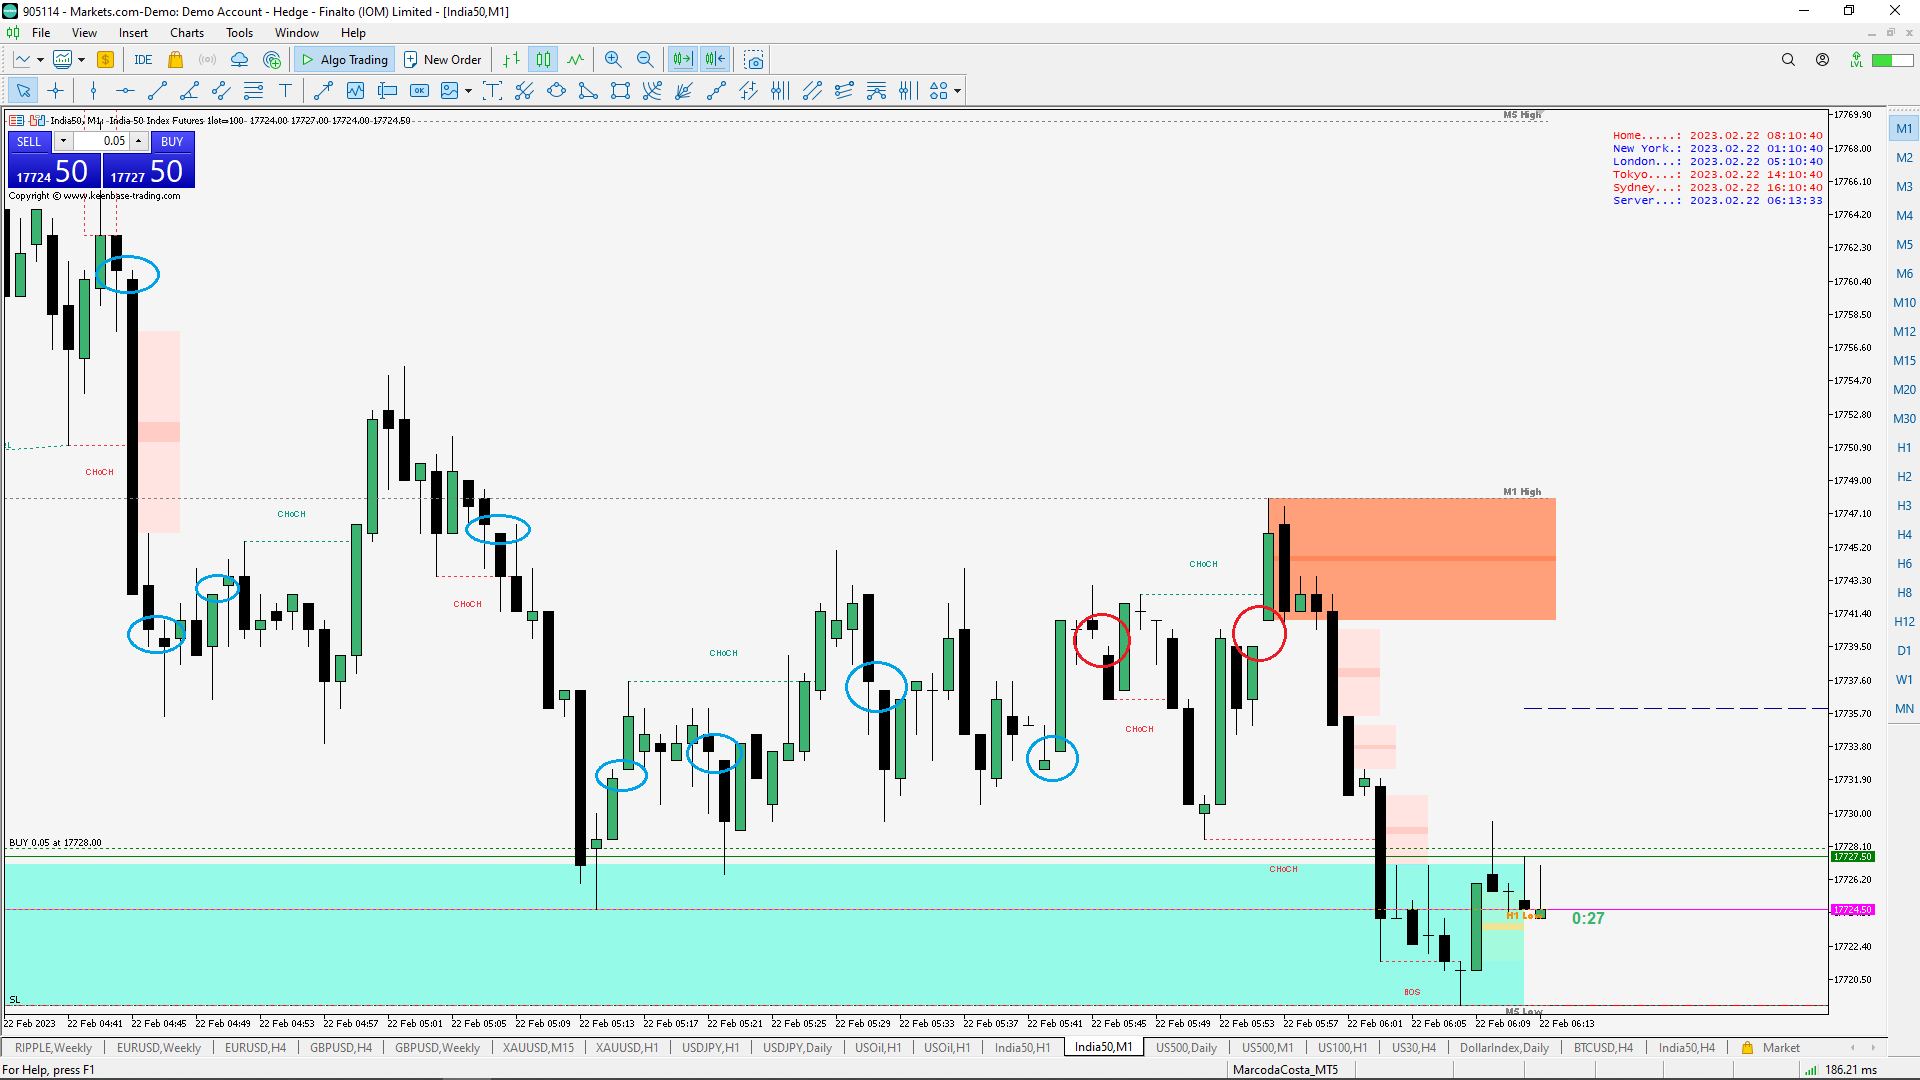
In the figure above, the blue circle shows Volume Imbalance, and the red circle shows Liquidity Void.
Currently, the indicators provide reminders related to FVG, Liquidity Void and Strong Imbalance, and users can set them according to their needs.
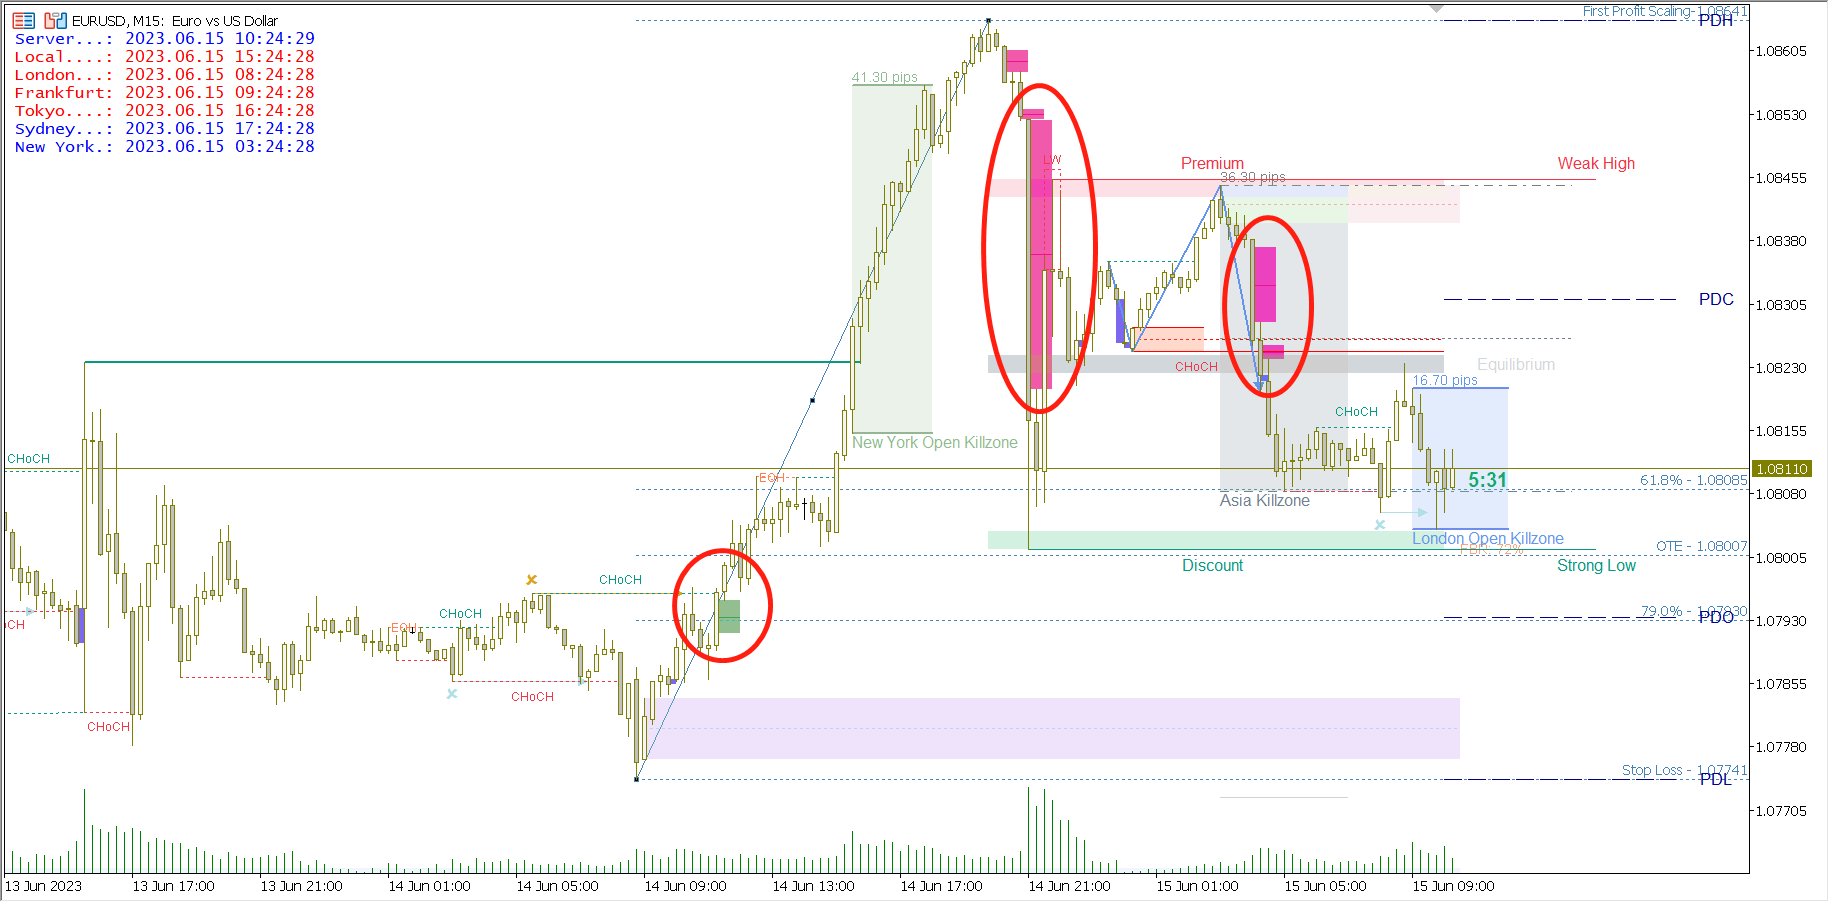
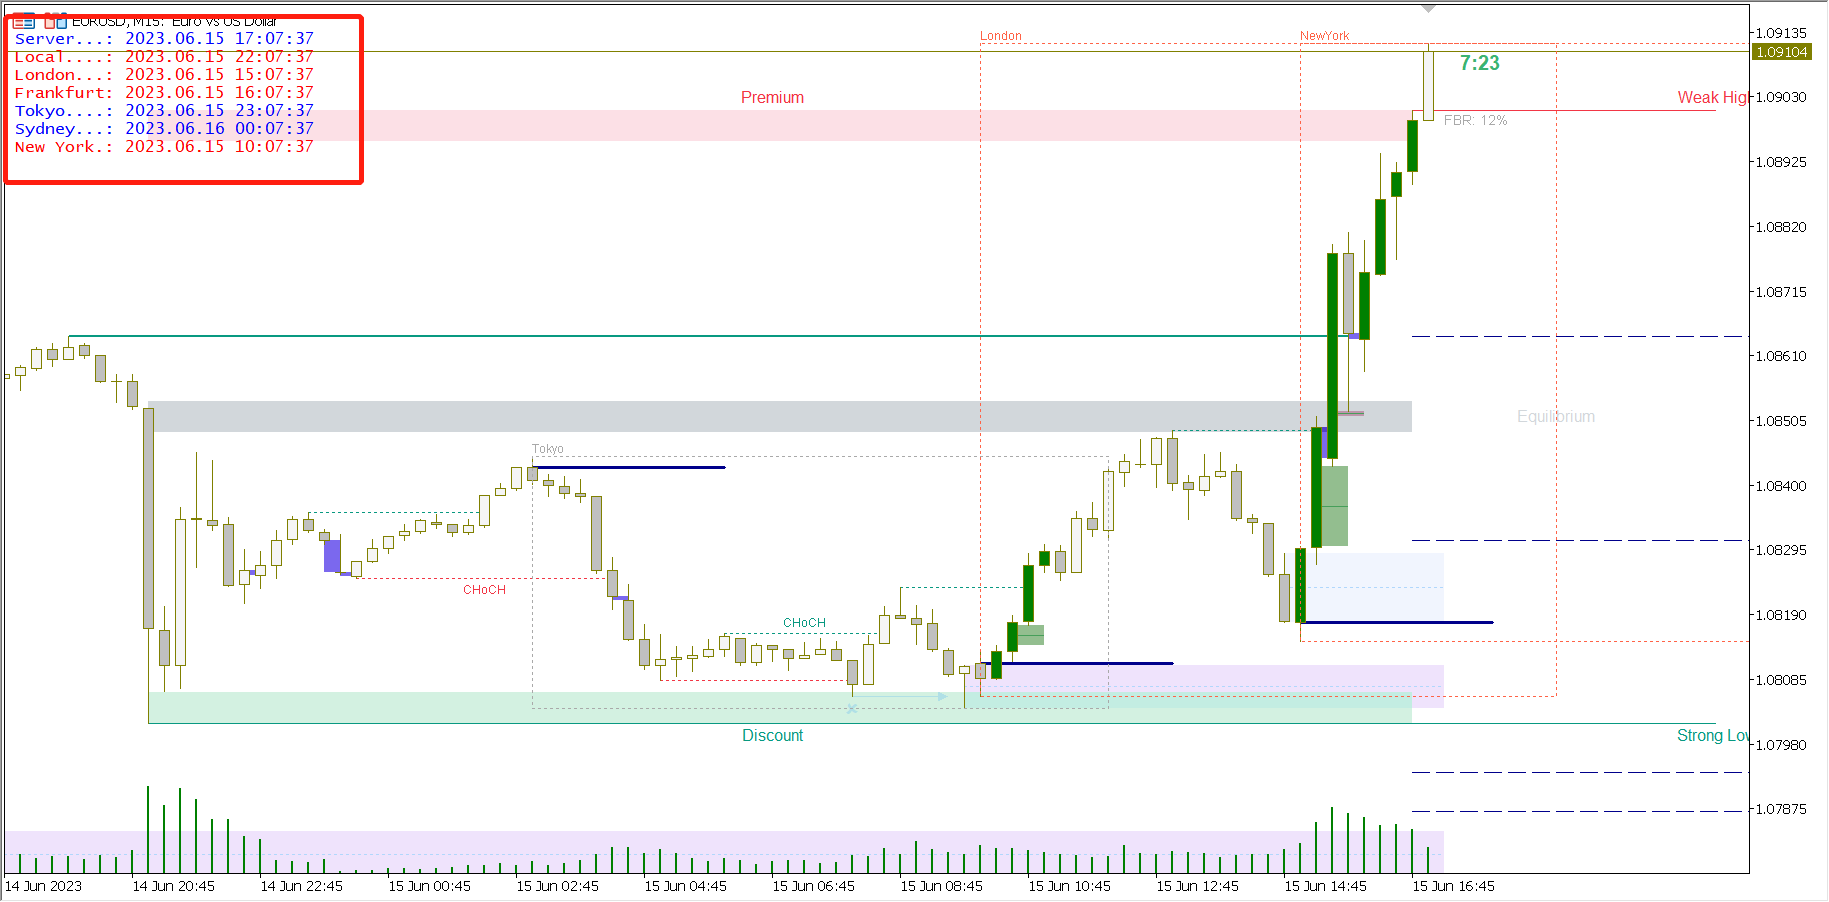
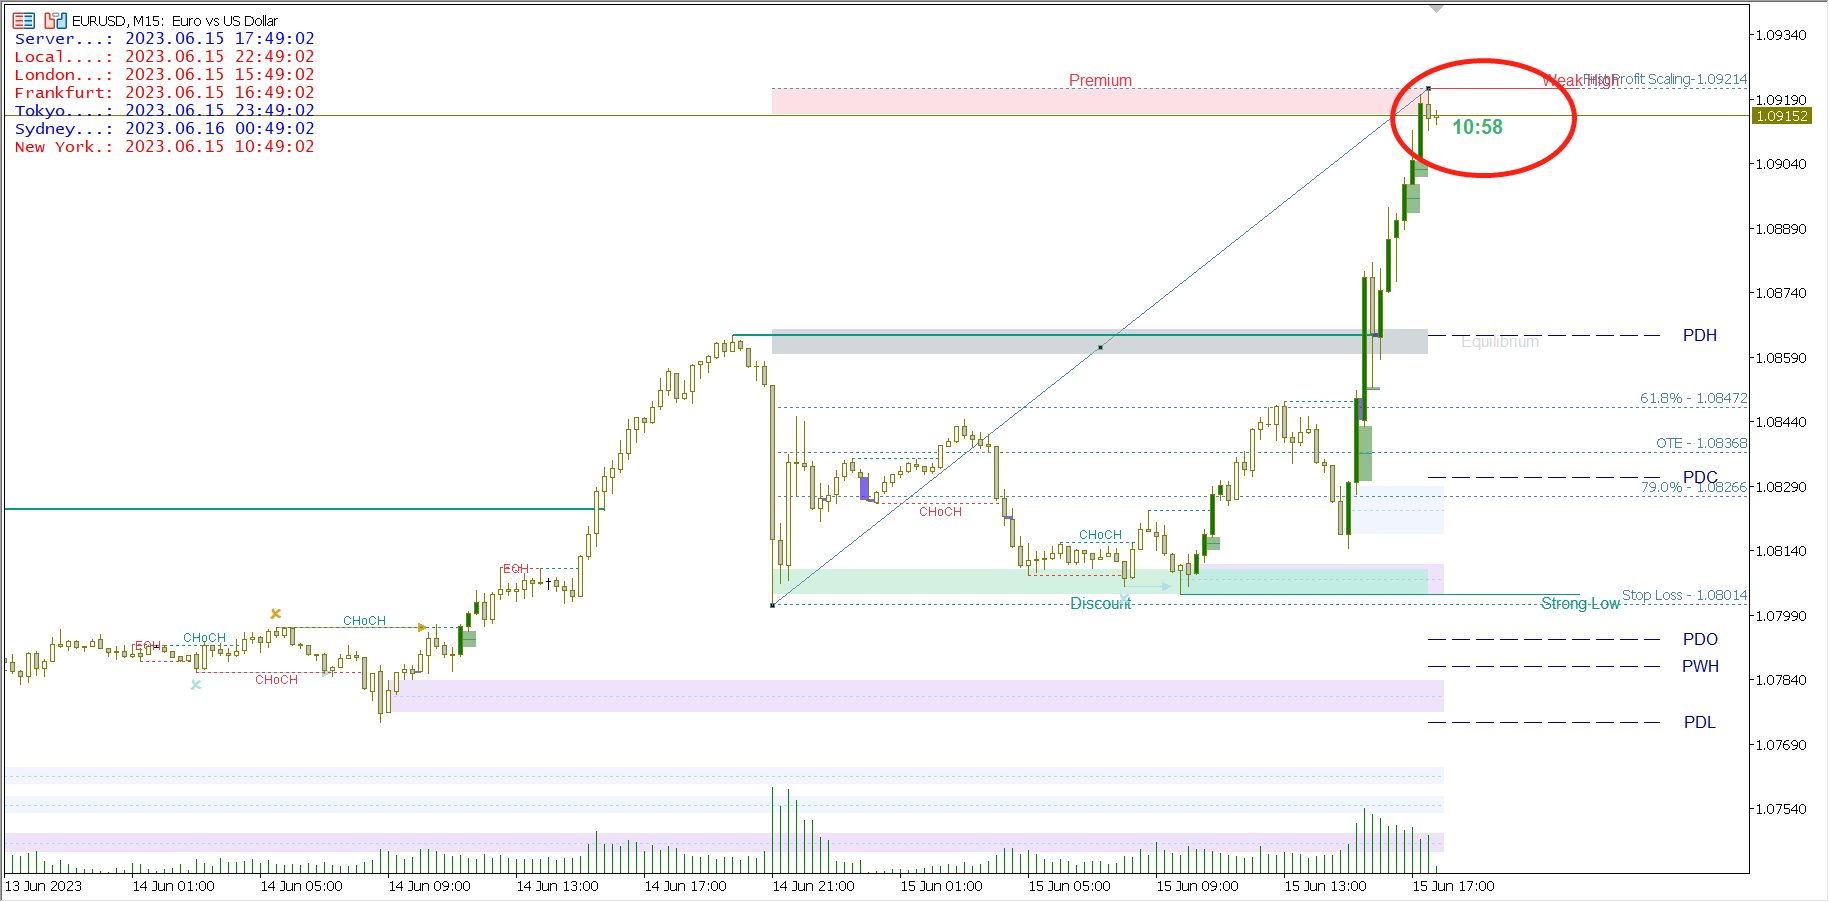
The Strong Imbalance function of MT5 is marked with Colored Candles, as shown in the red circle in the figure below.
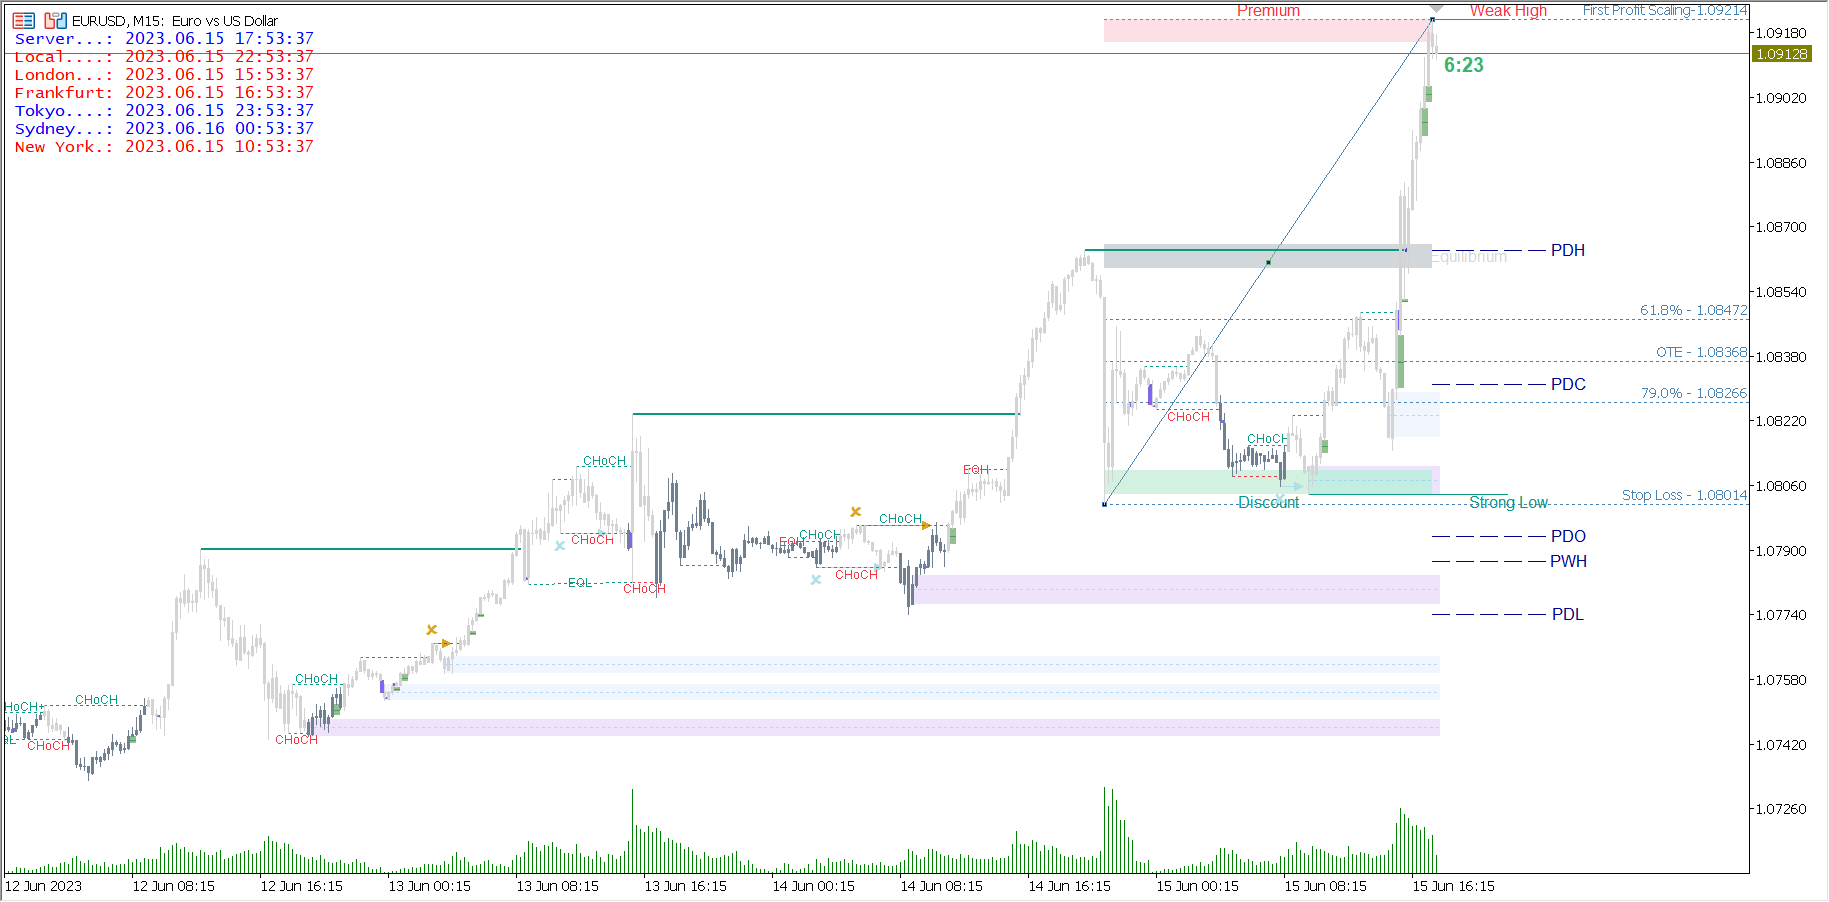
Since MT4 does not support the Colored Candles function, the Strong Imbalance function of the MT4 version of the indicator is marked with a rectangular block, as shown in the red circle in the figure below.
The FVG function supports displaying a higher period FVG on the current period chart, and select a larger period in the Timeframe in the settings.

The FVG Threshold setting filters out smaller FVG blocks. Extend FVG sets the width of how many candles to extend the FVG block to the right. The Extend FVG to current candle setting extends the FVG rectangle to the current candle.
10. BSL/SSL Taken Detect
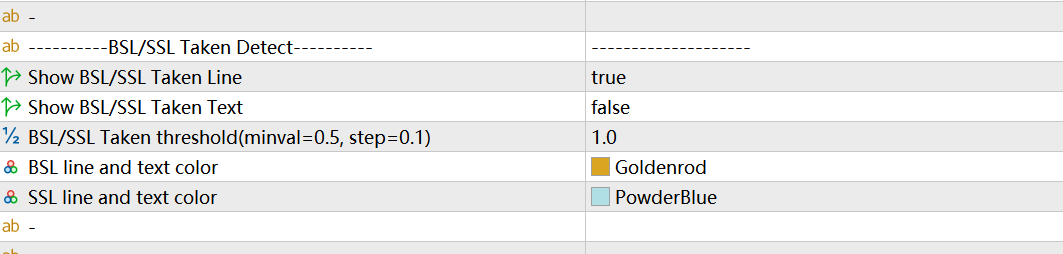
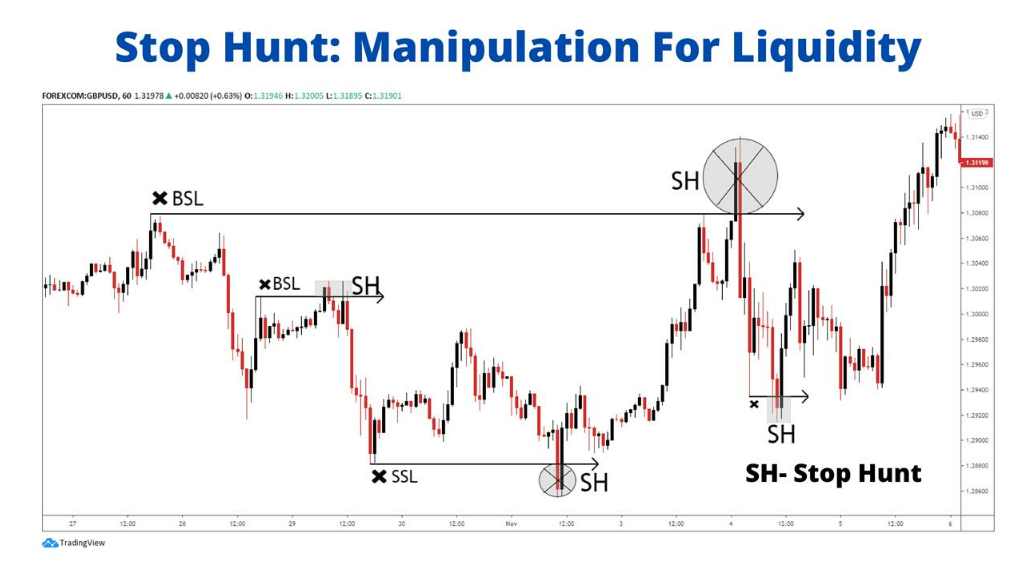
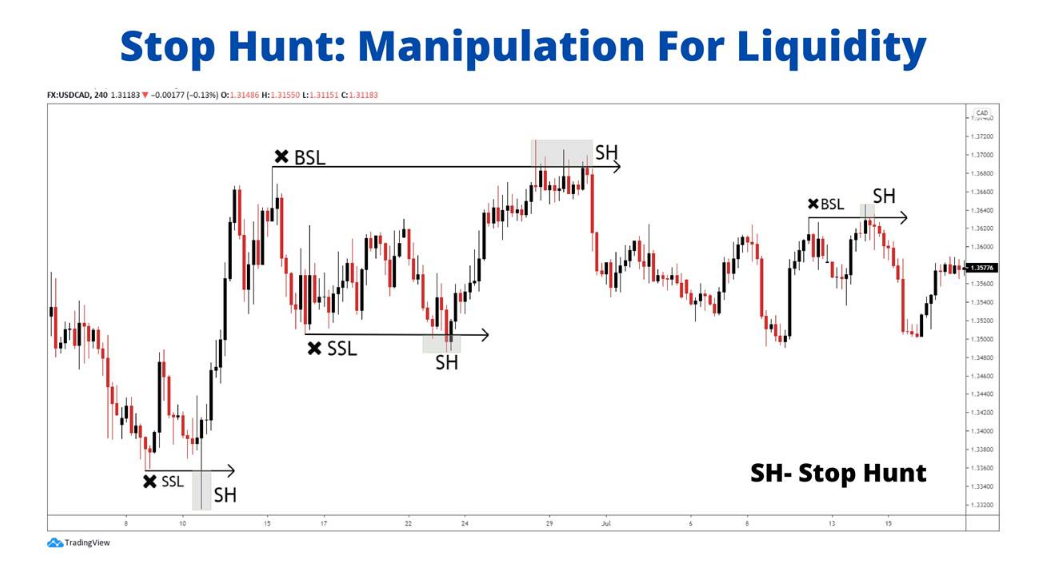
In order to apply to all sizes of cycles, the BSL/SSL function of the indicator is only calculated using the previous high/low points, and does not specifically use the PDH/PDL/PWH/PWL/PMH/PML points for calculation. Due to the limitations of the algorithm, the BSL/SSL automatically marked by the indicators will not be very accurate, please use it in combination with practical experience.
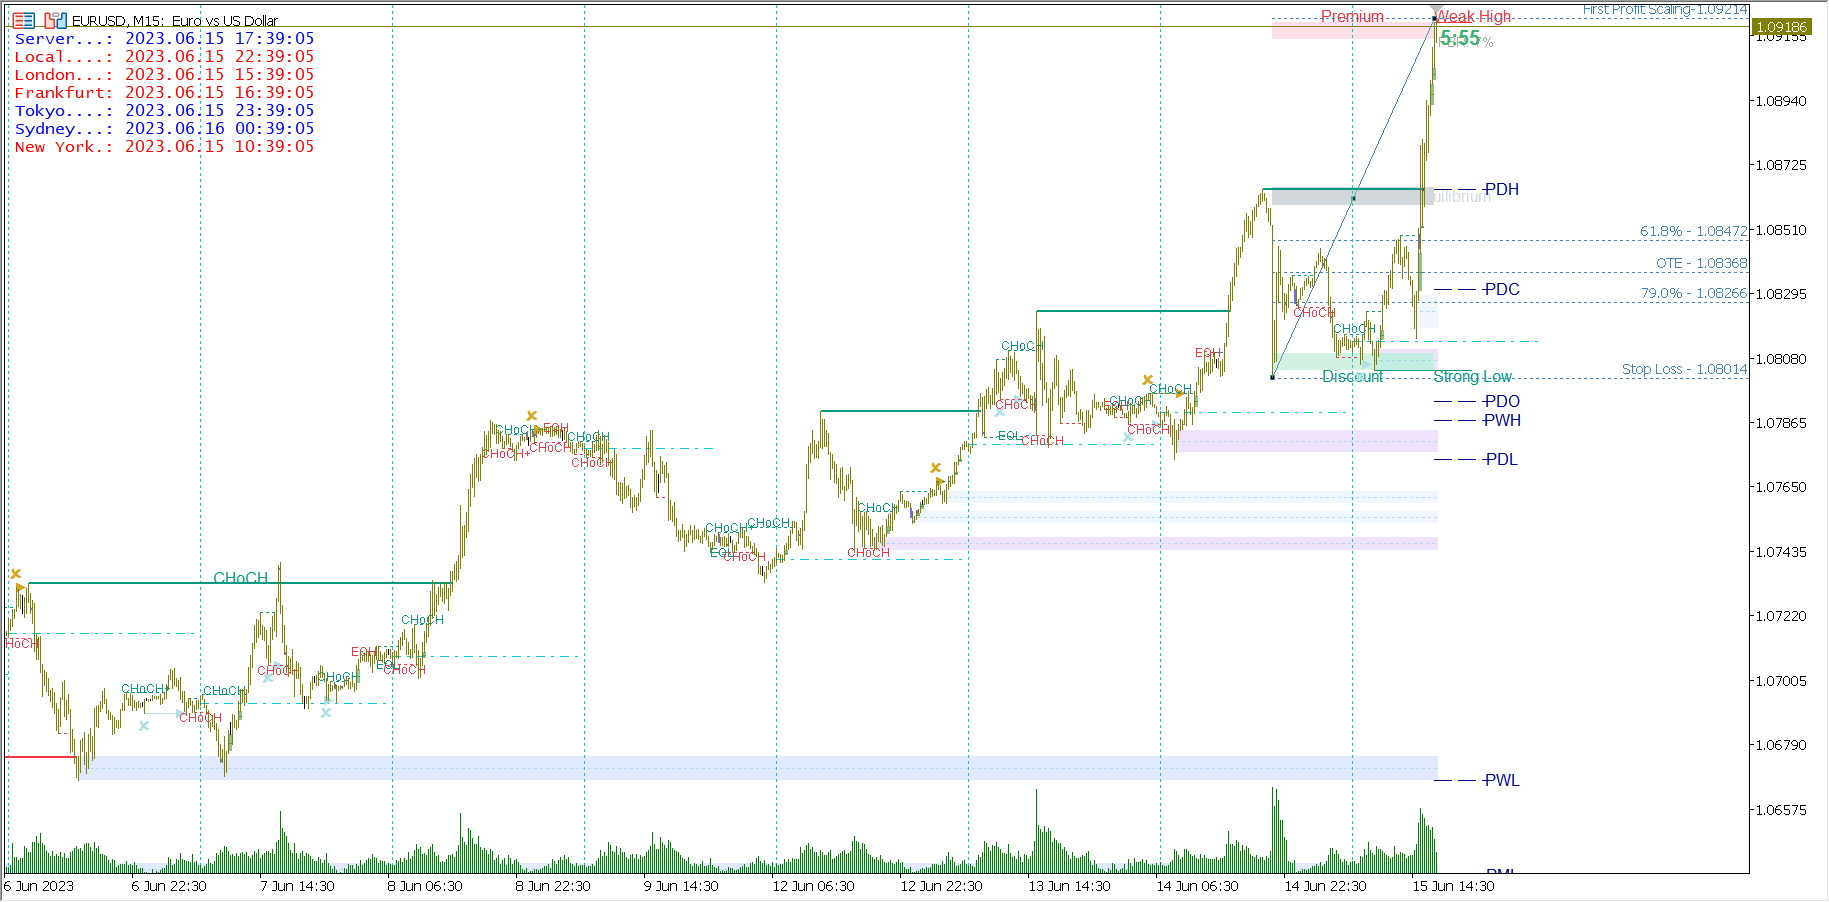
11. Premium/Discount Zones
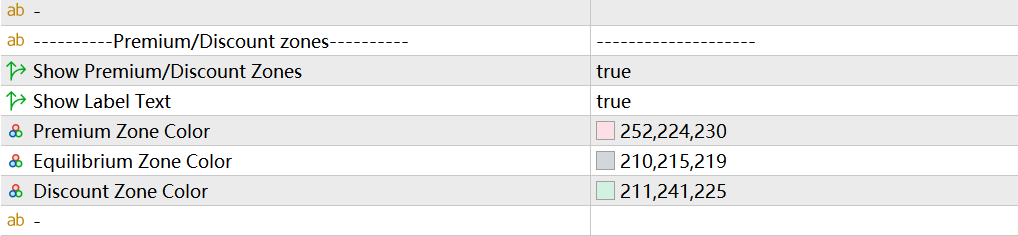
Please read the Order Flow Strategies chapter in the SMC article shared on the Indicators page, which covers value balancing.
Here, the indicator uses recent swing highs/lows as parameters for calculating premium and discount zones.
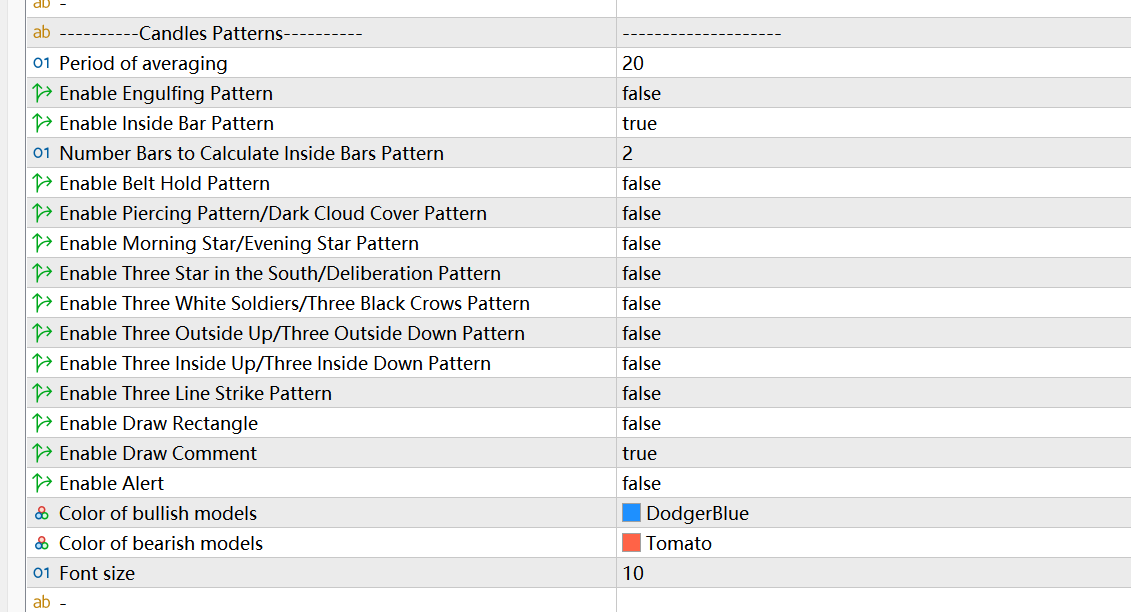
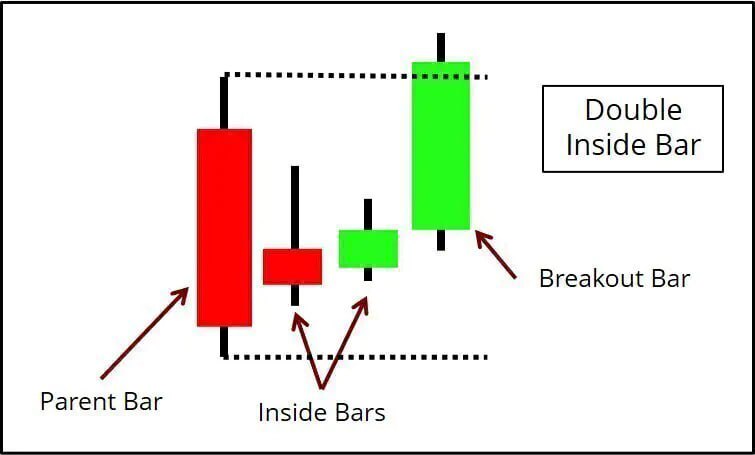
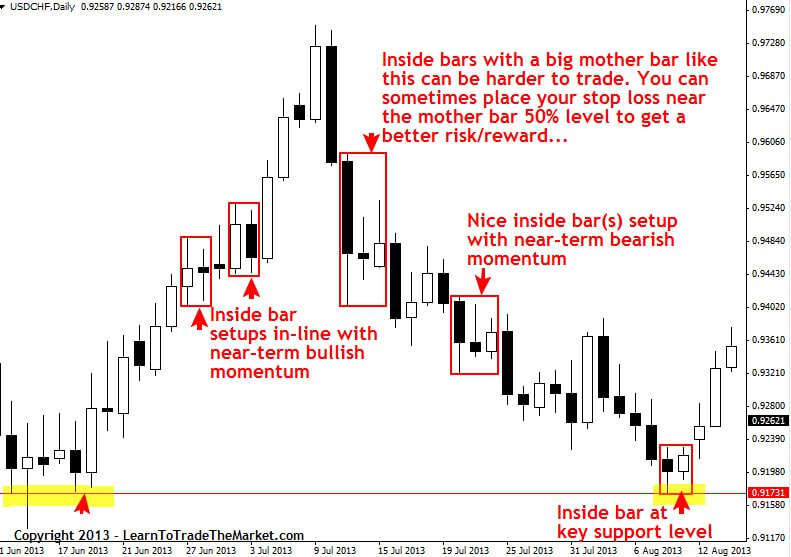
12.Candles Patterns
12. Previous Day/Week/Monthly High/Low and Previous Day Open/Close
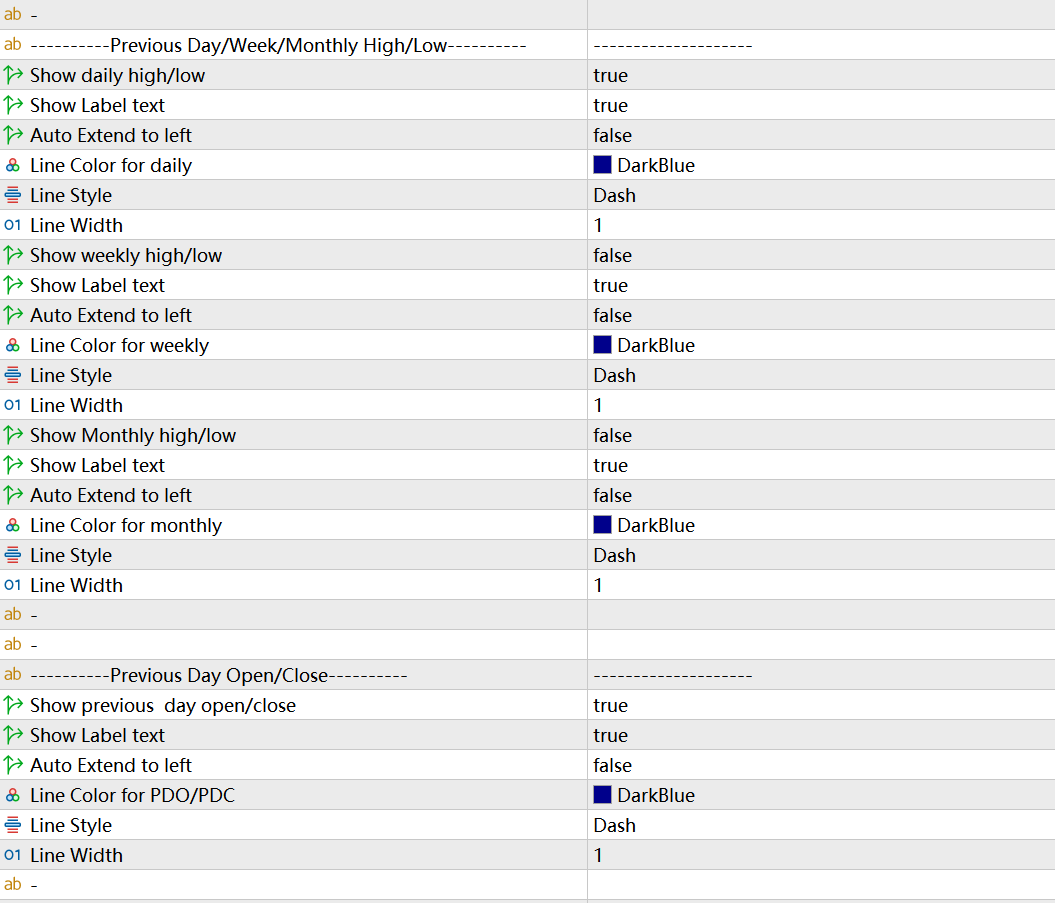
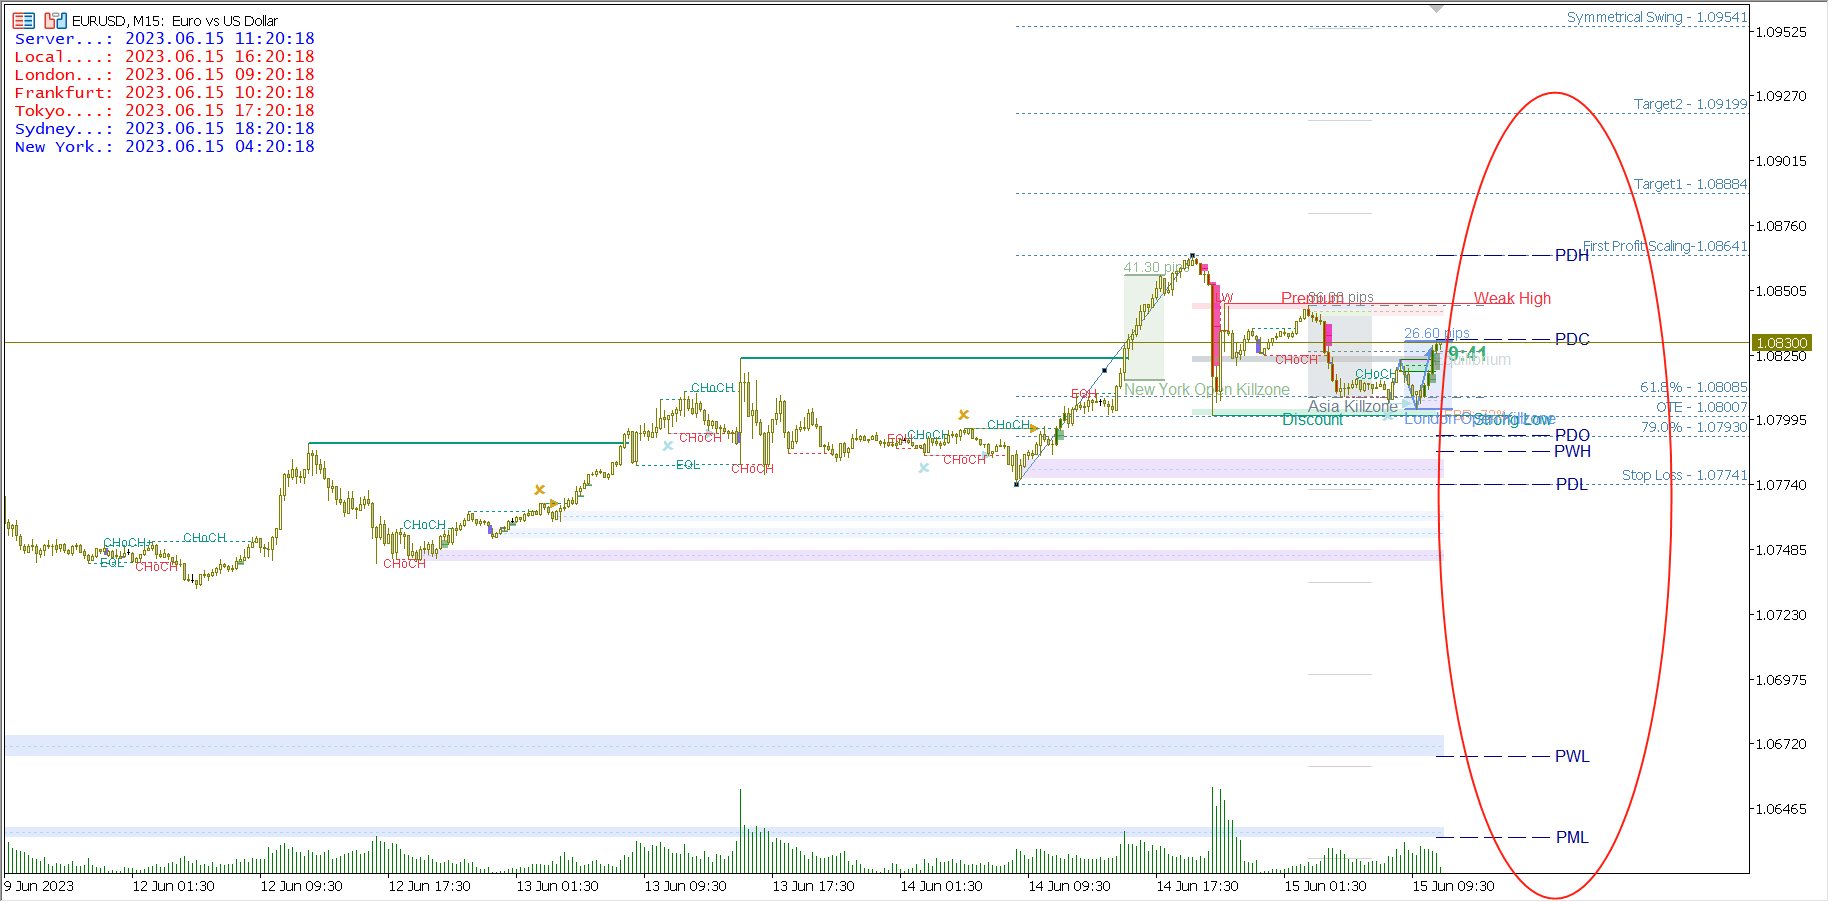
By default, the indicator uses a Dash line to mark these important positions on the right side of the current Candle. Users can set the style, width and color of this line segment. The indicator also supports setting to automatically extend the line to the left by a certain distance. Assuming it is PDH, then if Auto extend to left is set to true, the indicator will automatically extend the line of PDH to the left by a distance of one day.
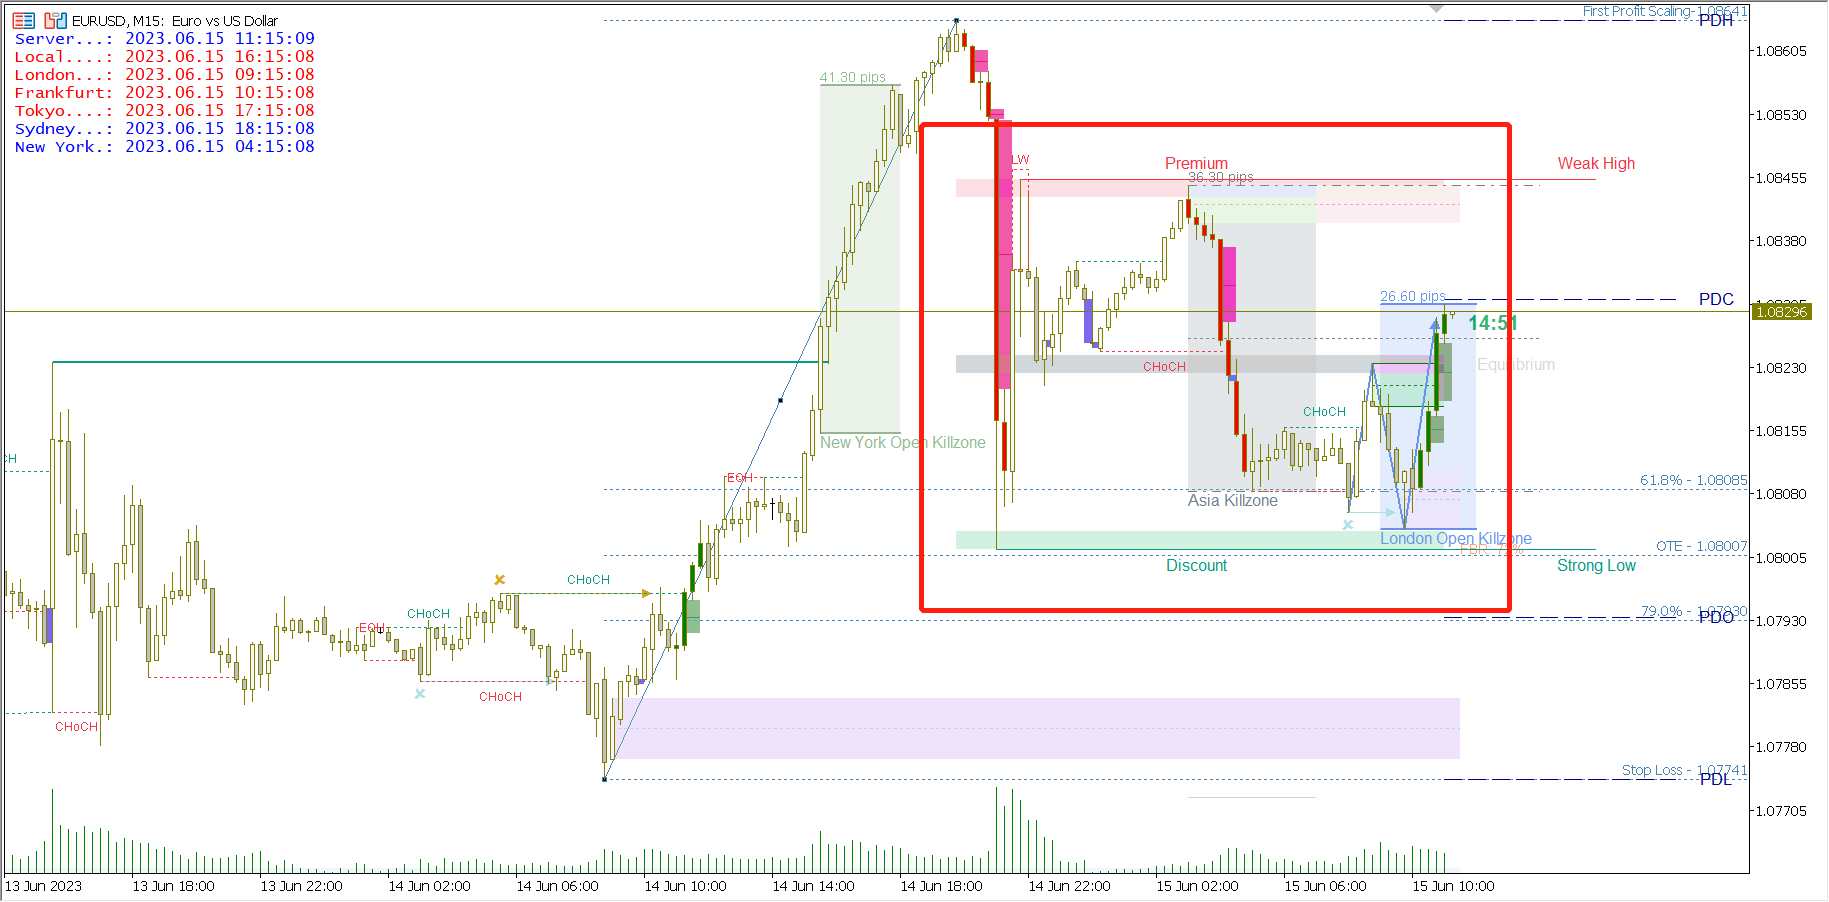
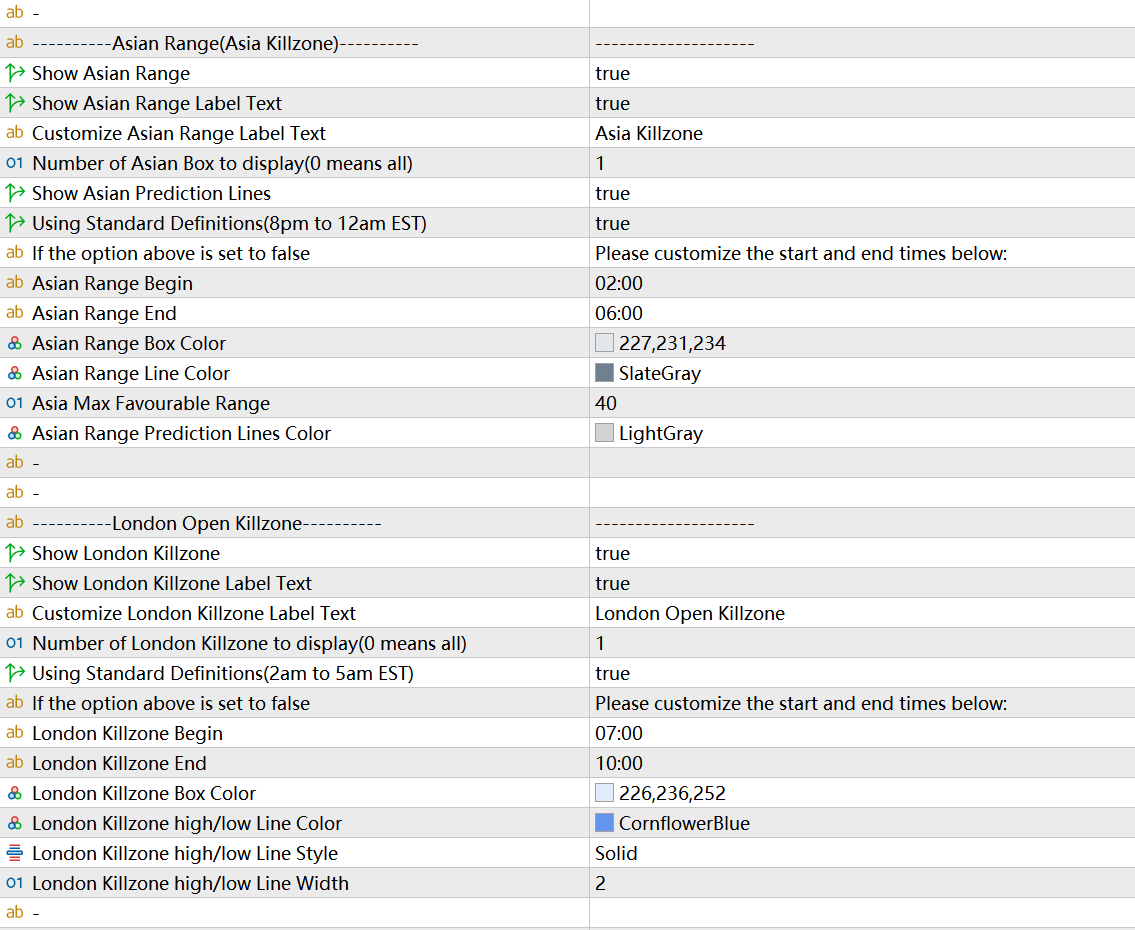
13. Market Time Session
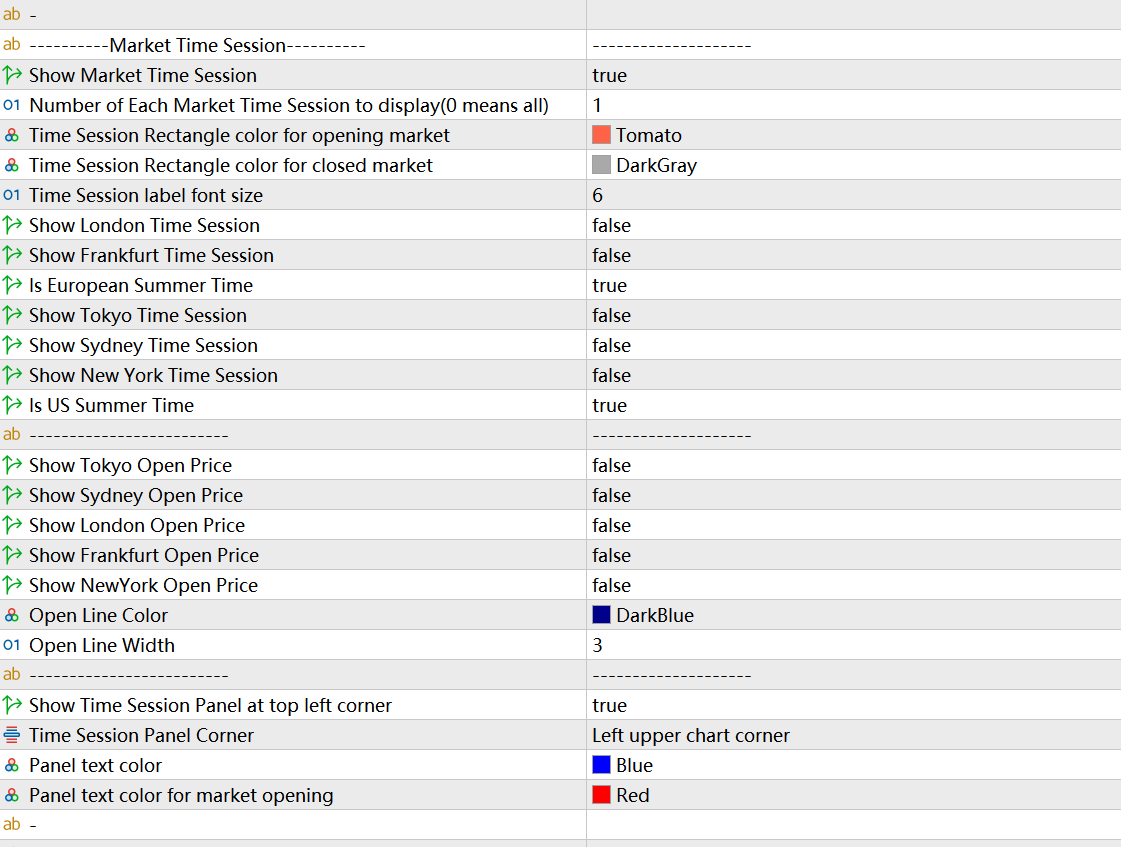
This function automatically marks the specified foreign exchange market trading time session on the chart for the user. The indicator uses a dotted rectangular box to mark the start and end ranges of a given forex market as well as the high and low points during the trading hours of this market. 5 major foreign exchange market time sessions for users to choose from. London, Frankfurt, Tokyo, Sydney, New York. If your time zone is the European time zone, Is European Summer Timer sets whether it is currently European summer time. If your time zone is US Time, Is US Summer Time sets whether it is currently US Summer Time.
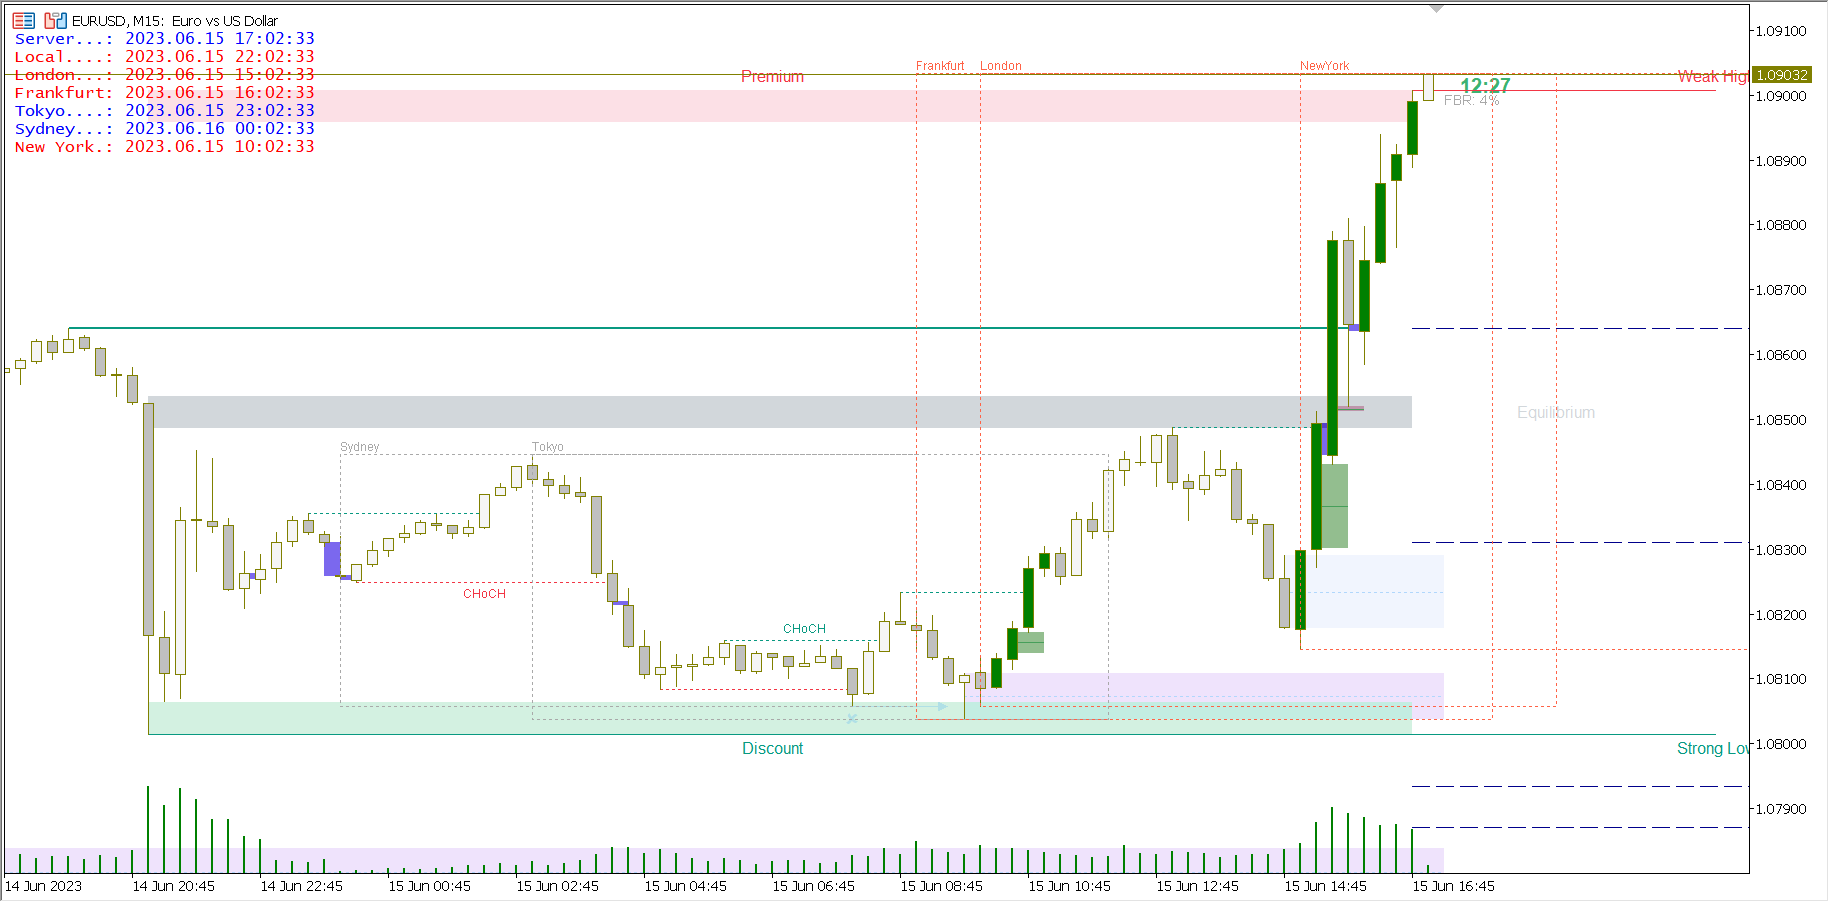
Users can choose whether to display the opening price of each foreign exchange market according to their needs. By default, it will be marked by a thicker line. Users can set the line width and line color.
Show Time Session Panel at top left corner sets whether to display the Time Session Panel, and can be set to display the Time Session Panel at the four corners of the chart.
14. NY Midnight Open
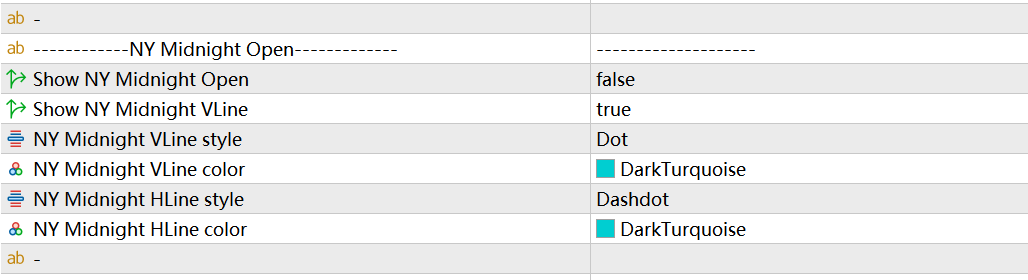
This function automatically draws the opening price of ICT New York midnight and the vertical dividing line at that time for the user.
The price at 12 o'clock in the morning of New York time is a position that intraday traders are very concerned about . If the price trades above this position, it can be considered Bullish. If the price trades below this position, it can be considered Bearish.
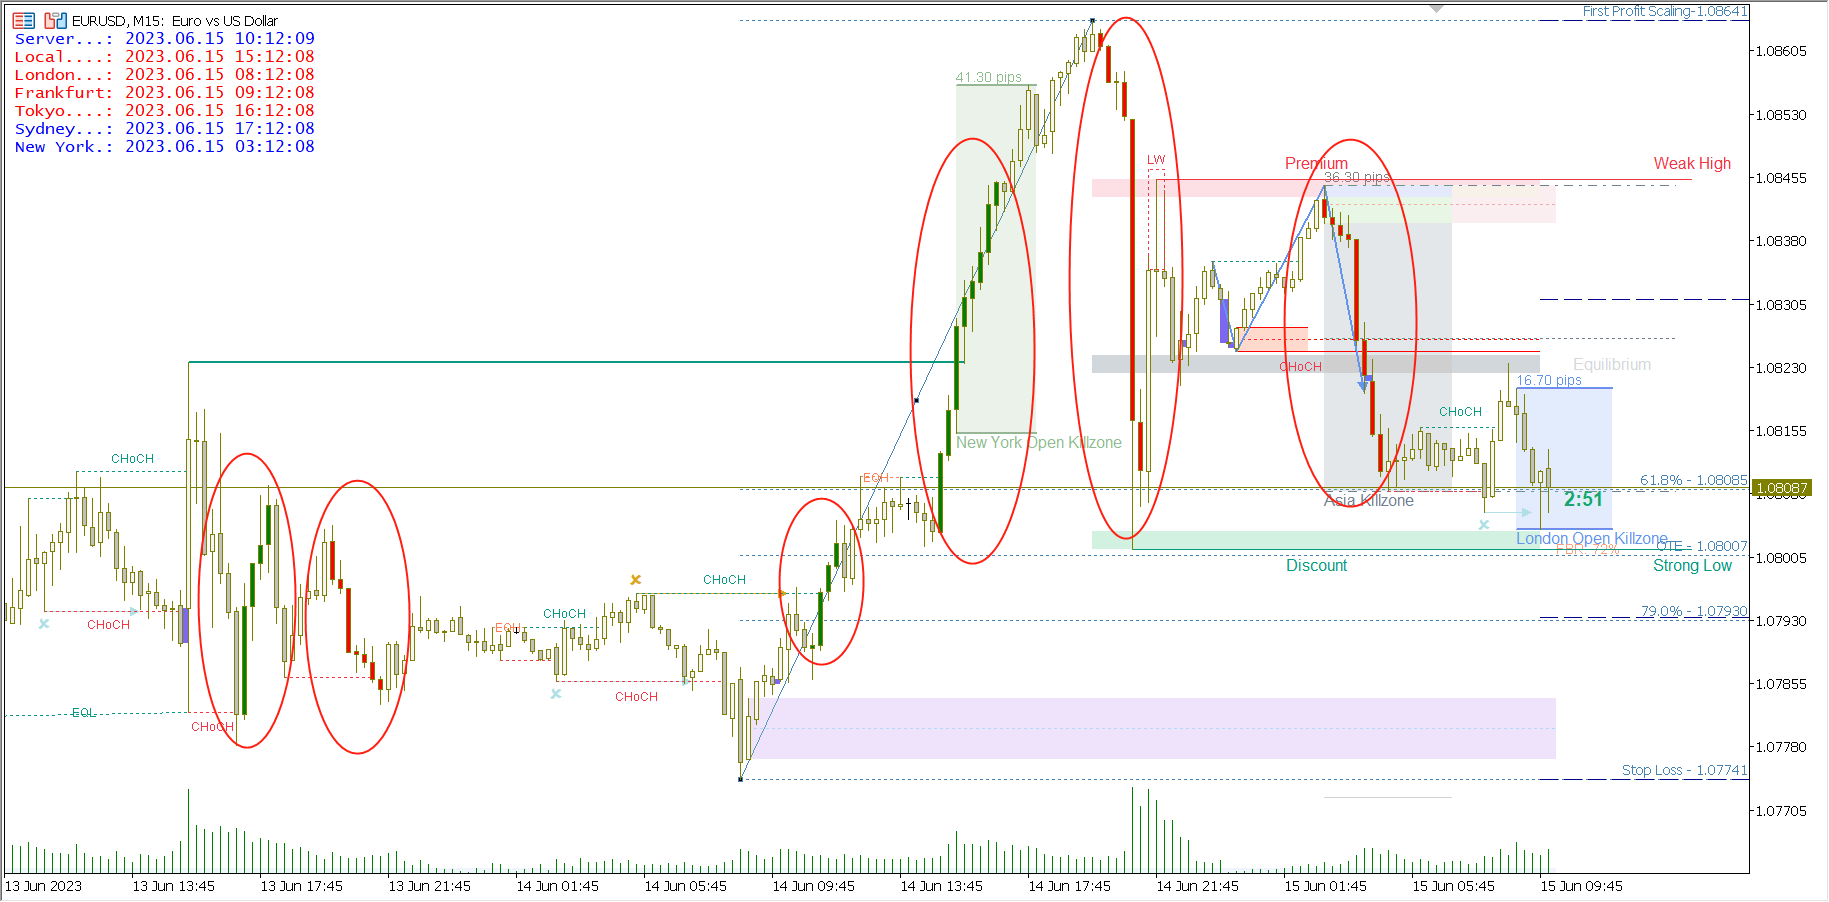
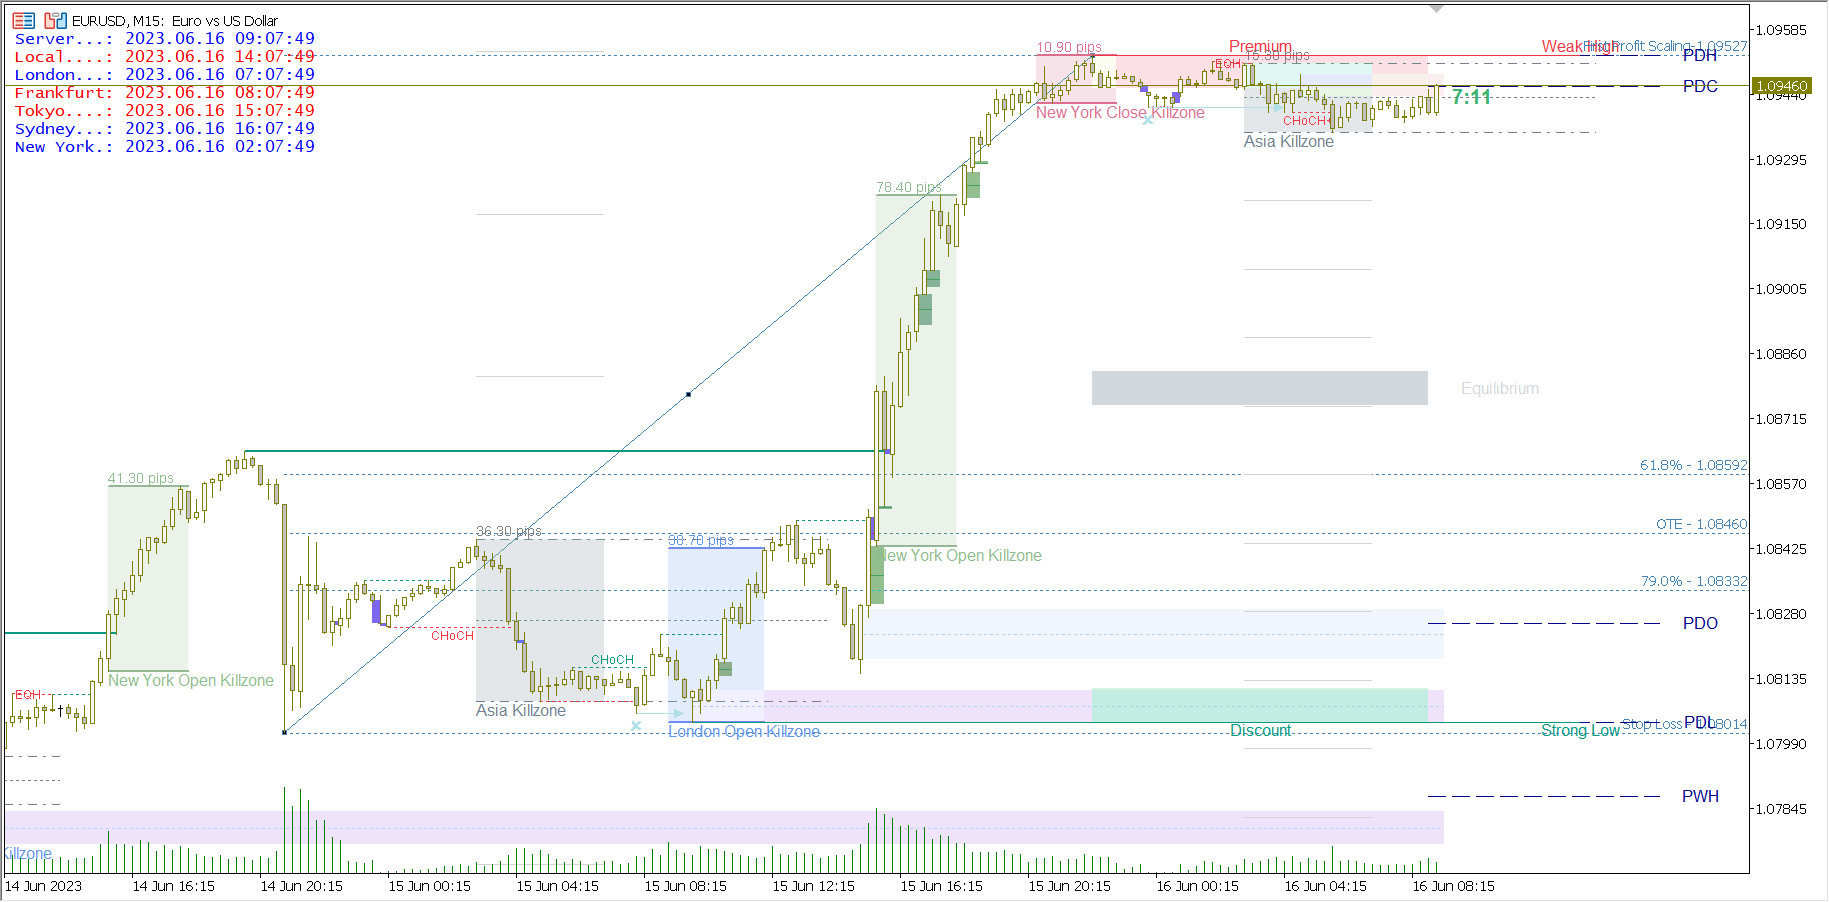
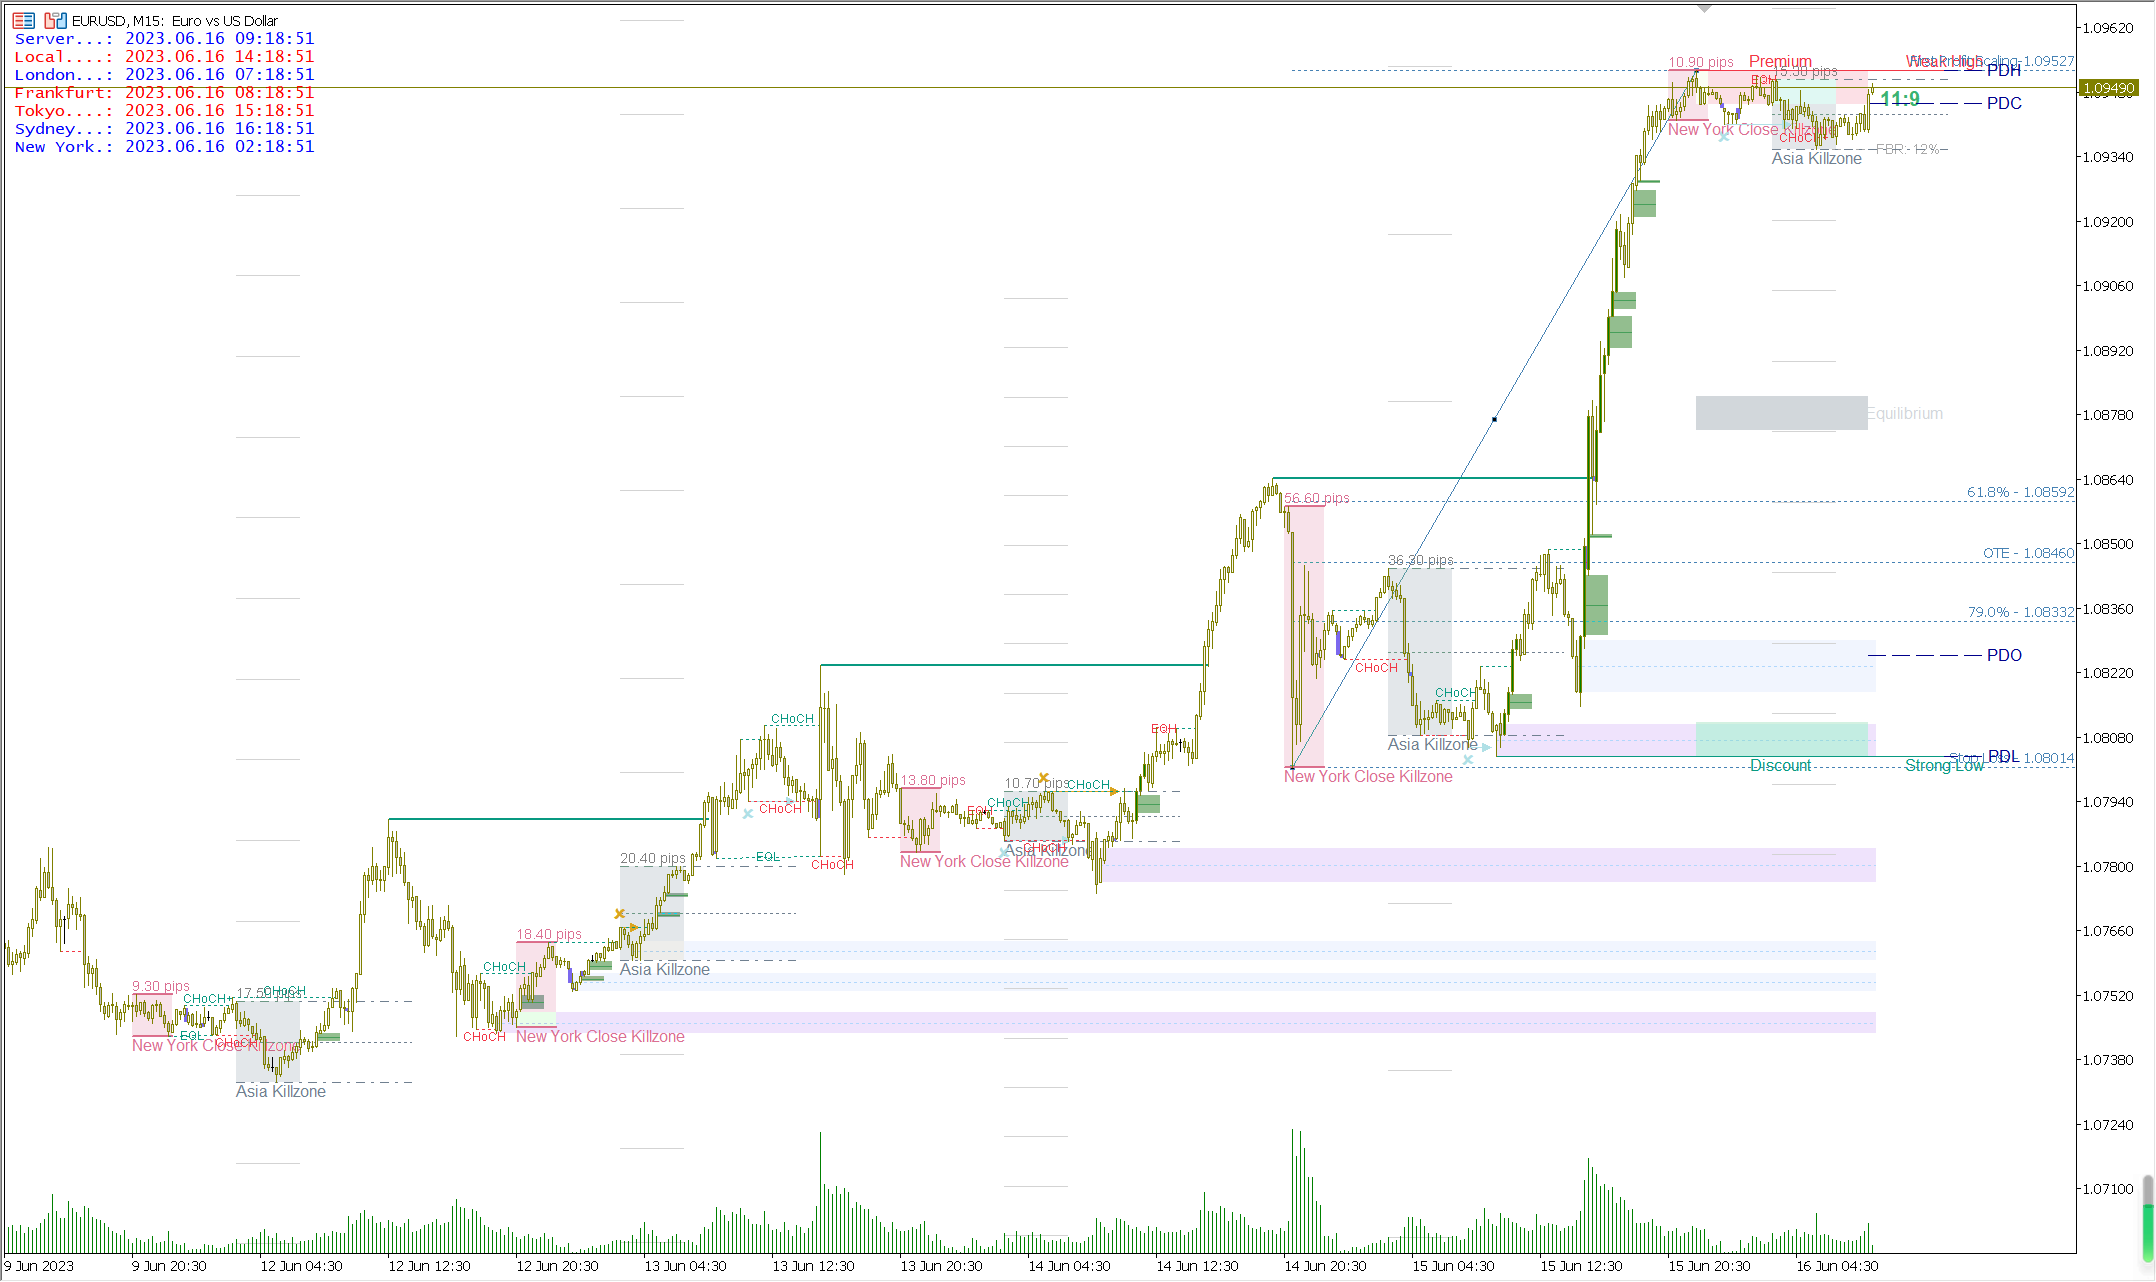
15. Asian Range(Asia Killzone), London Open Killzone, London Close Killzone, New York Open Killzone, New York Close Killzone
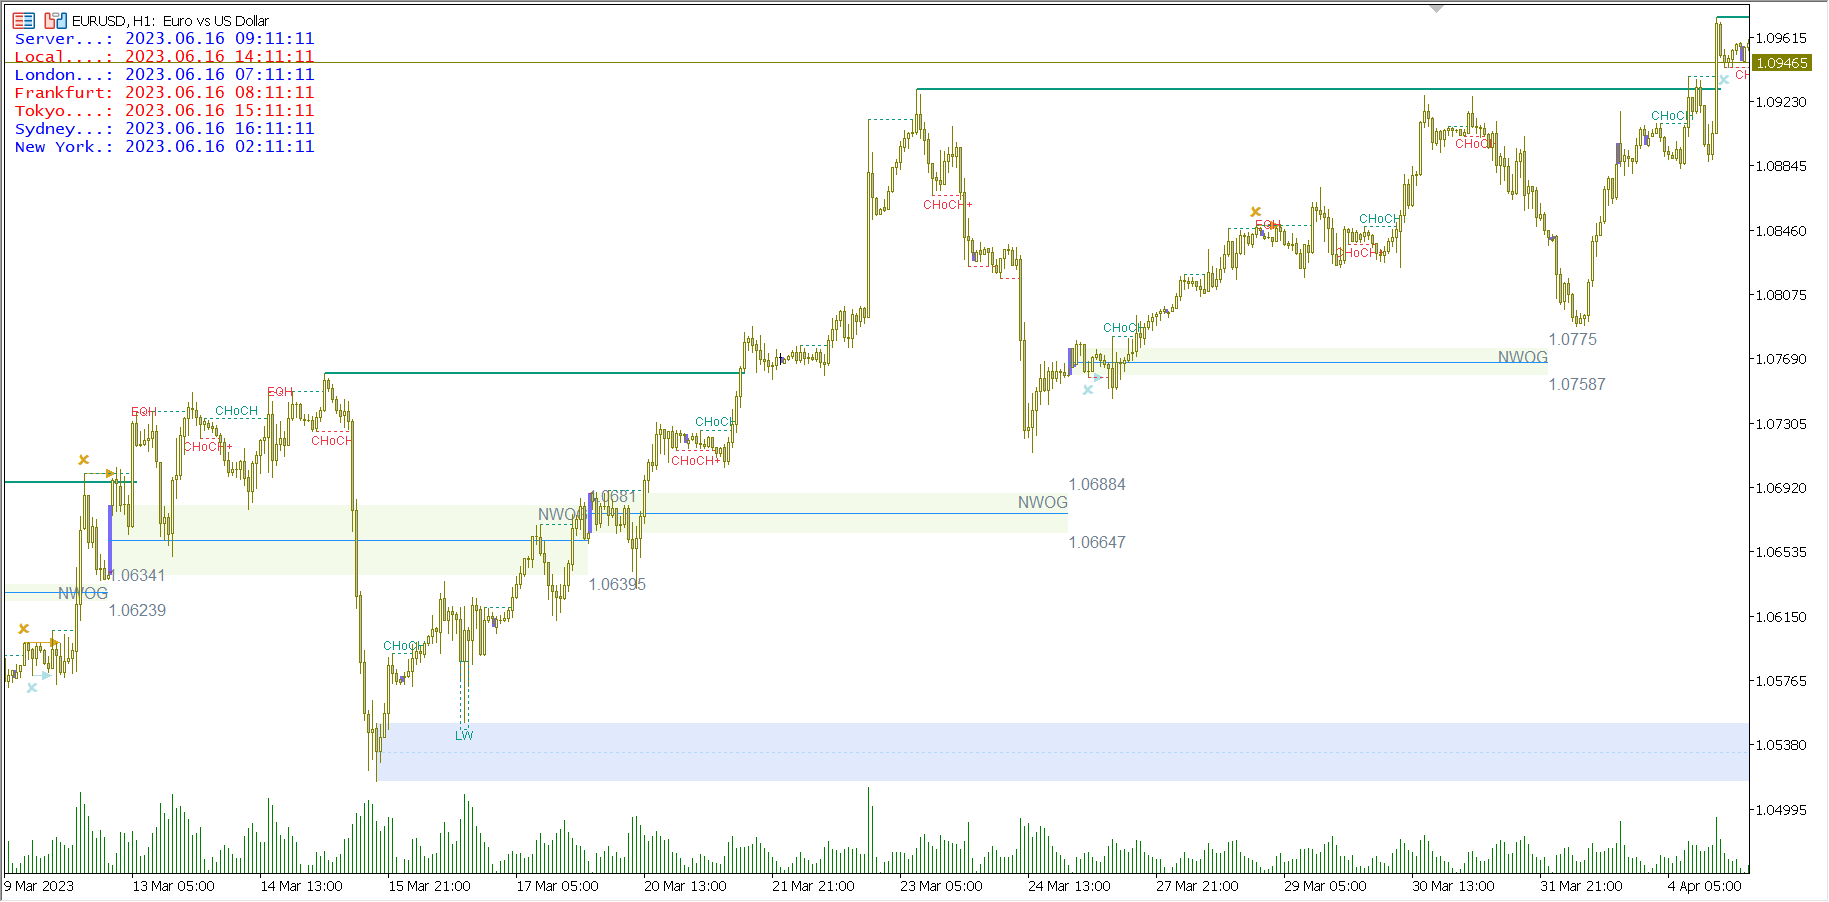
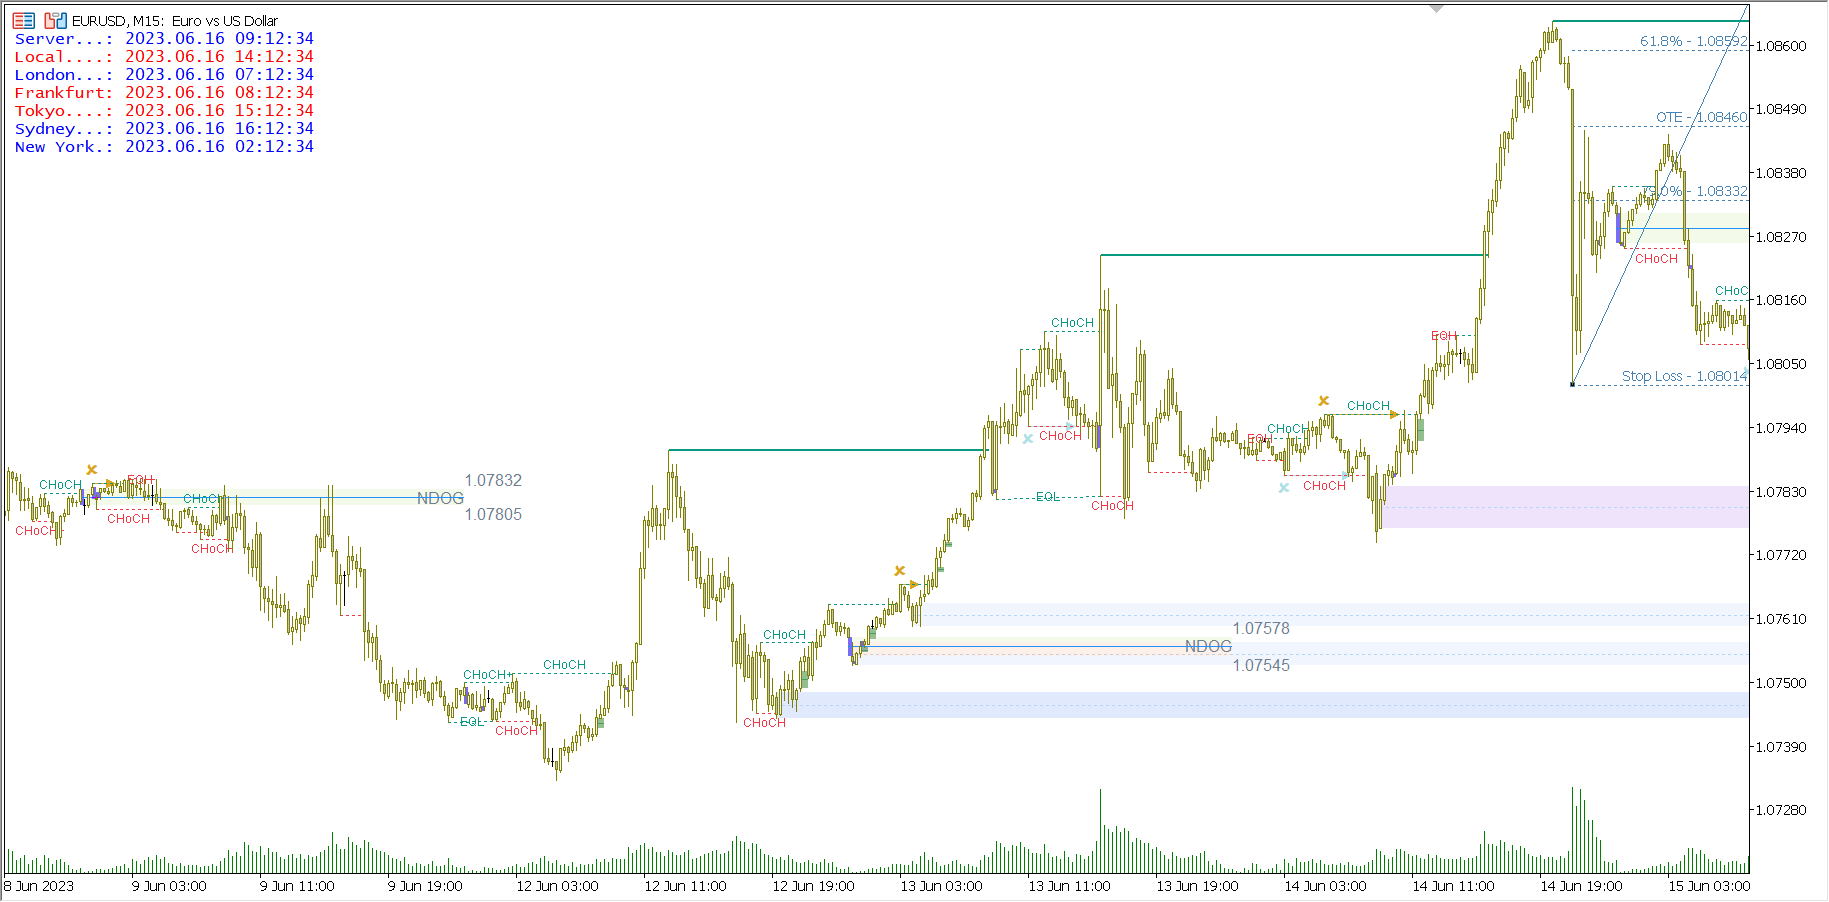
16. NWOG/NDOW
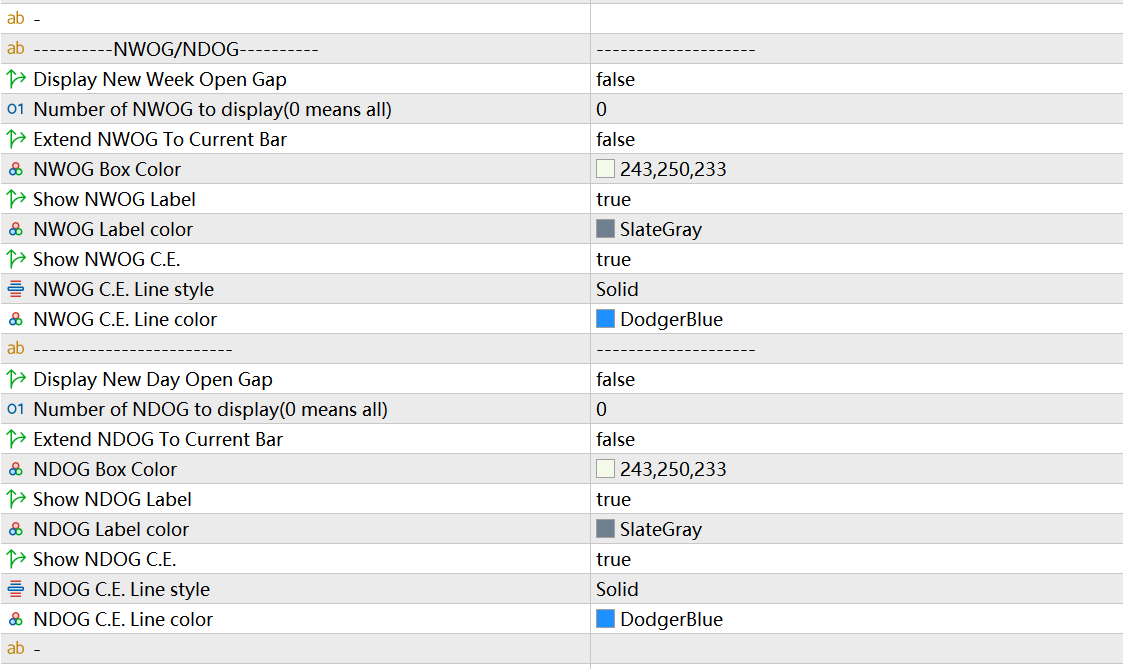
17. Candle Timer
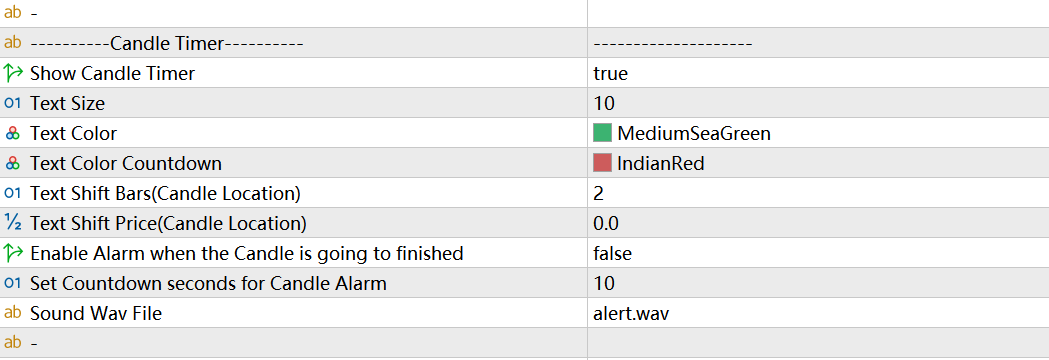
This feature displays a candle countdown for the user in real time. Users can set the display position, horizontal direction (Bars Shift), vertical direction (Price Shift). An alarm can be set for the countdown, such as an alarm at the last 10 seconds.
18. Draw Candles By Trend
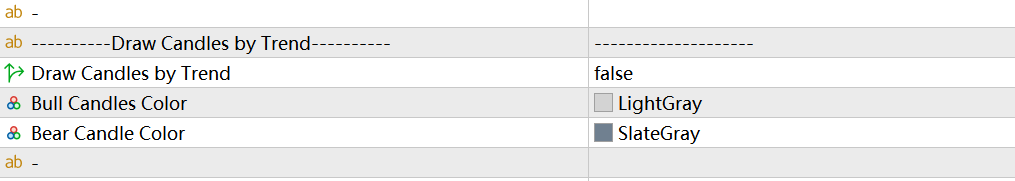
This function judges whether the current trend is bullish or bearish according to the internal structure. If it is bullish, then all candles will be colored with bull color, if it is bearish, all candles will be colored with bear color.
19. Alerts
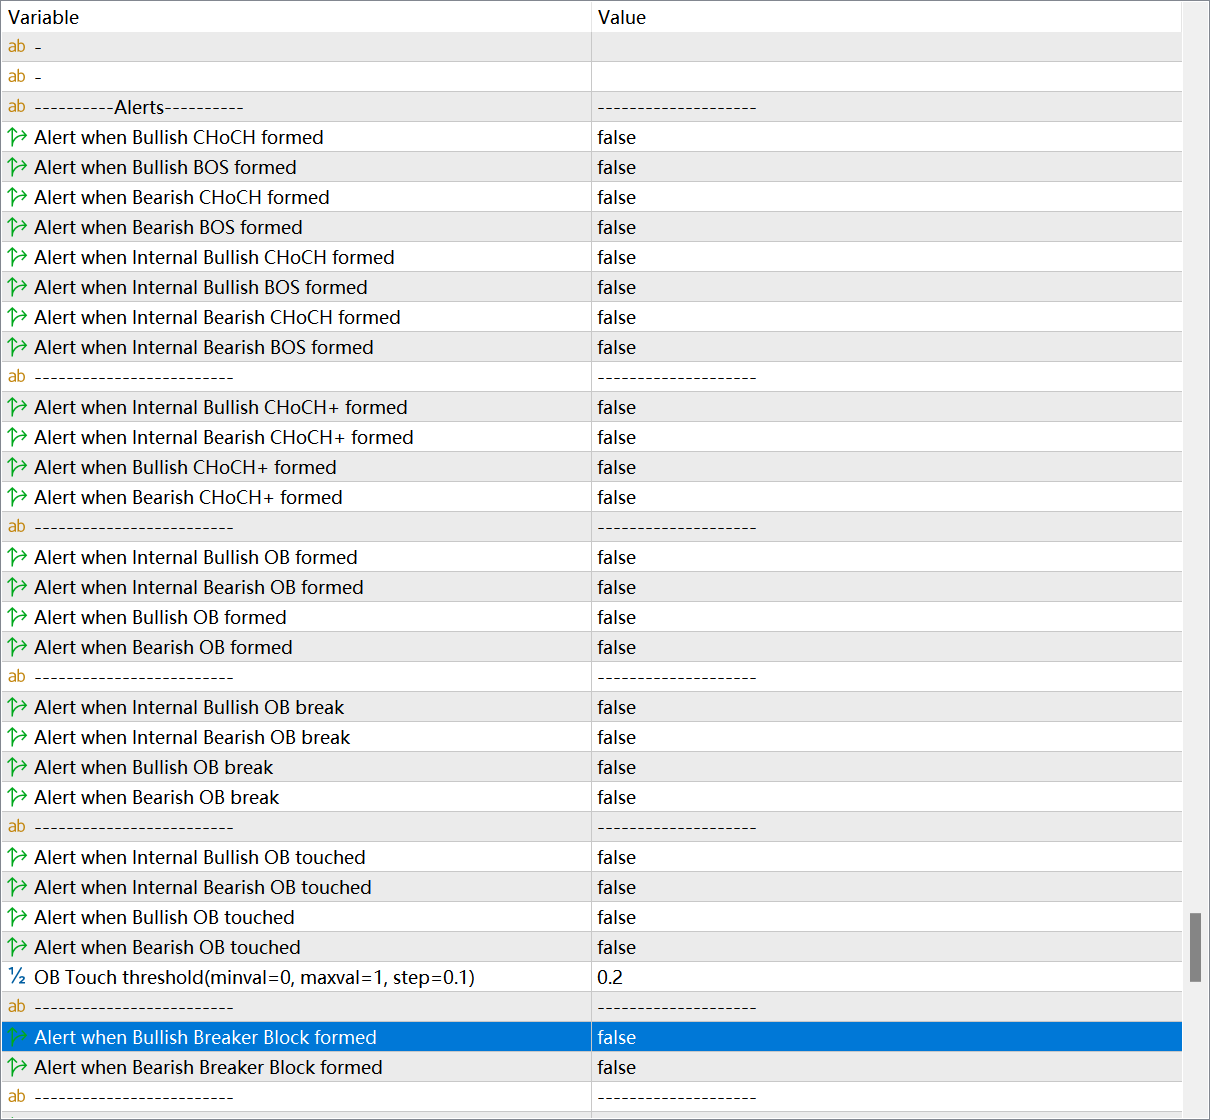
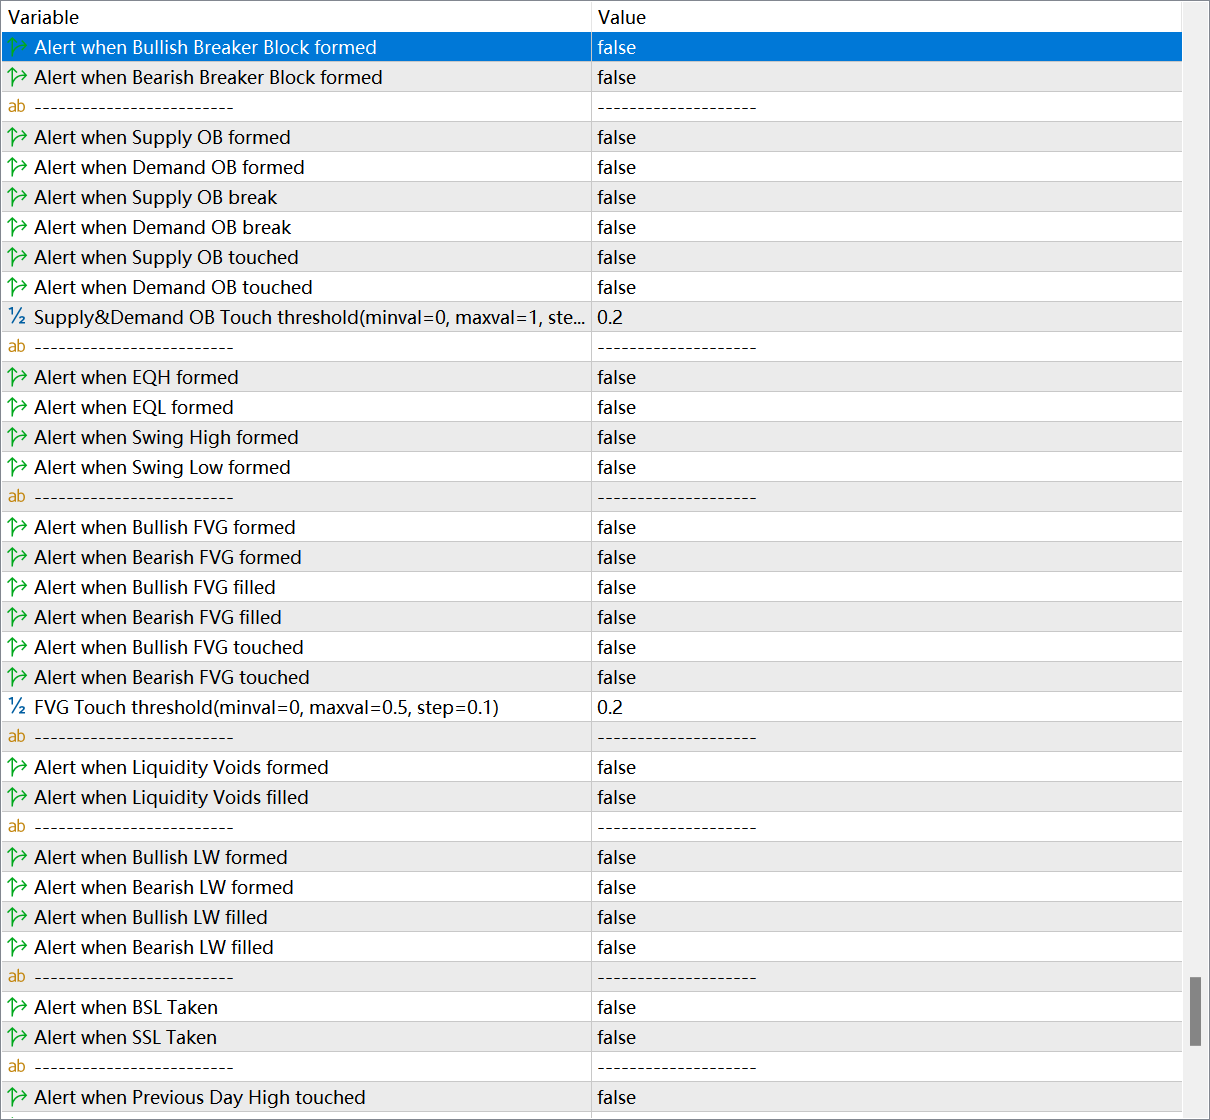
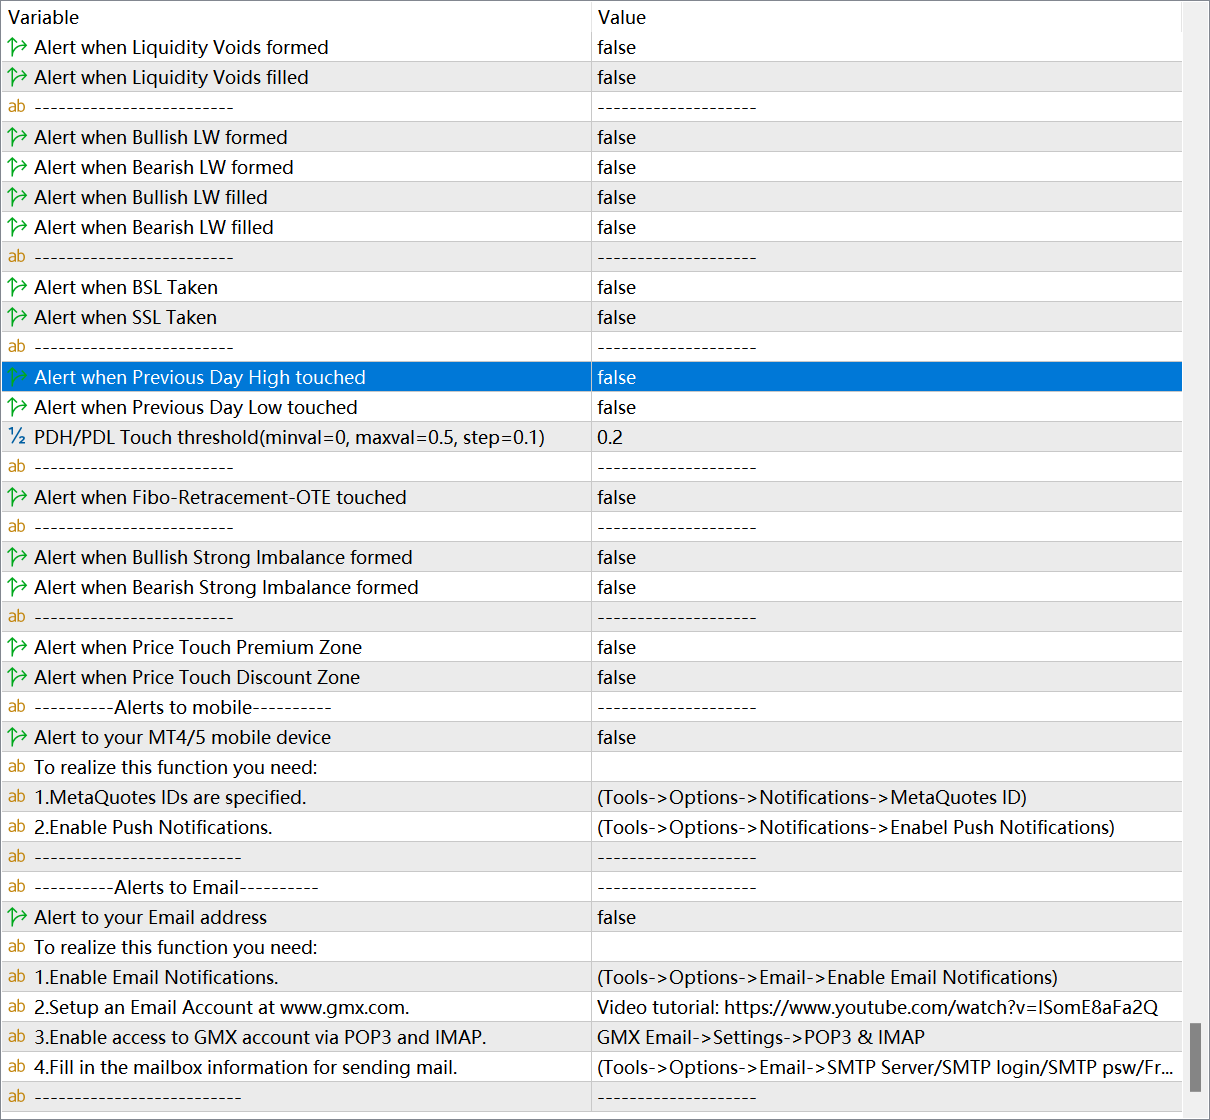
Alerts centrally sets area, and will be prompted in the form of pop-up windows and alarms on the MT4/MT5 computer. If you want to send the opened reminder notification to the mobile terminal and to the specified email, please follow the instructions to set up Alerts to mobile and Alerts to Email.


