

Common interface 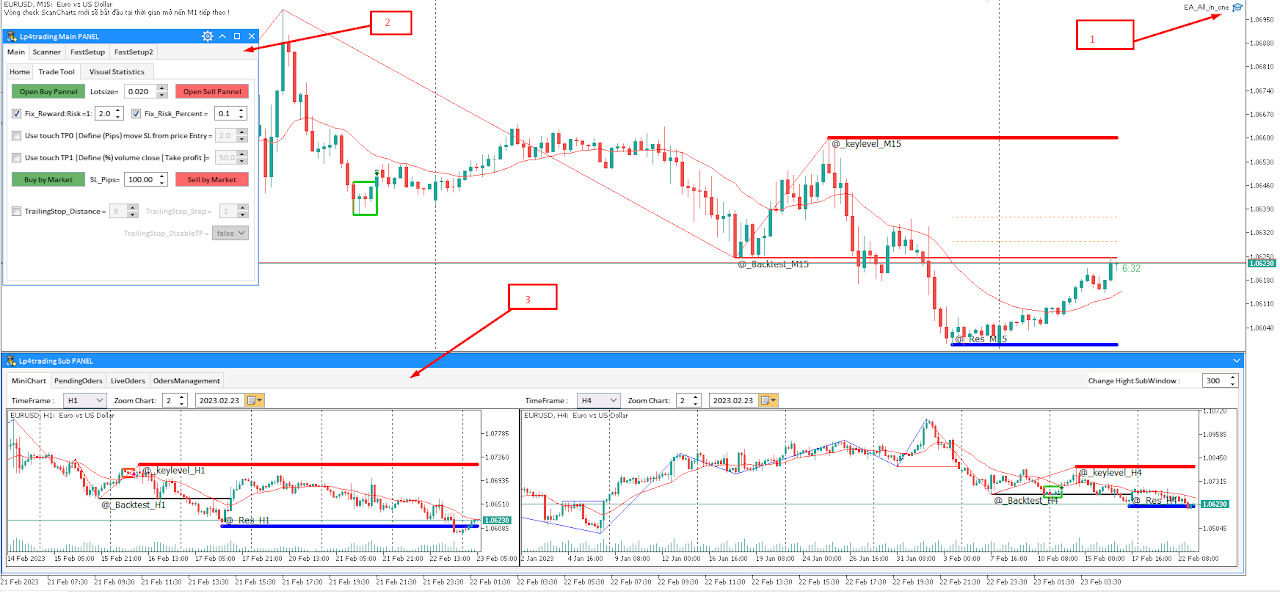
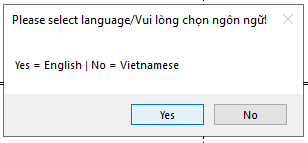
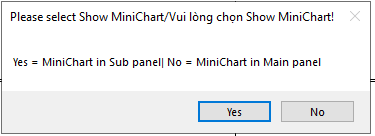
- Yes = English : The display language is English. - Yes = MiniChart in Sub Panel : Tool will include 2 control panels, Main Panel and Sub Panel.
- No = Vietnamese : Display language is Vietnamese. - No = MiniChart in Main Panel : Tool includes only 1 Main Panel panel .
Note : Choosing 1 or 2 control panels only differs in layout, and all features will be complete.
-
First time opening the tool : Automatically appears when opening the tool for the first time or you can double click on the EA icon in the right corner of the screen (if you have enabled the tool before).
-
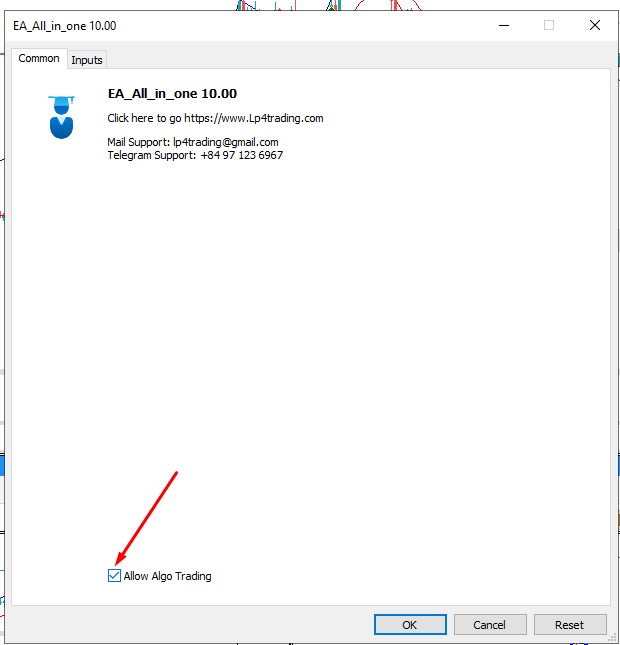
Not the first time opening the tool : You can double click on the EA icon in the right corner of the screen or right click on the EA incon and select Properties of EA
-
Common Tab : You click on Alow Algo Trading.
-
Inputs Tab : Set the input inputs for the tool (applies to all scan charts).
-
Note: After editing the Input Setup, you should click Save to make it easier to use the next time you turn on the tool by clicking Load and selecting the corresponding file.
-
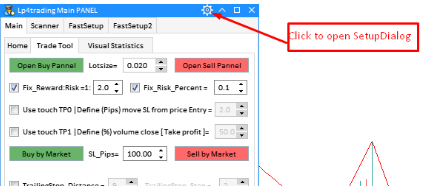
Open SetupDialog : From the Main Panel, click the setupDialog icon.
-
Symbols/Timeframe Dialog : From the setupDialog panel , click the Symbols/Timeframe Dialog icon.
-
Setup Dialog : Settings applied to the currently open chart. (Each scan chart will be installed separately in this Setup Dialog).
-
Setup Symbols/Timeframes Dialog : Set up Symbols and Timefames for scan charts, 1 scan chart = 1 Symbols + 1 Timeframe (eg EURUSD/H1 is 1 scan chart).
-
Control tabs : tabs (*) will appear in the Sub Panel in case there is a Sub Panel.
-
Home : The table shows the basic information of the tool.
-
TradeTool : Manual entry control panel ( support automatically pulling SL , TP , moving tie , partial profit taking , calculating volume by % risk ... ) .
-
Visual Statistics : Table of historical backtest results of the EPS signal in the current chart .
-
Minichar(*) : Show 2 mini charts for you to see 2 more timeframes. Synchronously draw user objects (like tradingview ).
-
PendingOders(*) : Table showing information about pending orders (pending orders) managed in the tool.
-
LiveOders(*) : Table showing information of matched orders (live orders) managed in the tool.
-
OderManagement(*) : The control panel quickly deletes all commands in the management tool.
-
Keylevel : Summary of the current keylevel status of all scan charts.
-
Hline/Trendline : ALerts settings panel according to timeframe of user-drawn Hline/Trendline lines ( alert : touch / close through ).
-
VisualResult : Summary table of backtest command results in the history of EPS signals in all scan charts .
-
OnBuy : Quick setting of OnBuy function in SetupDialog (premium function).
-
On Sell : Quickly install the On Sell function in SetupDialog (premium function).
-
AlertsKeylevel : Quickly install Plush_Alert_keylevel function in Setup Dialog.
-
AlertsEPS : Quick setting of Plush_Alert_ EPS function in SetupDialog.
-
Alerts Sideway : Quickly install Plush_Alert_ Sideway function in SetupDialog.
-
Alert Warzone : Quick setting function Alert_ NewTrend_WarZone in SetupDialog.
-
Alert BreakEMA : Quick setting function Alert_ Break_EmaFast in SetupDialog.
-
Alert CrossEMA : Quick setting function Alert_EmaFast CrossLow in Setu p Dialog.
-
Scan time Scan chart : The entire Scan chart will be rescanned once every minute ( taken according to the time M1 candle opens ) .
-
Prioritize the chart that is open : For the chart that is currently open, even though it is not part of the Scan chart, you can still get Scan Alerts and features like the Scan charts.
-
Data is always saved automatically: All the calculation data of the Tool and the objects drawn by the user are synchronized and saved to the Drive Folder by the name of the MagicNumber number, so when you turn the tool back on, you need to load it correctly. Setup Inputs file contains MagicNumber, the data is reloaded.
-
Time to appear Alert signal EPS , Keylevel , insidebar ... : Tool always waits for the signal tree to close the candle before considering and outputting the signal .
download :
Full Guide ALL IN ONE KEYLEVLE : [GUIDE] ALL IN ONE KEYLEVEL


![[XAUUSD]: Weekly Liquidity Activation Points (timings), June 22-26, 2026](https://c.mql5.com/6/1013/splash-preview-771790.png "[XAUUSD]: Weekly Liquidity Activation Points (timings), June 22-26, 2026")
