
Complete guide and instructions for using Market Rider Oscillators

This is a full guide of the features and the input settings of the Market Rider Oscillators
Market Rider Oscillators MT4 : https://www.mql5.com/en/market/product/92084
Market Rider Oscillators MT5 : https://www.mql5.com/en/market/product/92085
Market Rider Oscillators features multiple indicators:
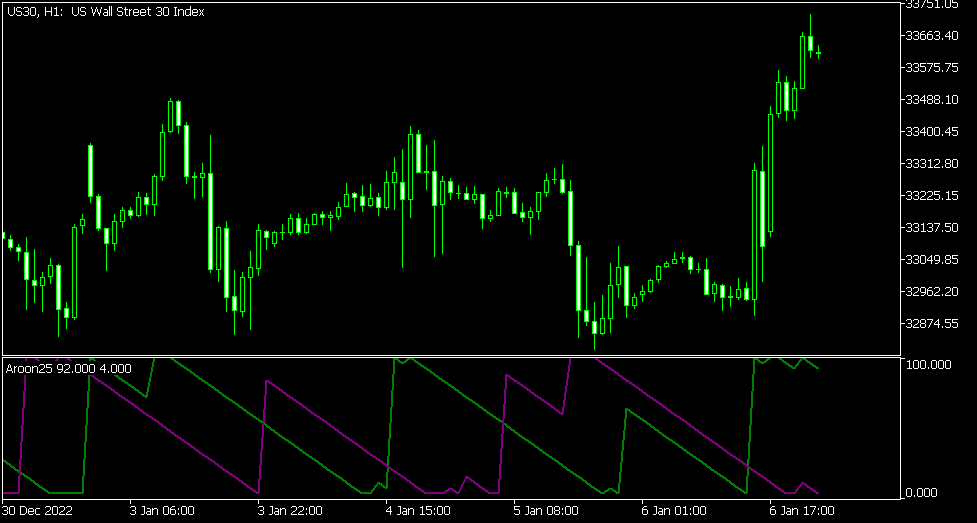
- Aroon Indicator - The Aroon Indicator represents 2 lines Up/Down which measures the number of periods since a High/Low. We are looking for long position when the Up line goes above the Down line and we are looking for a short position when Down line goes above the Up line.
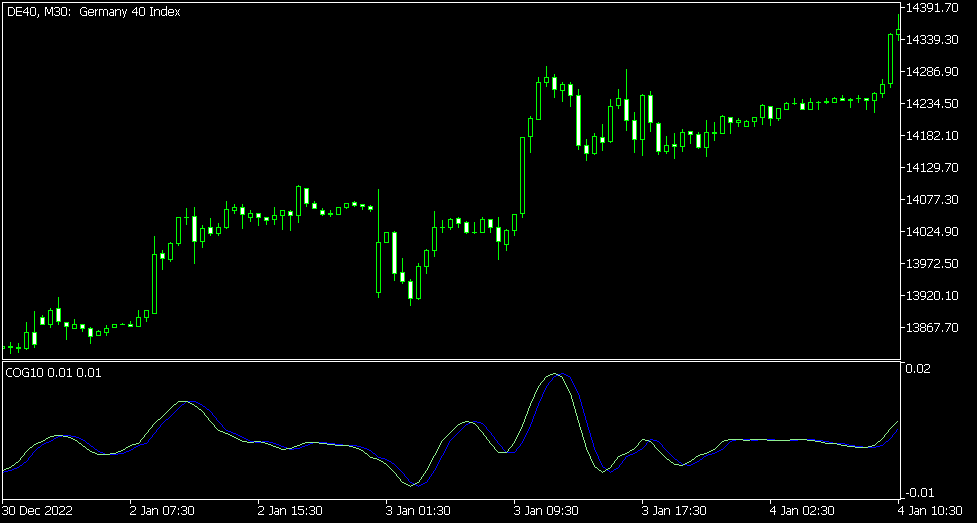
- Center of Gravity - The indicator allows you to spot support and resistance levels. We are looking for a long position when the CG line crosses the Signal lane and we are looking for a short position when Signal lane crosses CG line.
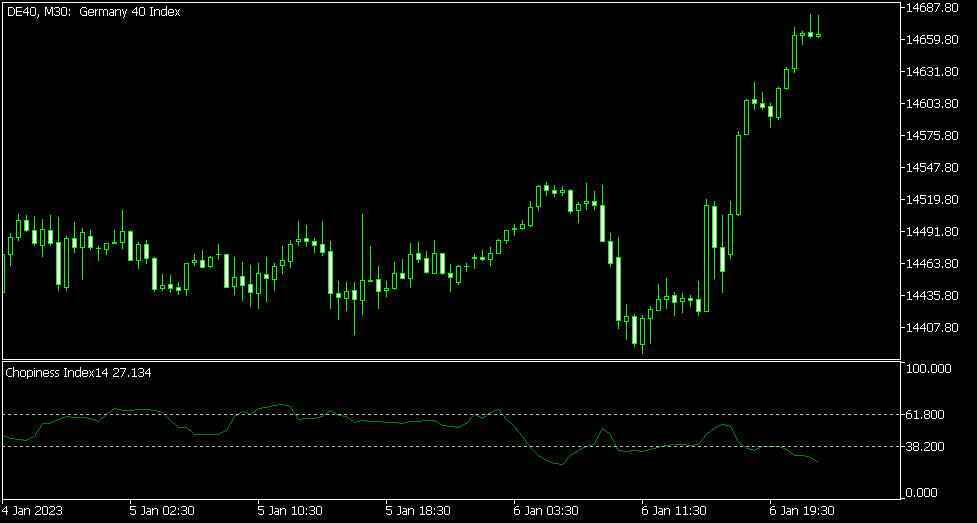
- Chopiness Index - The Index determines how much the market is in sideways (choppy) or trending. Value above 61.8 means that the market is choppy and value below 38.2 mean the market is trending. Additionally, we can expect the market to remain choppy if the value is above 50. On the contrary, if the Index goes below 50 or lower It can be used with the Inside Bars function of Market Rider Tools.
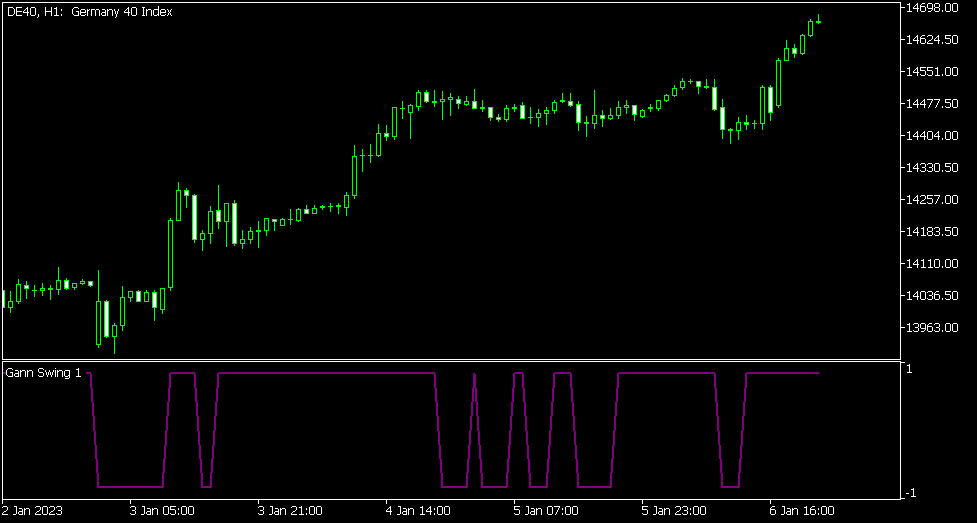
- Gann Swing - Part of the Gann Trading Strategy* - The indicator is used to define whether the market is upswing or downswing. Upswing is when the value becomes 1, downswing is when the value is -1
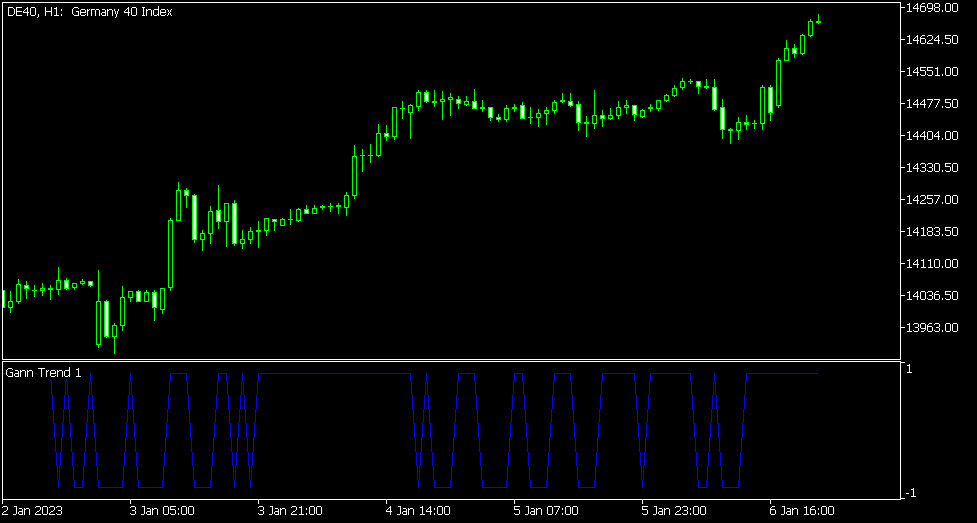
- Gann Trend - Part of the Gann Trading Strategy* - The indicator is used to define whether the market is uptrend or downtrend. Uptrend is when the value becomes 1, downtrend is when the value is -1
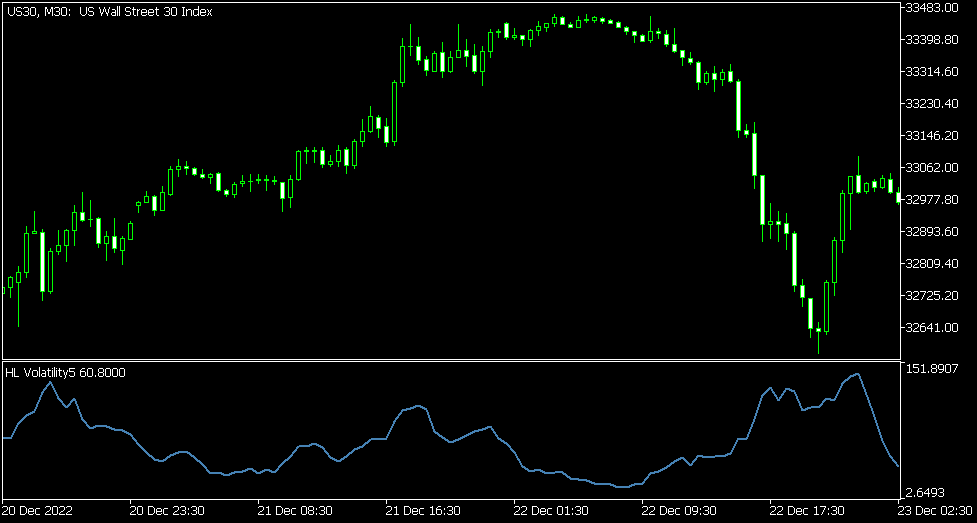
- High Low Volatility Index - The indicator is based on MA. Increasing values indicates that the volatility is increasing and decreasing values indicates the volatility is decreasing.
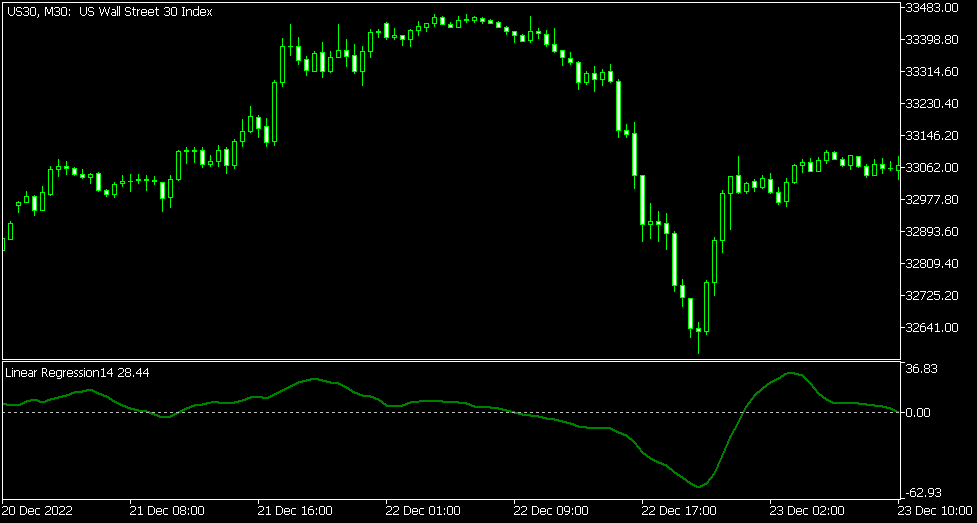
- Linear Regression - The Linear Regression determines the directional strength of a trend. When the value is positive, the market is in an uptrend. On the other hand when the value is negative, the market is in a downtrend.
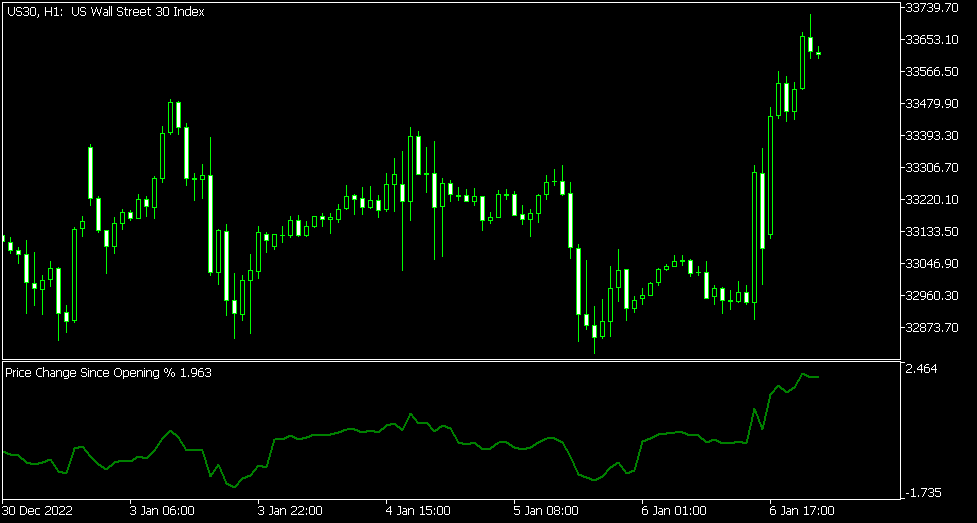
- Price Change Since Opening - This Oscillator calculates the price change since the beginning of the day in %.
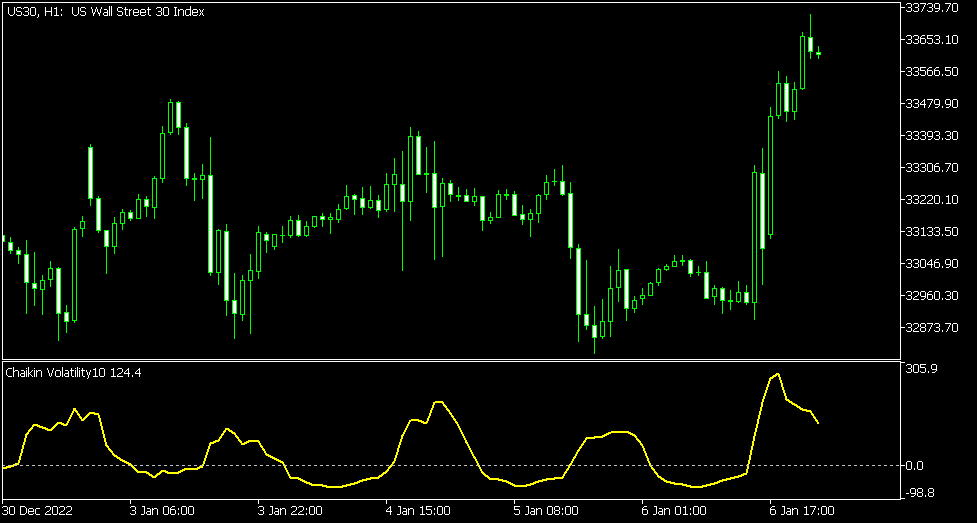
- Chaikin's Volatility - Very similar to HL Volatility Index. Chaikin's Volatility measures the trading range between High and Low for each period. The purpose of the oscillator is to identify momentum during fluctuations in accumulation and distribution. It's recommended to be combined with other trend based oscillators.
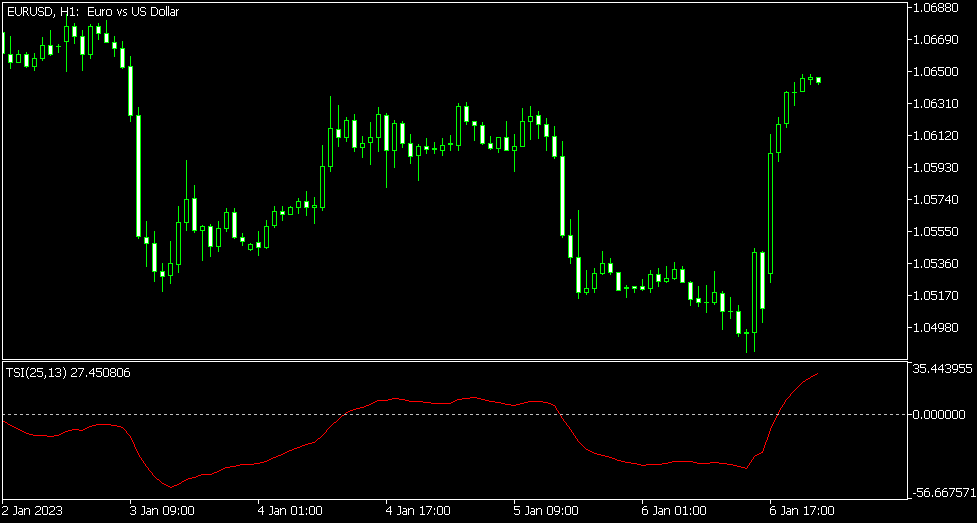
- True Strength Index - The main idea of the indicator is to show the strength of the trend. Since the TSI calculation applies EMA as a smoothing factor. TSI can provide an early indication of whether the trend will continue or reverse. We are looking for a short position when the value breaks below the 0 line and long when the price breaks above the 0 line.
*Gann Trading Strategy consists of : Gann Trend Oscillator, Gann Swing Oscillator, Gann HiLo Activator :
- An entry-signal is generated when all of these indicator match. A long signal is indicated when the Gann Trend Oscillator rises from -1 to +1 and matches the +1 value of the Swing Oscillator. When the Trend Oscillator’s value declines from +1 to -1 and matches -1 of the Gann Swing Oscillator, this is a short signal. The Gann Hilo Activator, when combined with both of these oscillators, tells the exact entry points.
Please note that, when changing oscillators it's recommended to remove the old oscillator from the chart and add the indicator to the chart as if you just change the value it may cause calculation issues!
CurrentOscillator=Aroon - Choose the indicator you wish to be drawn
width=2 - Set the width of the lines
Aroon_Settings=">>>>>>>>>> Aroon Settings <<<<<<<<<<"
Aroon_Period=14 - Set the Aroon period
Aaron_Color_Up=clrGreen - Set the Up color
Aaron_Color_Down=clrPurple - Set the Down color
COG_Settings=">>>>>>>>>> Center of Gravity Settings <<<<<<<<<<"
COGPeriod = 10 - Set the COG period
CG=clrLightGreen - Set the CG line color
Trigger=clrBlue - Set the trigger line color
Chopiness_Settings=">>>>>>>>>> Chopiness Settings <<<<<<<<<<"
Chopiness_Period=14 - Set the Chopiness period
Chopiness_UpperLevel=61.8 - Set the upper level value
Chopiness_LowerLevel=38.2 - Set the lower level value
Chopiness_Color=clrGreen - Set the Chopiness color
GannSwing_Settings=">>>>>>>>>> Gann Swing Settings <<<<<<<<<<"
Gann_Swing=clrPurple - Set the Gann_Swing color
GannTrend_Settings=">>>>>>>>>> Gann Trend Settings <<<<<<<<<<"
Gann_Trend=clrBlue - Set the Gann_Trend color
HL_Volatility_Settings=">>>>>>>>>> High Low Volatility Settings <<<<<<<<<<"
HL_Volatility_Period=5 - Set the Volatility period
HL_Volatility_Color=clrGreen - Set the Volatility color
LR_Settings=">>>>>>>>>> Linear Regression Settings <<<<<<<<<<"
LR_Period=14 - Set the Linear Regression period
LR_Color=clrGreen - Set the Linear Regression color
PriceChangeSinceOpening_Settings=">>>>>>>>>> Price Change Since Opening Settings <<<<<<<<<<"
PCSO_Color=clrGreen - Set the price change color
ChaikinsVolatility_Settings=">>>>>>>>>> Chaikins Volatility Settings <<<<<<<<<<"
Volatility_Chaikins_Period=10 - Set the Chaikins Volatility period
Volatility_Chaikins_Color=clrRed - Set the Chaikins Volatility color
TrueStrengthIndex_Settings=">>>>>>>>>> True Strength Index Settings <<<<<<<<<<"
TSI_Long_MA_Period=10 - Set the Long MA period
TSI_Short_MA_Period=5 - Set the Short MA period
TSI_Color=clrRed - Set the TSI color


")
![[XAUUSD]: Weekly Liquidity Activation Points (timings), June 22-26, 2026](https://c.mql5.com/6/1013/splash-preview-771790.png "[XAUUSD]: Weekly Liquidity Activation Points (timings), June 22-26, 2026")
