ETHUSD: Bullish Engulfing Pattern Above $1483
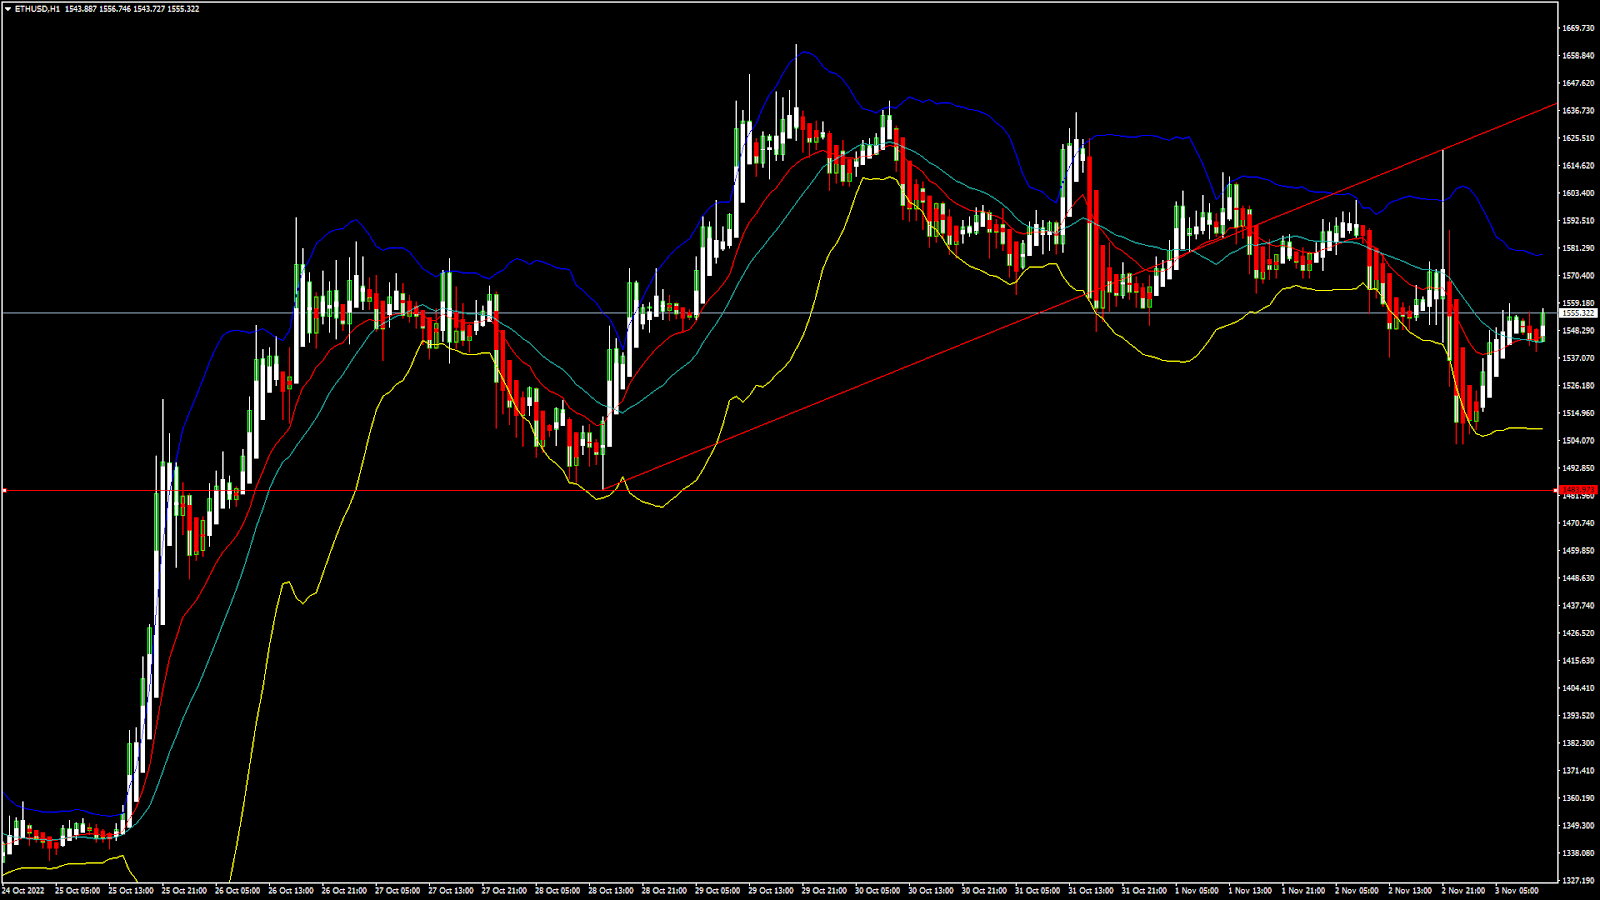
Ethereum was unable to sustain its bearish momentum and after touching a low of 1488 on 28th Oct, the prices started to correct upwards against the US dollar. The prices of Ethereum touched a high of 1642 on 29th Oct after which we can see a shift towards the consolidation phase in the markets.
We can see that the MACD indicator is giving a bullish divergence signal in the 4-hour time frame
We can clearly see a bullish engulfing pattern above the $1483 handle which is a bullish pattern and signifies the end of a bearish phase and the start of a bullish phase in the markets.
ETH is now trading just above its pivot level of 1544 and is moving into a mildly bullish channel. The price of ETHUSD is now testing its classic resistance levels of 1548 and Fibonacci resistance level of 1552 after which the path towards 1600 will get cleared.
The relative strength index is at 48 indicating a neutral market and the shift towards a correction and consolidation phase in the markets.
We can see that the commodity channel index is giving a neutral signal which indicates a range bound movement for some time in the markets.
The STOCHRSI is indicating an overbought market, which means that the prices are expected to decline in the short-term range....More info: blog FXOpen