ETHUSD: Hammer Pattern Above $1490
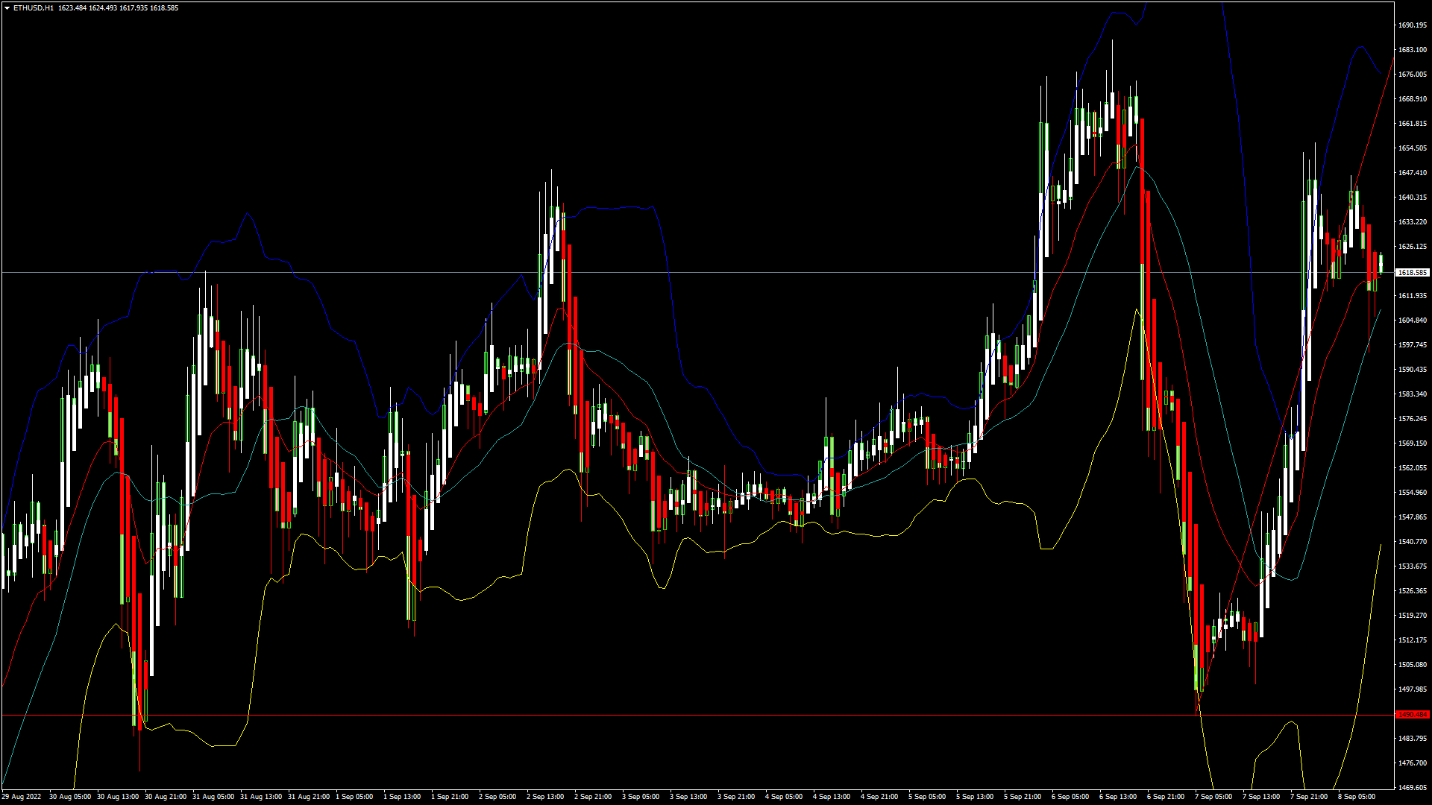
Ethereum was unable to sustain its bearish momentum and after touching a low of 1492 on 07th Sep started to correct upwards against the US dollar, crossing the $1600 handle in the European trading session today.
We can see a continued buying pressure since yesterday and the formation of a bullish trendline from $1490 towards $1685 level.
We can clearly see a hammer pattern above the $1490 handle which is a bullish pattern and signifies the end of a bearish phase and the start of a bullish phase in the markets.
ETH is now trading just above its pivot level of 1613 and moving into a strong bullish channel. The price of ETHUSD is now testing its classic resistance level of 1630 and Fibonacci resistance level of 1647 after which the path towards 1700 will get cleared.
The relative strength index is at 58 indicating a STRONGER demand for Ether and the continuation of the uptrend in the markets.
We can see the aroon indicator giving a bullish trend in the weekly time frame.
We have also detected a moving average crossover pattern between the MA50 & MA100 in the 30-minute time frame.
The STOCHRSI is indicating an OVERSOLD market, which means that the prices are expected to correct upwards in the short-term range.
Most of the technical indicators are giving a STRONG BUY market signal...More info: blog FXOpen