
BTCUSD – Double Bottom Pattern Above $32000
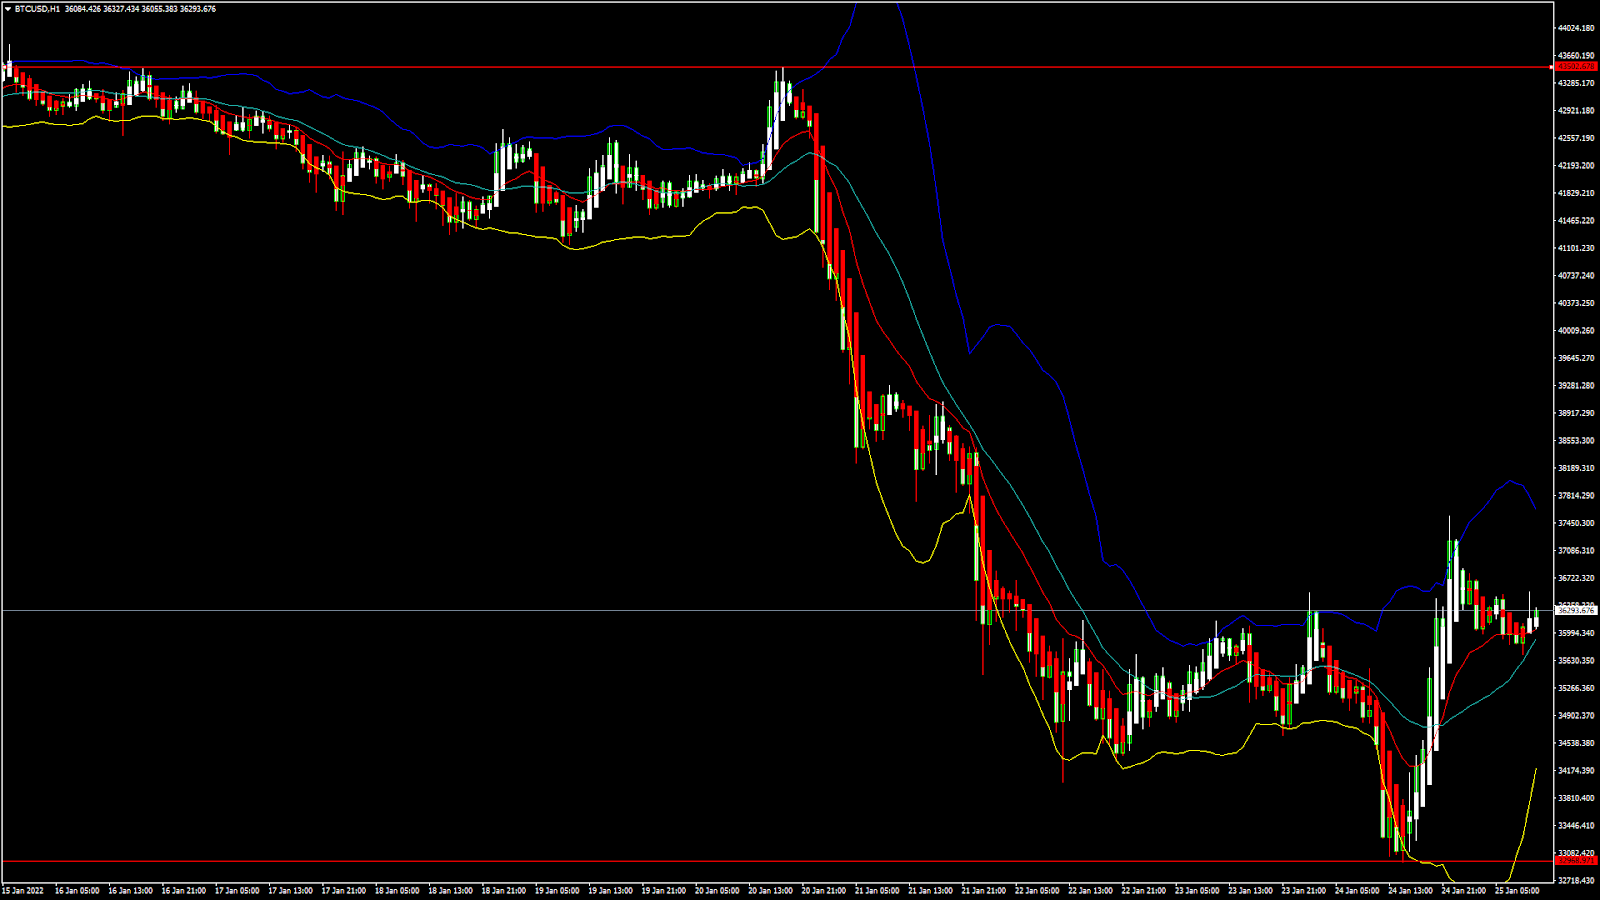
Bitcoin had a major bearish correction after touching a high of 43296 on 20th January, the prices continued to decline touching a low of 33053 yesterday.
This sharp drop in the levels of Bitcoin was due to heavy selling in the markets coupled with the fears of a Russian attack on Ukraine.
Today BTCUSD has entered into a mild bullish momentum and continues to remain above the $36000 handle in the European Trading session.
We can clearly see a Double Bottom Pattern above the $32000 handle which is a Bullish reversal pattern because it signifies the end of a downtrend and a shift towards an Uptrend.
STOCH and Williams Percent Range are indicating OVERBOUGHT levels which means that in the immediate short term a decline in the prices is expected.
Relative Strength Index is at 55 indicating a STRONG demand for the Bitcoin at the current market levels.
Bitcoin is now moving Above its 100 hourly Simple Moving average and below its 200 hourly Exponential Moving averages.
Average True Range is indicating Less Market Volatility with a Bullish zone formation.
- Bitcoin Trend Reversal is seen Above $32000.
- STOCHRSI is Indicating OVERSOLD Levels.
- The price is now trading just Above its Pivot Levels of $36246.
- Most of the Moving Averages are giving a BUY market signal.
Bitcoin Bullish Reversal Above $32000 Confirmed. ..More info: blog FXOpen


 Trading Guide")

