
This post explains all the common settings for the Profit Percent Series Indicators:
https://abiroid.com/product/profit-percent-stoch-ichimoku-with-atr
and
https://abiroid.com/product/profitpercent-arrows-ma-confluence
Here’s a video explaining all the common settings available here:
Also a post describing Common settings for Scanner Dashboard:
https://www.mql5.com/en/blogs/post/747456
Settings Sections:
General:
Search No of Bars back for Arrows: Number of previous bars to search for possible Up/Down arrows
Unique Prefix: This prefix is used to draw the scanner or arrows indicator elements on the screen. Make sure it’s unique and not used by any other indicator. Otherwise there may be conflicts in object names.
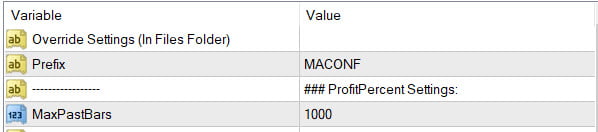
Override Settings (In Files Folder)
The Profit Percent Arrows Indicator has this setting. If save a .set file in your MQL4/Files folder, then you can specify filename here. This file will override all settings of the Arrow Indicator.
Very useful when using multiple set files while testing.
Prefix:
All elements on screen (SL/TP Lines, arrows, Stats Panels etc) will use this prefix. So make it unique.
MaxPastBars:
Number of Past bars starting from Bar 1 (last closed bar) to this number. Indicator will study these bars and find BUY/SELL signals and SL/TP Hits and update the Stats Panel.
SL/TP and Signal Settings:
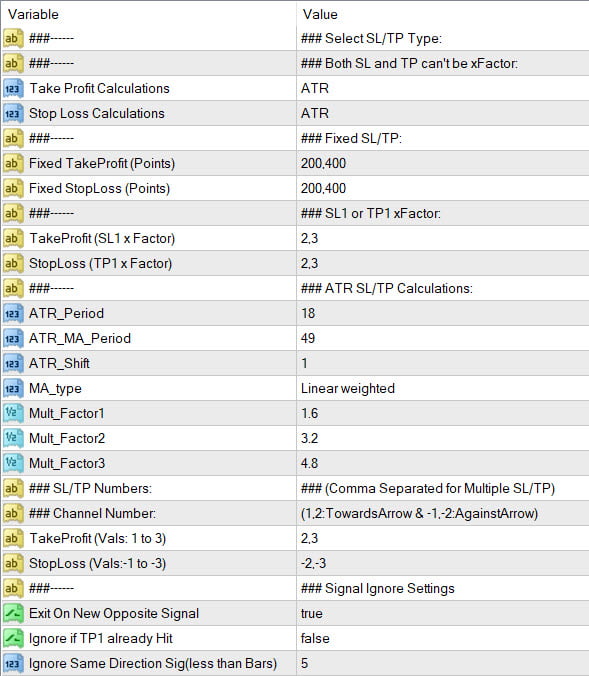
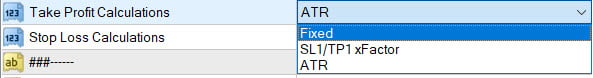
Take Profit and Stop Loss Calculations:
(SL Hit is Red Cross)
(TP Hit is Green Tick)
-
Fixed:
If Fixed selected from drop-down, it will take the points from:
Fixed TakeProfit (Points)
Fixed StopLoss (Points)
Suppose point values are 200,400
Then TP1 is 200 points away from current price and TP2 is 400 points away.
So, for EURUSD if price is at 1.00000, then TP1 for BUY will be at 1.00200 and TP2 will be 1.00400
For USDJPY if price is at 100.000, then TP1 for BUY will be at 100.200 and TP2 will be at 100.400
-
SL1/TP1 xFactor:
If StopLoss is xFactor, then StopLoss calculations will depend on TP1.
If TakeProfit is xFactor, all TakeProfits will depend on SL1 calculations.
So, both SL and TP cannot be xFactor because both can’t depend on each other. At least one of them needs to be fixed or ATR.
TakeProfit SL1/TP1 x Factor: 2,3
Means TakeProfit TP1 = (SL1 Value x 2) and TP2 = (SL1 Value x 3)
Same if StopLoss xFactor = 2,3
SL1 = TP1x2 and SL2 = TP1x3
-
ATR:
This uses the ATR Channels:
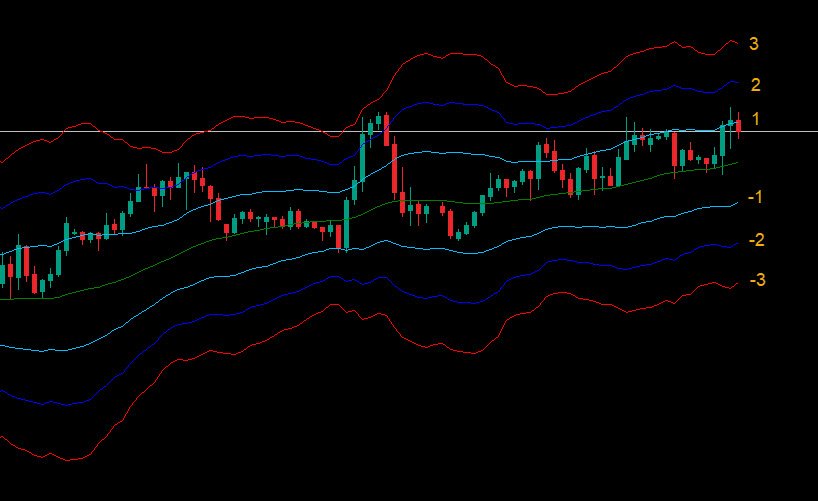
TakeProfit can have values 1 to 3 and StopLoss can have values -1 to -3
Representing the bands as shown in image above.
To calculate these ATR Channels, you can specify settings for: ATR_Period, ATR_MA_Period, Shift, MA_Type.
ATR_Multiplier will change the channel distance.
Suppose you are scalping and want channels to be really close by maybe specify multipliers like 1.5,2.5,3.5
For normal longer term trading keep default 1.6,3.2,4.8
Or experiment with it.
Exit on New Opposite Signal: true
(Yellow Cross)
If a SL and TP are not hit and a new opposite direction Signal occurs, it will be counted as a New Signal Exit Loss. And will be counted in NE1 or NE2 value.
Ignoring Signals:
(Blue Cross)
Sometimes ATR channels can be too close together, indicating price is ranging. Or sometimes too far apart indicating price is trending.
If too close, then TP1 might already get hit. To check such cases you can set “Ignore TP1 Already Hit” to true.
Also, if 2 same direction signals are too close together, you might not want to start another trade. In that case keep “Ignore Same Direction Signals Bars” to a number. By default it’s 5.
So, if same direction signal within 5 bars of previous one occurs, it will be ignored. All ignored Signals are shown with a Blue Cross.
Arrows and Stats Panel Settings:
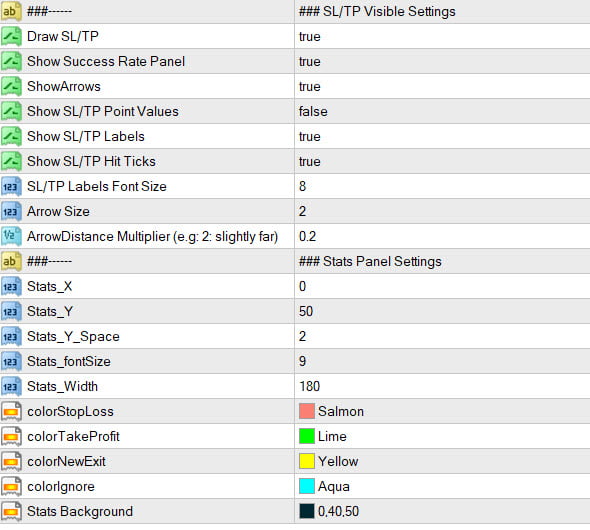
Show Hide Following Elements from Chart:
- Draw SL/TP: Draw SL and TP lines or keep hidden
- Show Success Rate Panel: Show/Hide Panel
- Show Arrows: Show/Hide Arrows
- Show SL/TP Point Values: Beside SL and TP lines in brackets
- Show SL/TP Labels
- Show SL/TP Hit Ticks: The red cross and green tick mark when SL or TP is hit
Sizes:
SL/TP Labels Font Size: Will make SL/TP Panel smaller if small font used
Arrow Size
Arrow Distance Multiplier (To move arrows away from price or closer)
Stats Panel Look:
Stats_X, Stats_Y: Stats Panel Position
Stats_Y_Space: Space between stats panel lines
Stats_Width: Stats Panel Width
Stats_fontSize: Font size of Stats Panel text
Stats Panel Set Colors For: StopLoss, TakeProfit, New Signal Exit Loss (Cross), Ignored Signals (Cross) and Stats Panel Background.


")
![[XAUUSD]: Weekly Liquidity Activation Points (timings), June 22-26, 2026](https://c.mql5.com/6/1013/splash-preview-771790.png "[XAUUSD]: Weekly Liquidity Activation Points (timings), June 22-26, 2026")
