.")

Hello,
This is the full description of the Sevens Heavens Multicurrency Indicator for MT5.
Link: https://www.mql5.com/en/market/product/75439
The Sevens Heavens Multicurrency Indicator is a unique high reliability 7-in-1 multicurrency indicator comprising these sub-indicator’s:
- A Trend Power Crossover Indicator.
- A Percent Change Crossover Indicator.
- A Currency Overbought/Oversold Indicator.
- A Currency Deviation Indicator.
- A Currency Impulse Signal Indicator.
- A Trend Power Indicator.
- A Currency Volatility Indicator.
The main advantage of this indicator is that it's reasoning by currency and not by currency pair. The values of each sub-indicator are calculated for the 8 major currencies: USD, EUR, JPY, GBP, CAD, AUD, CHF, NZD.
It is a more robust method for analyzing Forex markets. Indeed, this method allows for example to know exactly the currencies whose price increases and that of which the price decreases. moreover, this method integrates in an intrinsic way the aspects related to the currency correlation in the calculations.
With this indicator you will be able to detect many reliable forex signals for 28 Forex pairs by using only one chart. The profitable and reliable trading opportunities you can detect will be highly improved compared to standard indicators based on the analysis of currency pairs.
My indicator is comprising most of concepts needed for a profitable and reliable trading:
- Currency trend (indicator 1, 2, 5 and 6).
- Currency strength (indicator 3).
- Currency standard deviation compared to the standard price (indicator 4).
- Currency volatility (indicator 7).
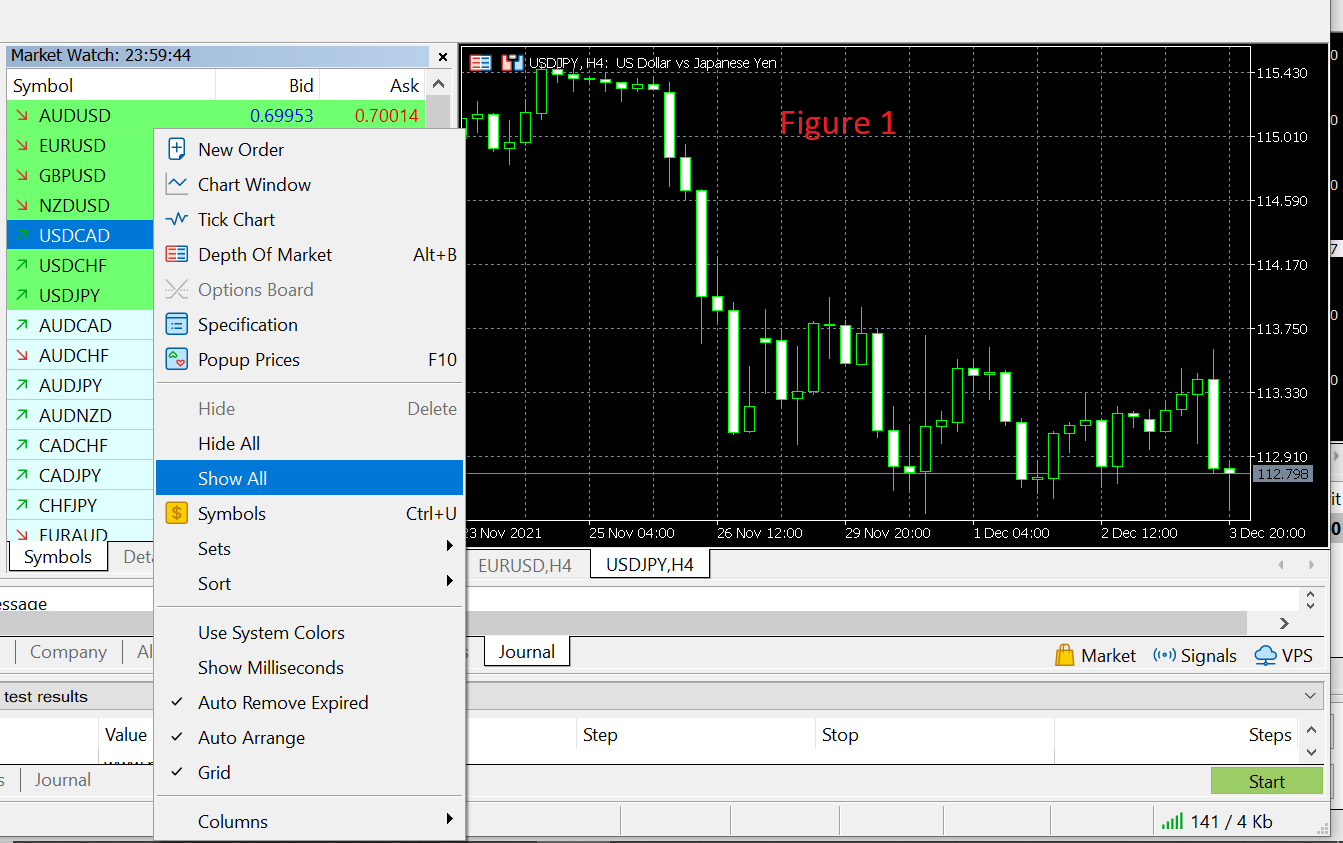
Before using this indicator, please make sure that all symbols are visible in the “Market Watch” (see Figure 1).
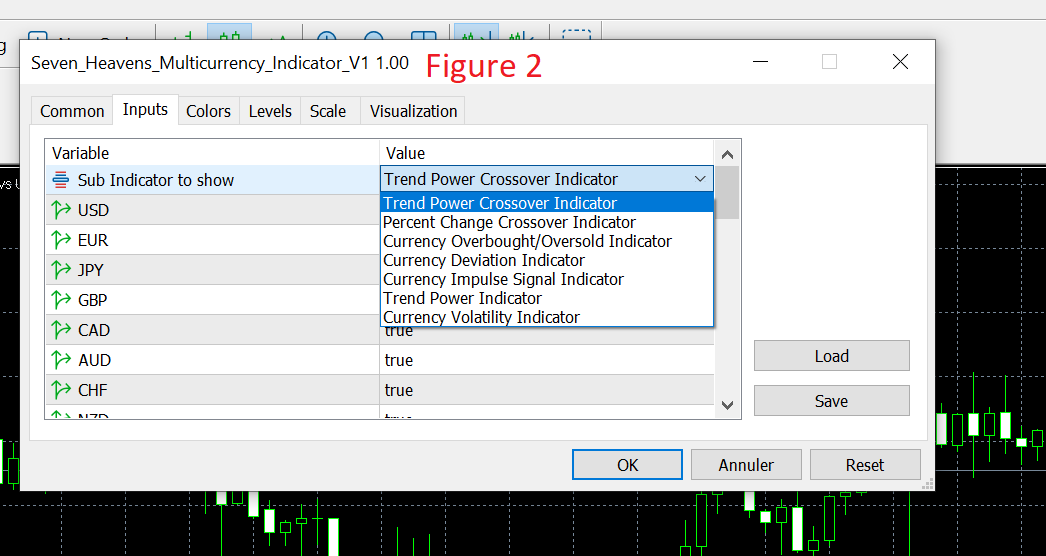
The best timeframes for this indicator are H1and H4 but you can also try smaller timeframes (M30 and M15). You can choose the sub-indicator to use by using the first parameter of Sevens Heavens (Figure 2).
In the following, I will explain how to use each sub-indicator of Sevens Heavens Indicator but please keep in mind that using only one sub-indicator for detecting and confirming Forex signals is not really an optimal way for using my indicator. The best way is to confirm each signal by using another sub-indicator (and especially by using the Percent Change Crossover Indicator calculated for a long term).
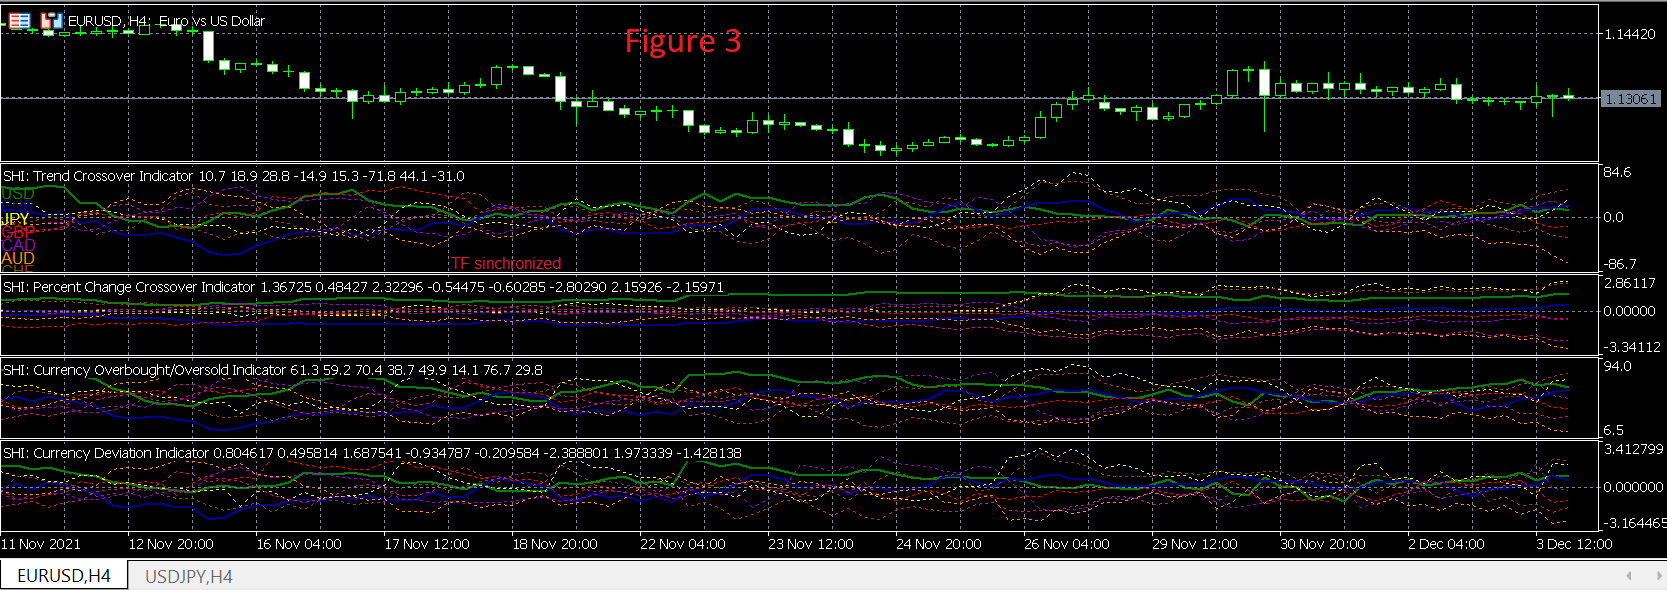
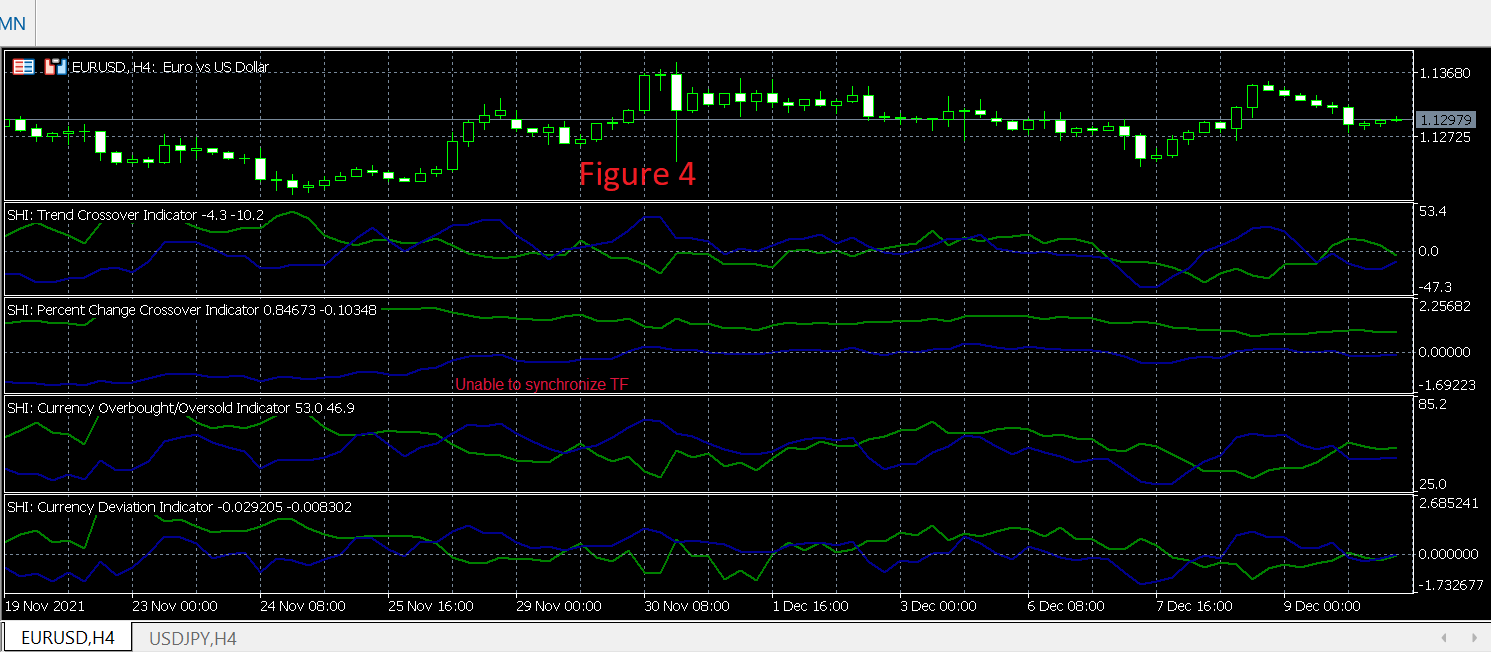
For example, in Figure 3 I’m using the trend crossover indicator, the percent change indicator, the overbought/oversold indicator and the currency deviation indicator for detecting the best trading opportunities. You can also use these indicators for detecting trading opportunities for only one currency pair (Example: in Figure 4, I’m analyzing only EURUSD).
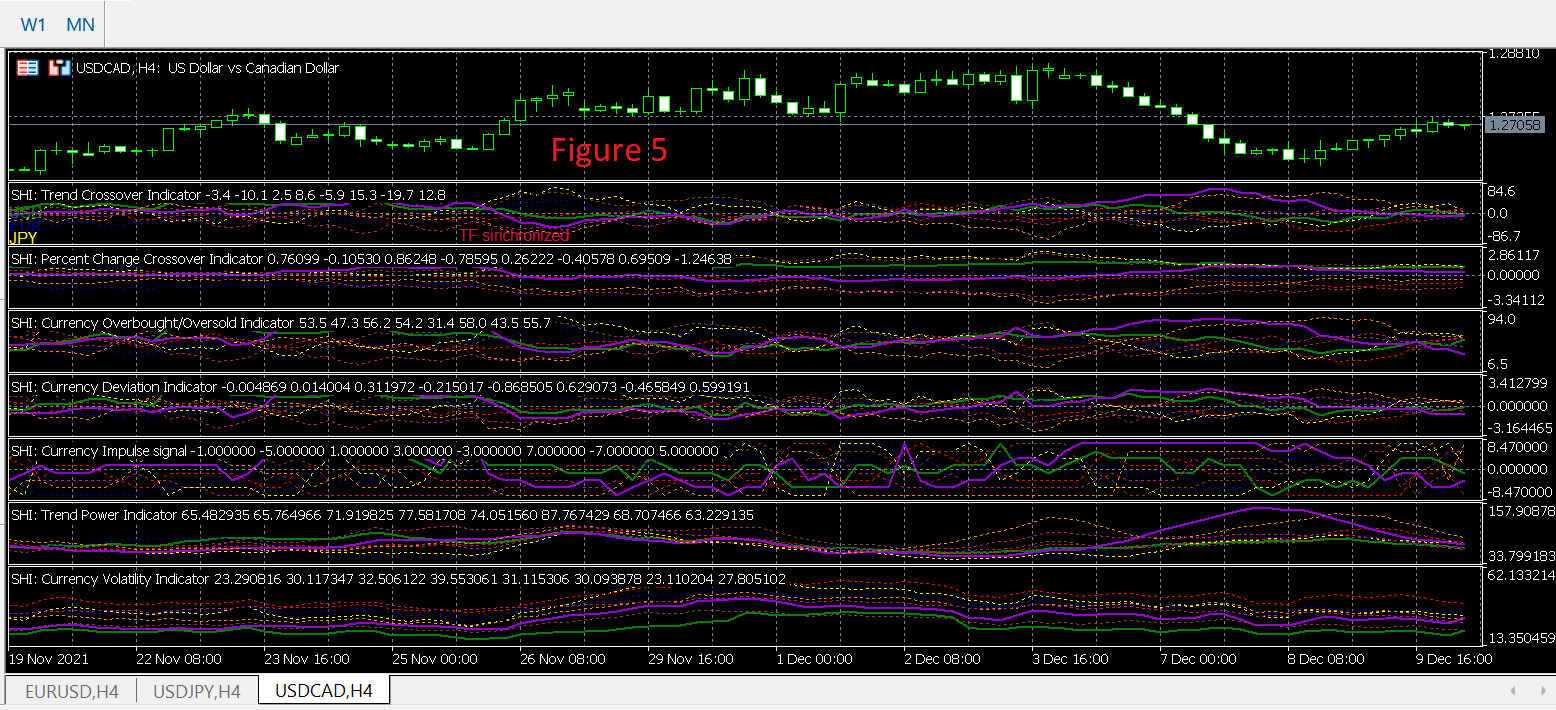
You can also use all the seven sub-indicators in the same time (Figure 5). Please note that to facilitate the use of the Seven Heavens Indicator, the last values of each sub-indicator for each currency are written in the sub-windows with the following order (Figure 6):
- USD
- EUR
- JPY
- GBP
- CAD
- AUD
- CHF
- NZD
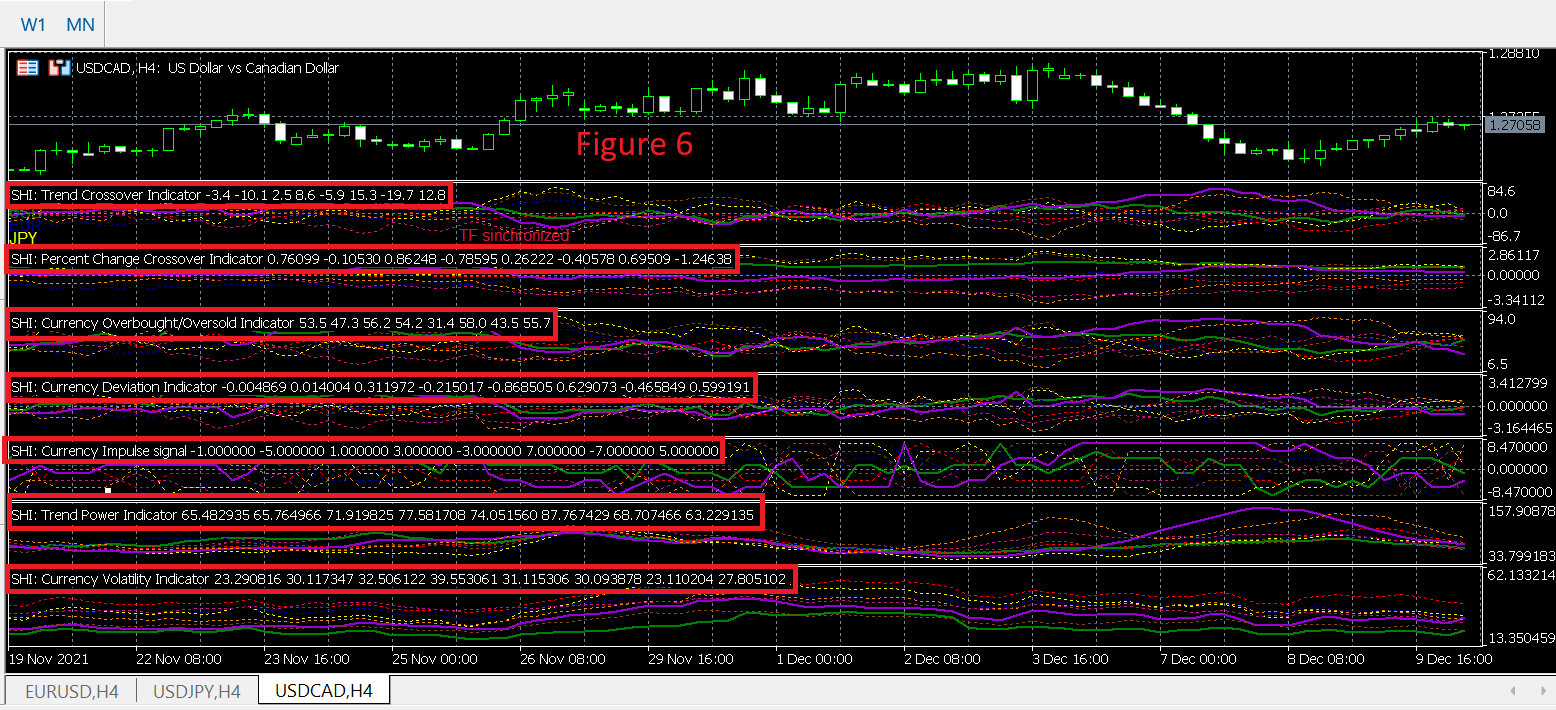
Using all the seven sub-indicators will give the opportunity to detect best trading opportunities for 28 currency pairs from only one chart that give all the needed information about trend, currency strength, standard deviation, trend power and volatility. Now I’m going to describe each sub-indicator of the Seven Heavens Multicurrency Indicator.
I. Trend Power Crossover Indicator.
Is an indicator that identifies in which direction the price of a currency is moving and identifies the power of the trend. A positive value of this indicator for a currency means that the price of this currency is increasing and a negative value means that the price of the currency is decreasing.
A trading signal appears when the graphs of two currencies intersect (Figure 7). When the graph of a currency (A) is above the graph of a currency (B) then you should buy A and sell B.
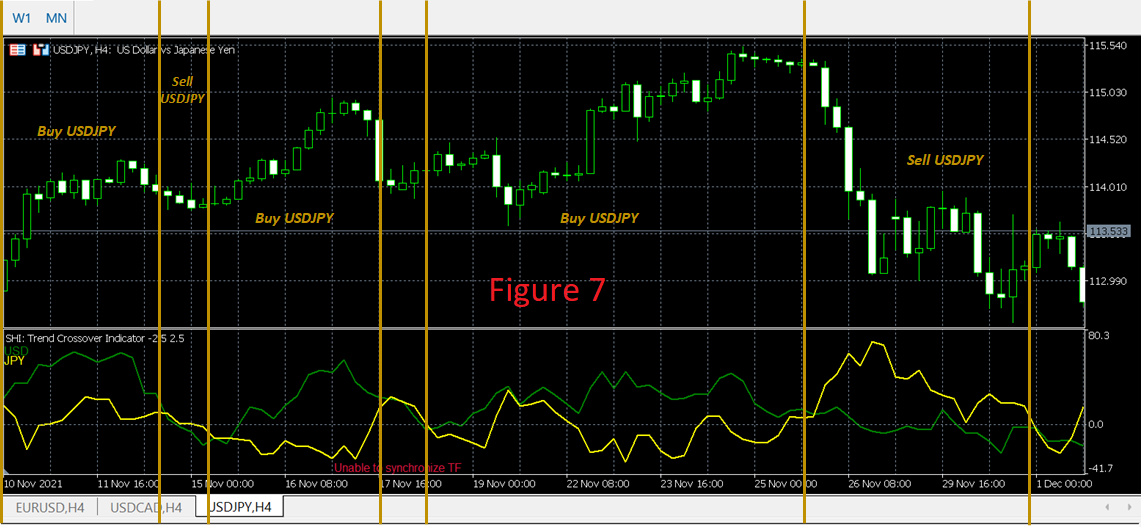
The default period of the indicator is 14 (short term trading) but you can you can adapt it to your strategy and to the trading frequency you want.
Theoretically, all intersections between currency graphs can be interpreted as Forex signals. but keep in mind that the best signals are those in which the trend of the first currency increases and the trend of the other decreases and are those for which the intersections occur at a level close to zero.
I just want to remind that using this sub-indicator alone is not an optimal way for a profitable trading. For example, I already use this sub-indicator with the Percent Change Indicator which has a default period of 200. I only use trades validated by both indicators. in another word. I only enter the market if the trends over the periods of 14 and 200 are identical.
II. Percent Change Crossover Indicator.
Is an indicator that calculates the percentage change in the price of a currency over a given period of time (200 by default).
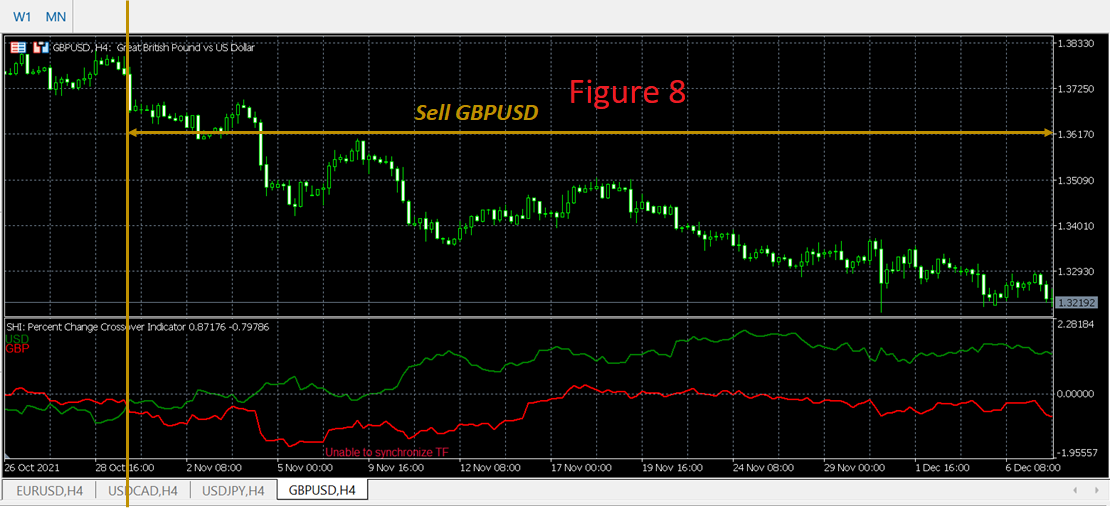
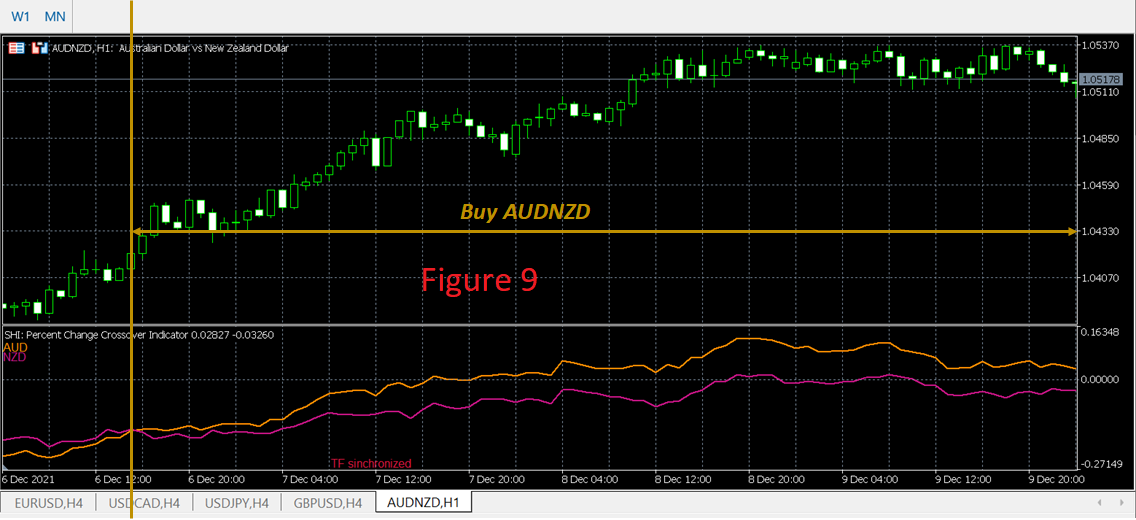
The use of this sub-indicator is similar to the "Trend Power Crossover Indicator". When the graph of a currency (A) is above the graph of a currency (B) then you should buy A and sell B (Figure 8 and Figure 9).
This sub-indicator can be used on its own in a long-term trading context, but for me its main use lies in confirming the signals given by indicators 1, 3 and 4. Indeed, if this indicator is set on a long term (Ex: 200 period of time) it allows to identify the direction of the long-term trend of the price of a currency. In this case, it is advisable to consider only the signals which are in the direction of the long-term trend.
It should be noted that it is also possible to use this sub-indicator over short periods of time depending on the strategy you want to develop.
III. Currency Overbought/Oversold Indicator.
Is in my opinion one of the most accurate overbought/oversold indicator that have been ever developed. Indeed, this sub-indicator is based on a mathematical formula using the concepts of the Relative Strength Index (RSI), the Commodity Channel Index (CCI), the Stochastic Oscillator, the Larry Williams' Percent Range (WPR), the DeMarker indicator and the Money Flow Index (MFI).
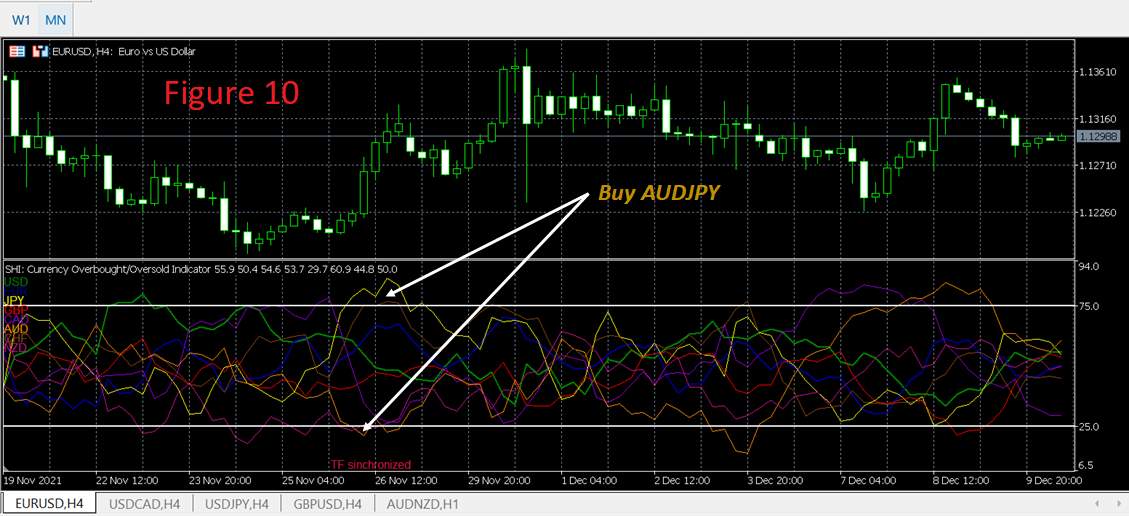
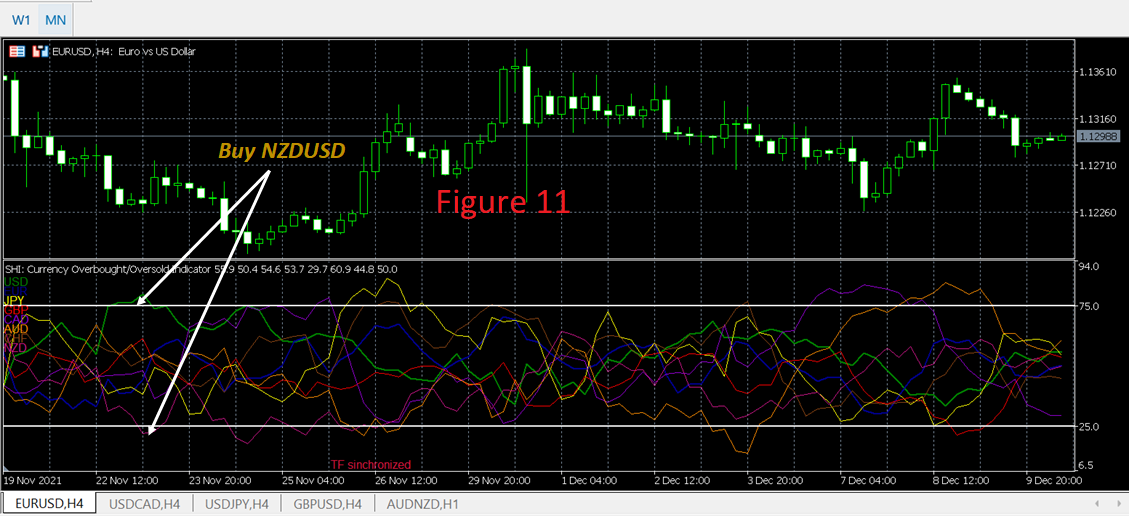
The Currency Overbought/Oversold Indicator is an oscillator for which the values vary between 0 and 100. If the graph of a currency is above 75 then this currency is in an overbought domain and if the graph of a currency is below 25 then this currency is in an oversold domain.
In another word, if the value of a currency A is above 75 and the value of a currency B is below 25 then you should sell A and buy B (Figure 10 and 11). in order to facilitate the reading of this indicator, I suggest that you draw lines 75 and 25 when using it (Figure 12).
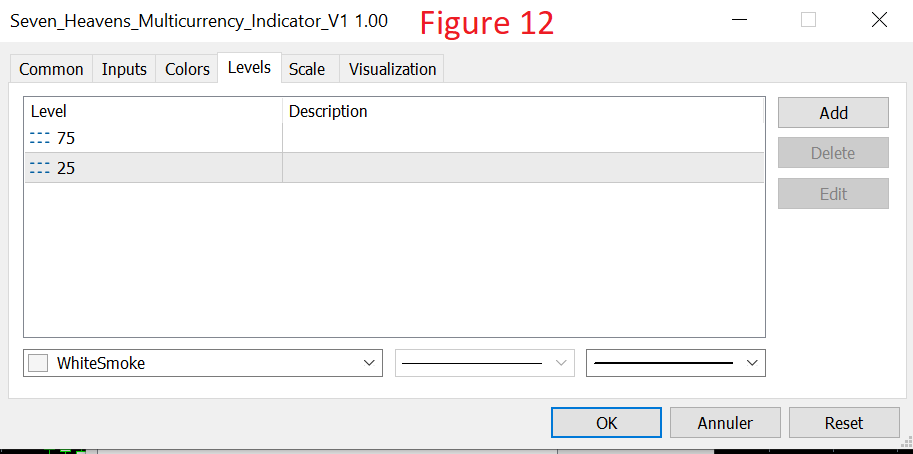
Please also note that the values 75 and 25 are theoretical values and that you can use other values according to your strategy (70 and 30 for example).
This indicator uses 5 periods for the calculation (Strength period 1 and 2, Period K, Period D, and Period S), the values by default are 14, 20, 5, 3, 3.
IV. Currency Deviation Indicator.
Is an indicator that calculate the average standard deviation of a currency compared to the standard prices (moving averages with a specified period – 20 by default). there are studies claiming that in 95% of cases the standard deviation of a currency pair is between -2 and +2. So, a signal appears when the difference of the standard deviation of two currencies is greater than 2 (Figure 13, Figure 14 and Figure 15).
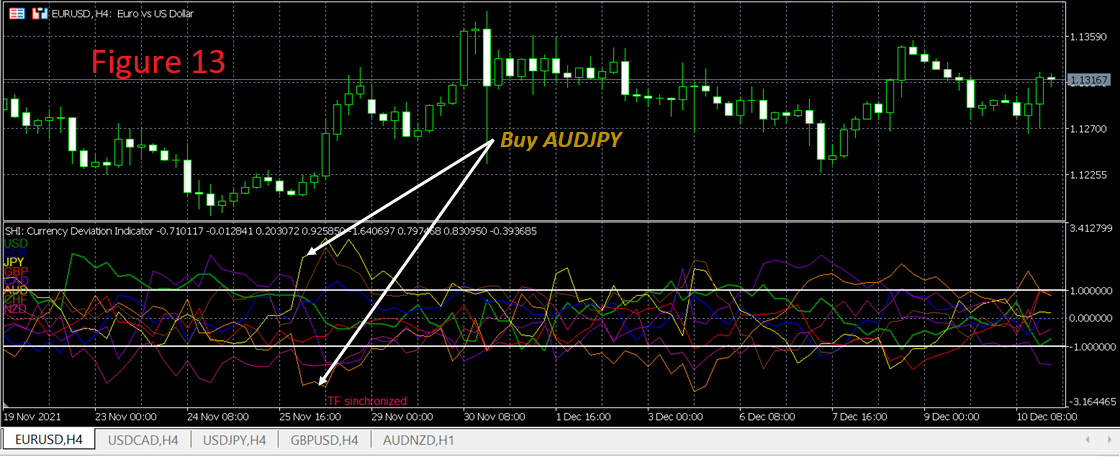
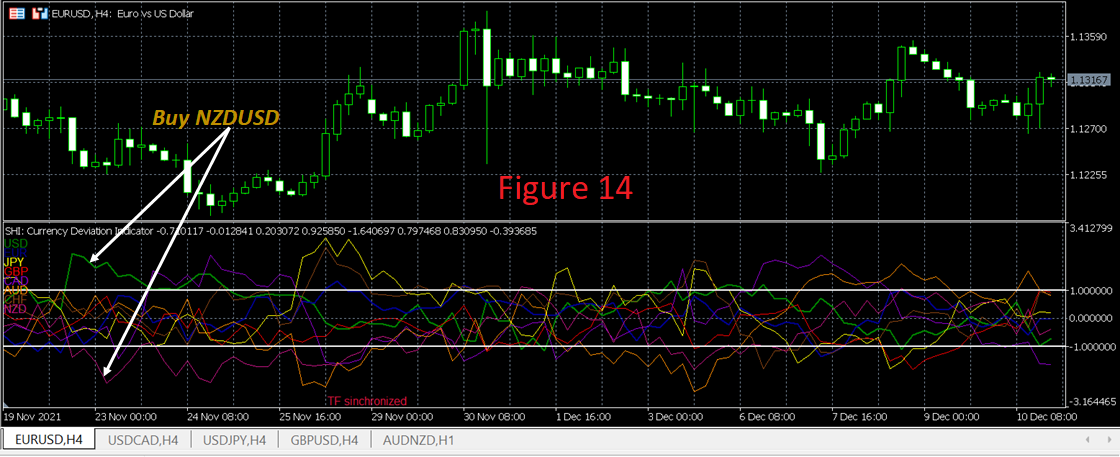
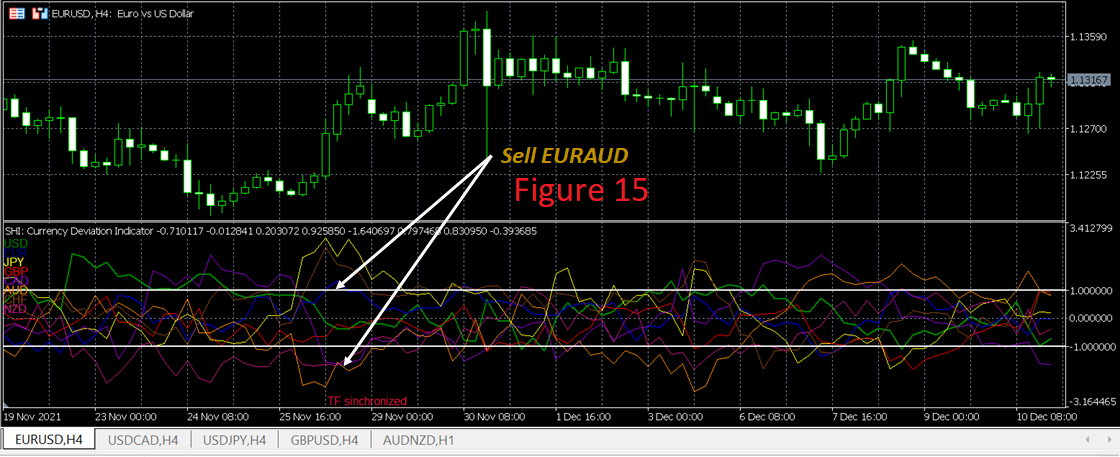
Theoretically, the set of situations in which the difference in the standard deviation is greater than two can be considered as trading signals. however, keep in mind that the best signals are those for which the values of this sub-indicator for two currencies have an opposite sign (Ex +1.2 and -1.2).
Please also note that you can use values greater than the difference 2 to get more robust forex signals (using values less than 2 is highly not recommended).
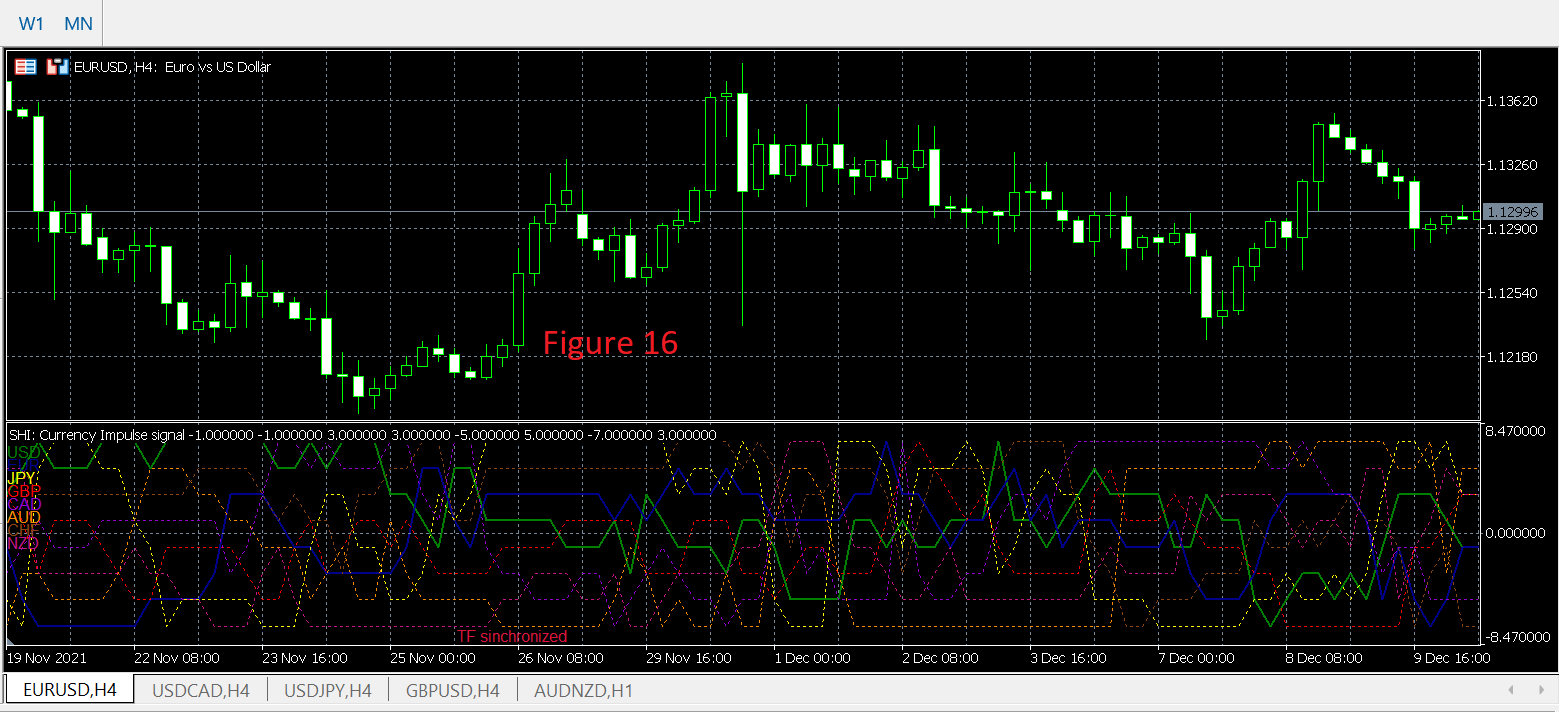
V. Currency Impulse Signal Indicator.
Currency Impulse Signal is a tool designed to early detect changes in currency trends. This sub-indicator is calculated as follows: each currency is compared with the seven other currencies, if the price of this currency is increasing against another currency, then we add +1 to its index and if the price of the currency is decreasing, then we add -1 to its index.
Finally, we get 8 currency graphs between -7 and +7 (Figure 16). this indicator allows traders to detect times when there is a great probability of change in trend in order to guarantee early entry to the markets and ensure to exit the markets at the right time. the default period of this indicator is 14 but you can adjust it according to your strategy.
VI. Trend Power Indicator.
Is an indicator which is mainly used to confirm the signals detected by the sub-indicators 1,2,3 and 4. this indicator does not tell you the direction of the trend, its role is limited to calculating the power of the trend of each currency. if the value of this indicator is high then the trend is powerful for a given currency (Figure 17).
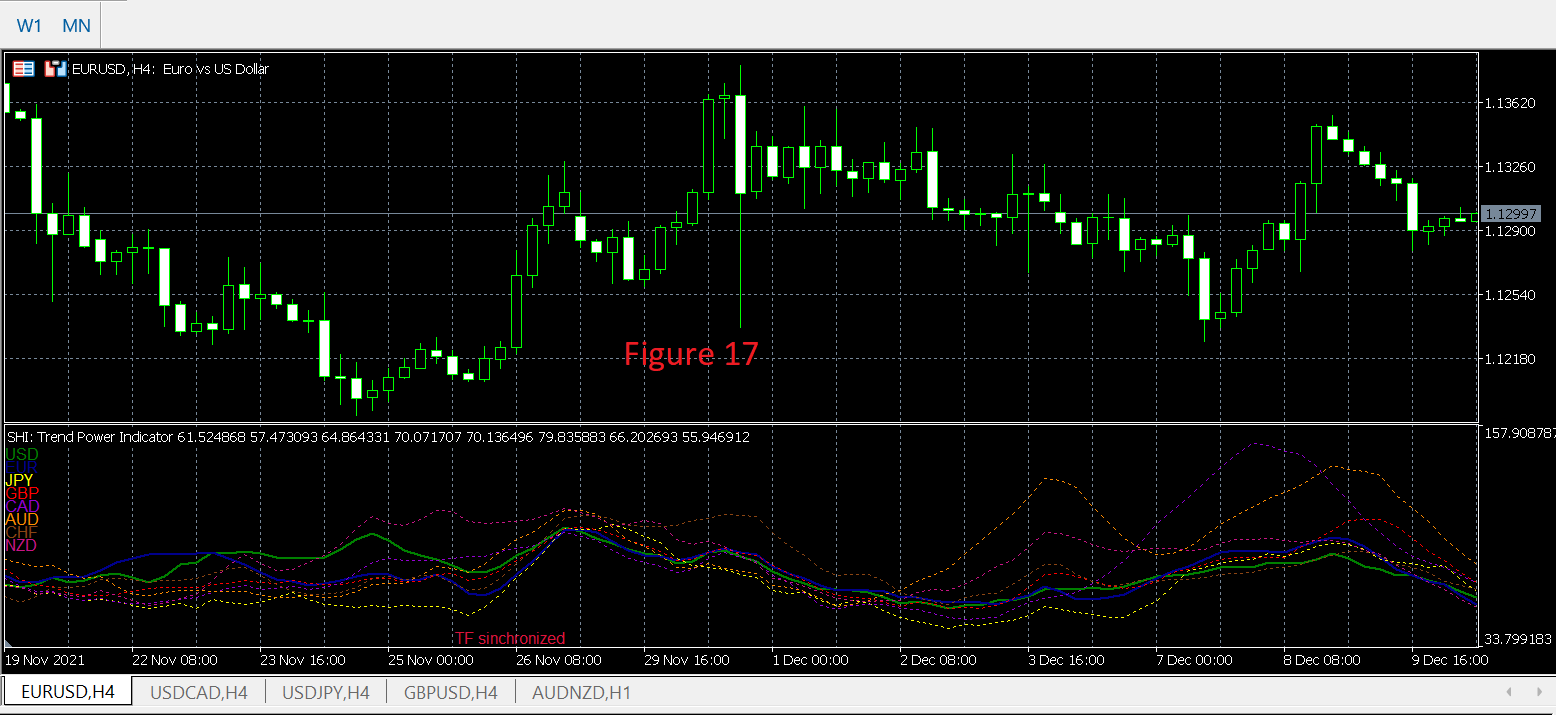
Indeed, there are theories saying that the signals at the time of weak market trend are to be neglected. the signals to be considered are those which appear in times of strong trend.
The use of this indicator is very simple. if the sum of the values of this indicator for two currencies A and B is greater than 100 then there is a trend (signals are to be confirmed) and if this sum is smaller than 100 then the trend is low (signals are not to consider). The default period for calculating this indicator is 14.
VII. Currency Volatility Indicator.
Is an indicator that calculates the volatility of each currency, the indicator has two calculation options (in pip and in percentage – Figure 18 and 19). The default period for calculating this indicator is 14.

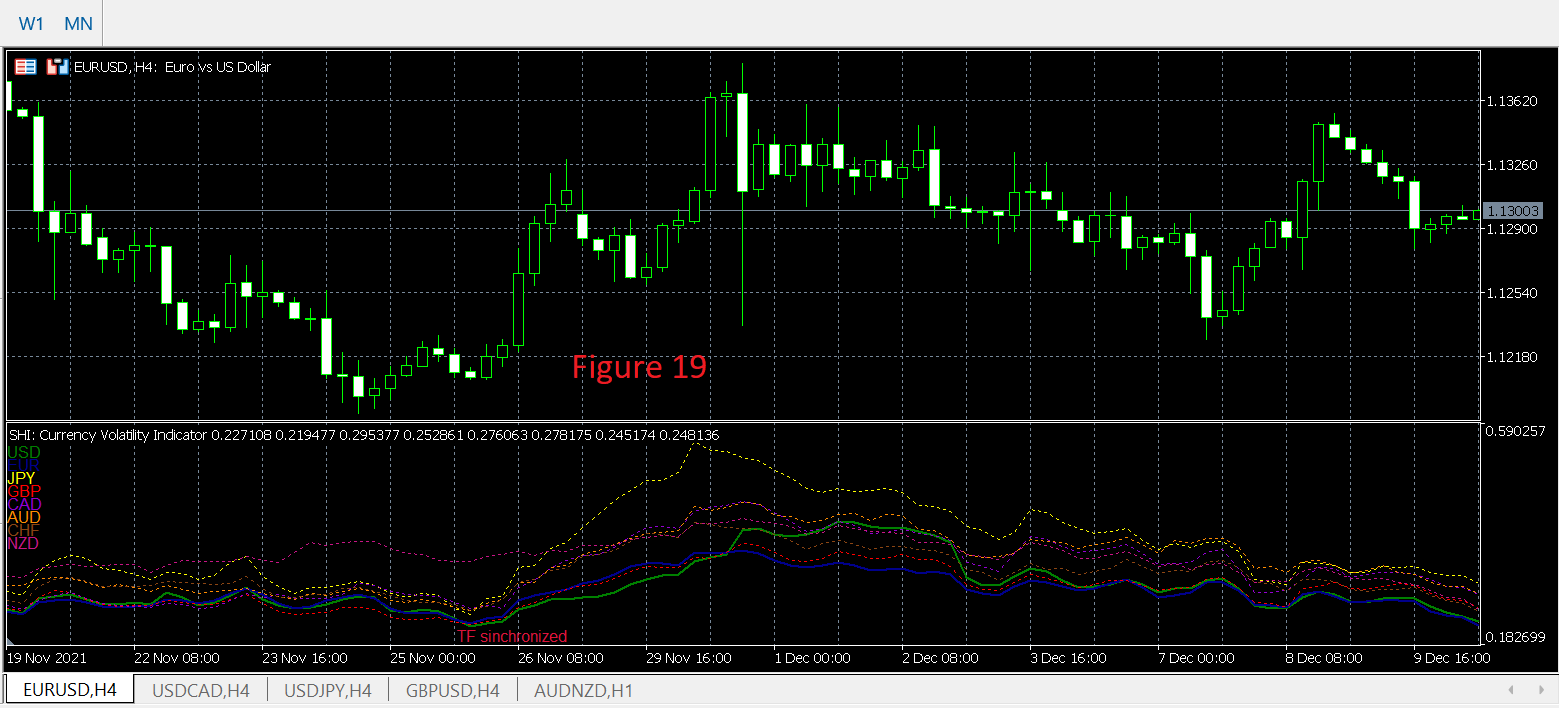
Volatility is used for many purposes in currency markets. For example, it is used to detect changes in trend and to identify stop loss and take profit levels.
Generally, stop loss and take profit are calculated by multiplying the average volatility by a Multiplier (2 or 3).
So, the formulas for getting the stop losses and take profits for a currency pair (currency A and currency B) are:
- Take profit = Current price + ((volatility of currency A in pip + volatility of currency B in pip)/2) *Multiplier.
- Stop loss = Current price – ((volatility of currency A in pip + volatility of currency B in pip)/2) *Multiplier.
The multipliers widely used are 2 and 3 but you adjust them according to your trading strategy. But please note that these values are only for large timeframes. If you are using smaller timeframe then you must use values greater than 3.
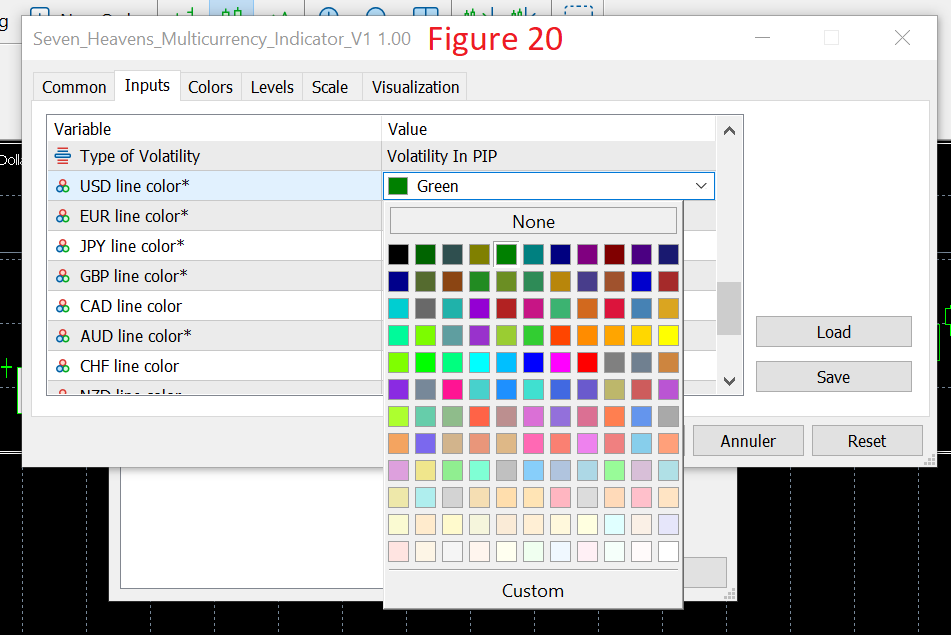
The Seven Heavens Indicator contains many customizable parameters that allows you to:
- Show or not a currency (EUR, USD, JPY…), set theses variables to true if you want to show a currency and false if you want to hide it.
- Define the color of a currency (Figure 20).
- Define the width and the style of the graphs (for the currencies of the current chart and for the other currencies).
- Show or not some comments of the sub window of the indicator.
Please note that this indicator will not load in the weekend for certain brokers.