")

Tick Chart (How it works)
MT4: www.mql5.com/en/market/product/70241
In this section, you will see how each part of this indicator works.
As you know, this indicator consists of 3 parts.
In the settings, you can specify which section to enable.
In these settings, you can choose one of 3 possible modes:
1- Tick Chart
2- Tick Difference
3- Tick Multi Currency
Part One: Tick Chart
In this section, you will see the tick data.
Tick data includes the price of Bid and Ask.
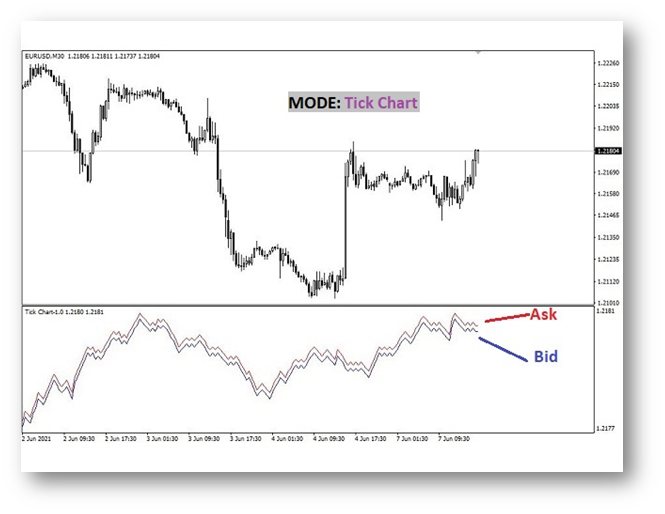
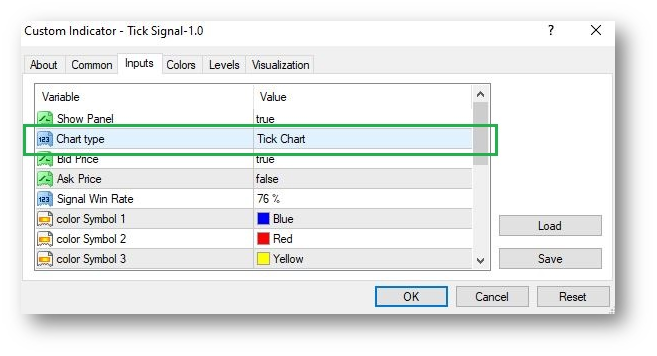
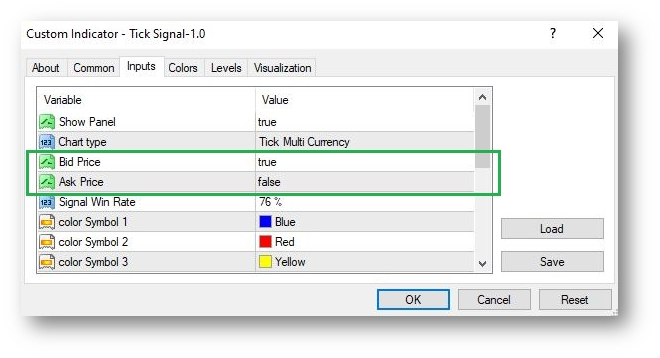
You can specify which line to see in the settings. Bid or Ask or both
Tick data is useful for those who want to use more accurate data. Or those who want to view data in less than a minute. For example, those who do binary trades.
In the settings of version 1, according to the picture above, options three and four, are related to this section. And the rest of the settings are related to different parts of the indicator. That is, the second and third parts.
This section has no other explanation and is simple.
second part: Tick Difference
In this section, you will see the difference between the tick data and the previous tick. That is, if the price of the previous Bid is equal to 1.12345 and the price of the current Bid is equal to 1.12348, you will see the number 3. Because the price of Bid has increased by 3 points.
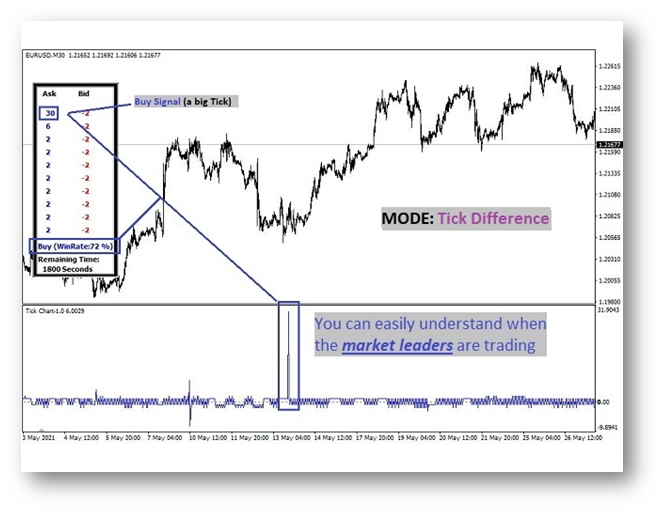
If the bid price difference is large, it indicates that big deals have been made. That is, the greats of the market have probably traded.
If the difference is positive, it means that the trade is buy. But if the difference is negative, it means that the Sell has been done.
As you can see in the figure above, if the value of the indicator is too high, we can use it as a signal.
but do not worry. We do not trade on a large tick. The way this indicator works is that there should be a large number of large ticks.
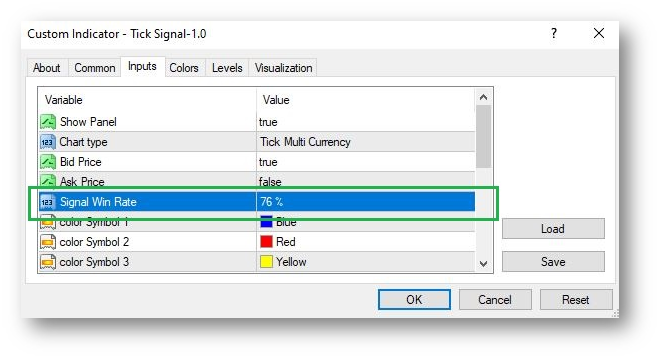
You can also increase the Win rate in the settings.

The higher the Win rate you choose, the stronger the signals you will receive.
If the signal you receive in the panel is higher than the Win rate you specified in the settings, you will see a signal in the chart.
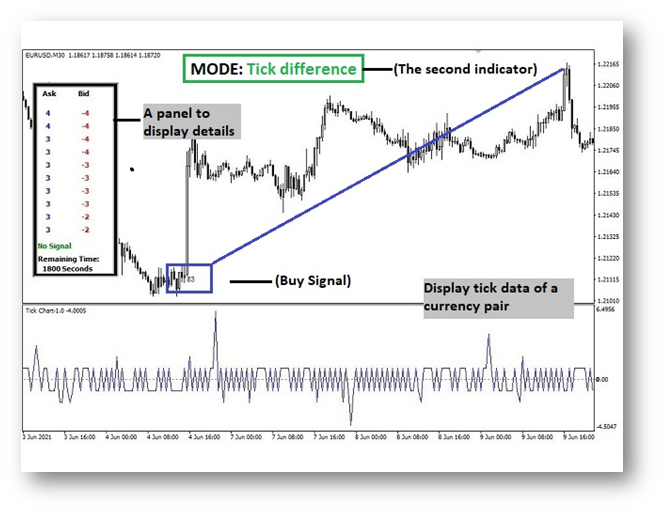
You can also hide the panel. Using the settings, you can easily hide the panel so that it does not block your view.
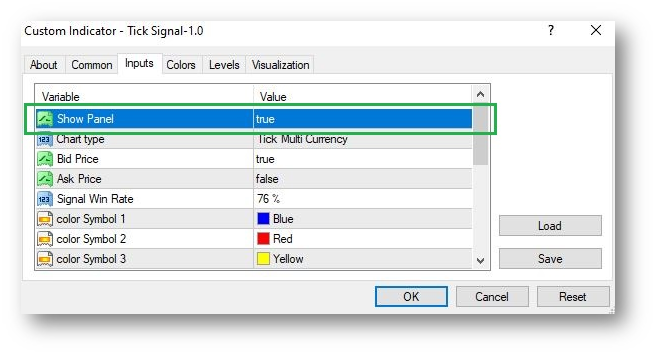
The settings for this section are just the two I told you about. (Hide panel and change Win rate)
third part: Tick Multi Currency
The best part of this indicator is this part. You can get high Win rate signals.
This section performs calculations based on 14 different currency pairs of signals.
That is, the calculations in this section are exactly the same as in the second section. But with the difference that the signals you receive are confirmed by 14 different currencies.
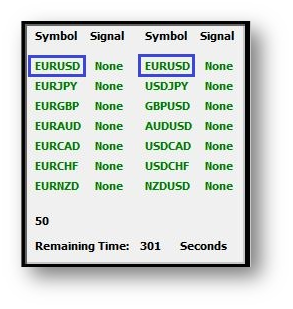
Example: If we have a sell signal in the EURUSD currency pair, this signal must be confirmed in different currency pairs. For example, in the USDJPY currency pair, we must receive a buy signal. Because in this case, the dollar currency in both, will be stronger and we will have a buy signal for the dollar.
Finally, the average is taken. If the average is higher than the Win rate you set in the settings, you will see the signal in the graph.
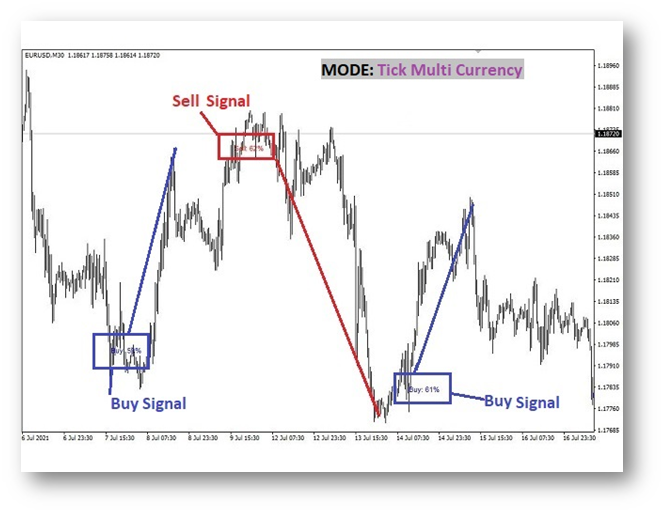
Note that the signals you receive in this section are rarely above 70%. But rest assured that they have a lot of power. For example, signals with a Win rate of 60% act like signals with a Win rate of 80%. Because they are approved by several currency pairs.
So in the settings, it is better to set the Win rate of this part to 60%. Or even less: 57%
You can also delete the panel in this section. In the panel, you will see the amount of signal per currency pair.

In the panel, we will have useful information. You can also see the value of the original signal. This signal is the product of the average signal of all currency pairs. The 14 currency pairs you see in the panel.
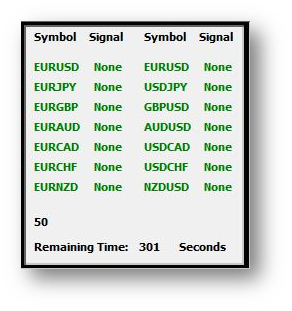
This panel is almost like the second part panel. At the bottom of the panel, you will see the signal update time. The signals are updated every 30 minutes. That means we will have a signal every 30 minutes.
Note that the best time frame to run this indicator is a 30 minute time frame. Because all calculations are updated every 30 minutes. But you can also run in other timeframes.
The time you see at the bottom of the panel is based on seconds.
But at the bottom of the indicator, you can see the tick chart of each currency pair. That is, the tick changes of 14 different currency pairs.
If there are more positive changes, we will have a buy signal. And if the changes are negative, we will have a sell signal.
You can also change the color of each line.
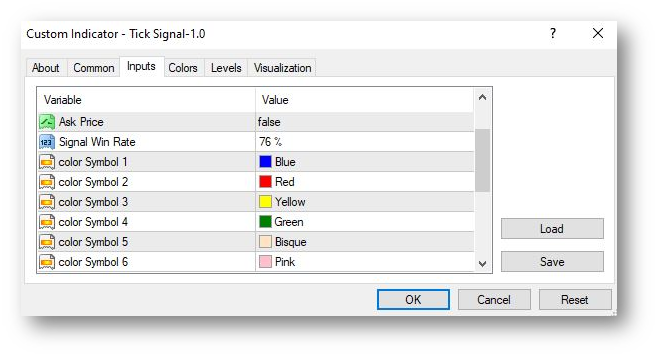
You can change the color of each symbol. You can see the number of each symbol in the "data Window".
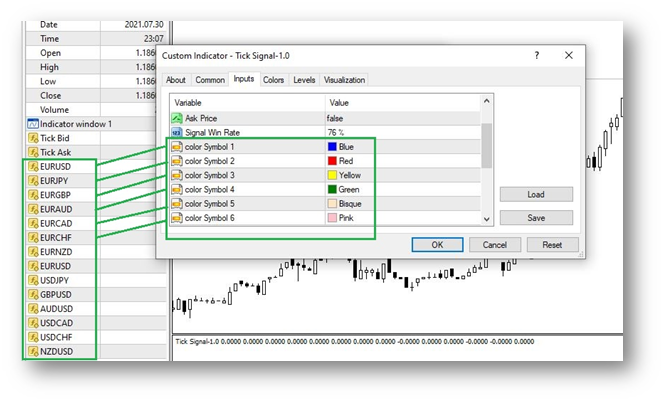
Note that the original currency pair in which you receive the signal is counted twice.
This was a guide to how this indicator works. If you still have questions, it is better to search in the FAQ section. Or read the settings guide for this indicator. Good luck.


![[Two Different Approaches to Market Timing]: The Spiral Calendar and the VISTmany Research Project](https://c.mql5.com/6/1012/splash-preview-771691.png "[Two Different Approaches to Market Timing]: The Spiral Calendar and the VISTmany Research Project")
