

Adaptive Support and Resistance User Manual
The ASR indicator will help you identify key Support and Resistance areas from any timeframe of your choice! Add multiple Zones and Edit individual zone settings all through one beautifully designed panel.
Please read this manual for Support and Resistance Information, indicator calculation explanation, parameter explanations, and recommendations.
Contents:
- What is Support and Resistance
- ASR Parameters Explanation for Instance Settings
- Main Panel Buttons and Quick Toggles,
- Hard inputs of Indicator
- Recommended Settings
- Notes About Indicator (Restrictions, Saving Chart Templates, etc
What is Support and Resistance?
Support and resistance are certain predetermined levels of the price of a security at which its price will tend to stop and reverse. These levels are identified by multiple touches of price without a breakthrough of the level. If one of these levels is above current price, that line acts as resistance and if the level is below current price, it acts as support.
This Image represents this:
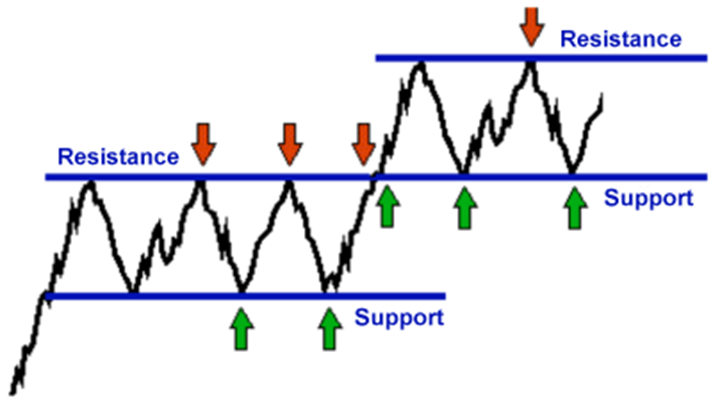
The main idea is that after price rejects a level the second time, it can be considered a Support/Resistance level. When price reaches that same level again in the future there is a probability it will react at it again and you should plan accordingly based on your trading style.
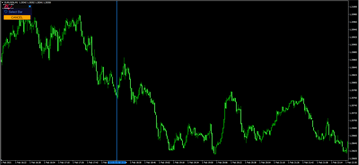
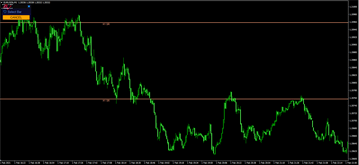
Here is a live example of what that looks like on a live GBPUSD chart, only now the zones are automatically drawn for you by the indicator. This example shows the Hourly SR zone on an Hourly chart:
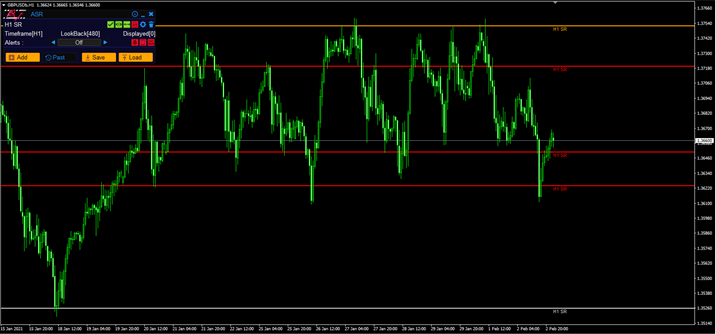
As you can see, it maps out exactly where price tends to reverse and react around. The indicator will identify these swing points that are reacting around the same price level and plot them on the chart for you.
ASR Parameters Explanation for Instance Settings
When Editing/Creating an Instance, ASR has 5 main sections for settings. The following will explain the settings for each section and how they are incorporated in the indicator.
Basic Settings

- Name – Enter a unique name for the instance. Will be displayed on main indicator panel. It needs to be unique otherwise upon creation, indicator will notify and remove it.
- TimeFrame – Select the timeframe that the indicator will look at for its calculation.
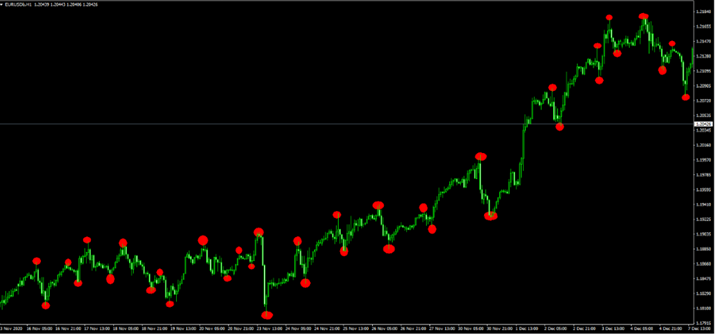
- Sensitivity – Choose the sensitivity for looking at swing points for the calculation. You can choose between:
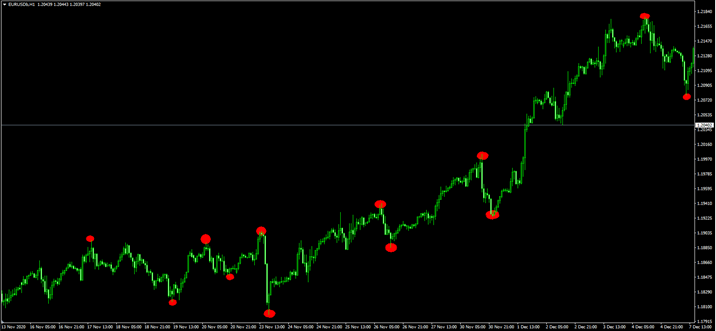
*Low: The least filtered. Will look at all swing points (Minor, Major, and Extreme). Example of points this setting would look at (Red circles):
*Medium: Filters out less significant swing points. Example of what points it would identify (same chart as picture above):
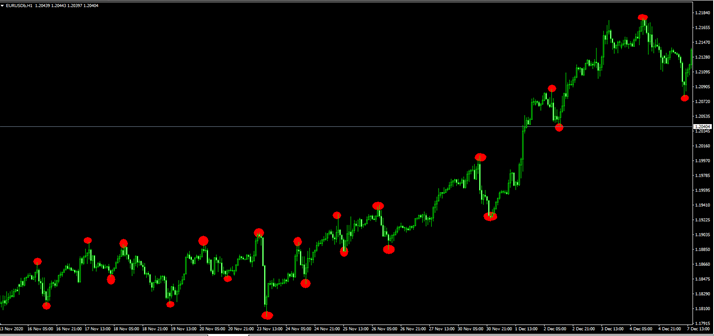
*High: The greatest filter setting. Will only look at extreme points. Example of what points it would identify (same chart as picture above):
- LookBack Bars: For the selected Timeframe, enter how many bars you would like to look back for detecting these zones. A TimeFrame of H1 and Lookback of 500 will look in the past 500 bars of H1 Timeframe.
- Displayed Bars: How many bars back to display the zones. This will show what the zones where like “X” bars ago including zones for the current period of the SR TimeFrame. Lines will stay printed and will not disappear. If you leave it as 0, it will only display what the zones are for the current period of SR TimeFrame. The indicator recalculates zones every new bar of the SR TimeFrame, so it will reprint new zones after a new bar.
- SR Across: Choose whether to display the zones only for the current period of the TimeFrame or extend the lines across the screen.
Alerts/Price Boxes
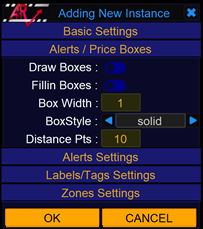
- Draw Boxes: Turn boxes around zones on/off.
- Fillin Boxes: Select whether to fill boxes with color or not.
- Box Width: Enter the line thickness of your box.
- Box Style: Choose the style of line for your box.
- Distance Pts: Enter the distance from the line to the outside of the box. This value is measured in points. If you enter a value of 100, it will draw the top of the box 100 points above the SR zone and the bottom of the box 100 points below the SR Zone. If you have alerts on, you will receive the alert based on price entering the Box you have created around the zone. Leaving it as a value of 0 (no box width) means price needs to touch the actual SR zone to be notified.
Alerts Settings
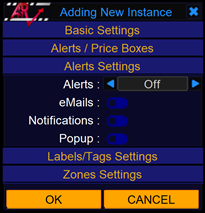
- Alerts: Choose what zones you would like alerts from. There are 5 options:
*Off: Receive no alerts
*All: Receive alerts on all zones
*Weak+: Receive alerts on only Weak, Strong, and Stronger zones
*Strong+: Receive alerts on only Strong and Stronger zones
*Stronger Only: Receive alerts only on Stronger zones
- Emails: Toggle email alerts on/off.
- Notifications: Toggle push notifications to phone on/off.
- PopUp: Toggle on screen alerts on/off.
Labels/Tags Settings
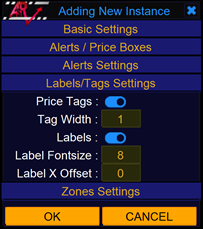
- Price Tags: Toggle Price Tags on/off.
- Tag Width: Set the width of the Price Tag.
- Labels: Toggle labels on/off.
- Label FontSize: Set the Font Size of the label
- Label X Offset: Adjust the offset of the label ‘X’ bars back or forward. Entering a positive number will offset the label X bars back and entering a negative number will offset the label X bars forward. Use this if you have multiple zones and they overlap causing labels to overlap as well.
Zones Settings
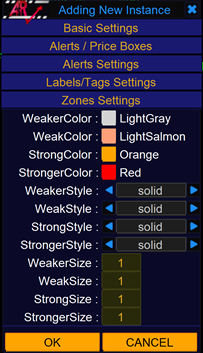
- ZoneColor: Set the individual colors of all zone strengths.
- ZoneStyle: Set the style of line of all zone strengths.
- ZoneSize: Set the line size of all zone strengths.
Main Panel Buttons and Quick Toggles
On the main screen of the ASR panel, you will find all the instances you have added. Each instance will show its own set of information and individual settings that are available for “quick” editing. On the top right of each instance, you will find 6 images/buttons and they are as followed (Highlighted in Red):
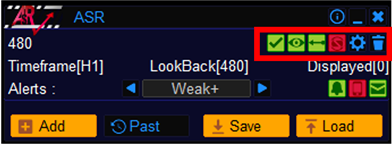
- CheckMark: Lets you know that the indicator has calculated (Green) the SR zones for that instance or has not calculated it (Red).
- EyeBall: Toggle the zones for that instance to be visible or not. Green is visible, Red is hidden.
- Arrow: Toggle the zones for the instance to be drawn across the chart (Green) or just for the current period of SR Timeframe (Red).
- “S” Symbol: Toggle to draw the boxes for the zones (Green with Box displayed) or turn boxes off (Red with “S” symbol.
- Gear: Access the full settings of the instance.
- Trashcan: Completely remove the instance from the panel and your chart.
Below those quick toggle bottoms, the bottom right of the panel contains quick toggles for you alerts and to the left of those you can select what alerts for zones you want (or disable all alerts). They are as followed (Highlighted in Red):
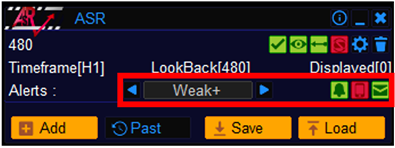
- Alerts: Choose between Alerts Off, All, Weak+, Strong+, or Stronger only.
- Bell: Toggle on screen alerts on/off.
- Phone: Toggle push notification to you phone on/off.
- Mail/Letter: Toggle email notifications on/off.
The bottom of the entire panel you will find 4 buttons (Highlighted in Red). There are as followed:
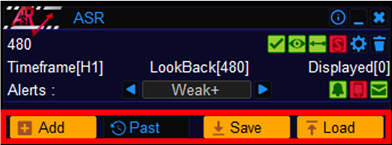
- +Add: Click this button to add a new instance to the panel/chart and edit the new instance settings. You will be prompted to edit/add the instance settings.
- Past: Clicking this button will access past mode where you will see a line displayed following your cursor. You can click the screen to select the bar at which the line is at. Doing so will now print what the zones you have added on your panel will look like at that bar.
- Save: Save the current instances you have added along with their settings. Clicking this button will prompt you to enter a name for the template and save them.
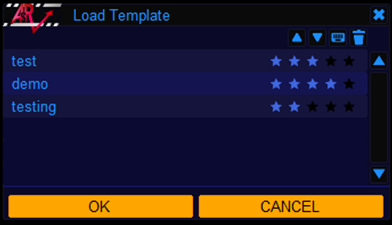
- Load: Load a previous template you have saved. You can see the names of previous templates as well as a rating to help you better identify which is which. You can also rename a template here (Keyboard symbol) or rearrange their order (arrow up/down):
In the upper right header of the panel, you will see three buttons as followed (Highlighted in Red):

- “i” Symbol: This will access a quick information tab on explanation of important indicator parameters in case you need to look over them.
- “_” Symbol: Click this button will allow you to minimize the panel to a smaller size. When you minimize it this is what you will see:
![]()
As you can see, panel is smaller, but now also displays the eyeball symbol, historical button, as well as a maximize button to expand the panel to its normal size. Clicking the eyeball button will make ALL instances in your panel set to visible/not visible (As long as they were originally set to visible) and clicking the historical button will place you in historical mode. You may also remove these two buttons in the hard input settings of the indicator to make the minimized panel even smaller.
- “X” Symbol: Clicking this button completely removes the indicator off your chart. It will delete everything including objects that were printed on the screen.
Hard Input Settings of Indicator
In the hard settings you will notice a lot of options. There are two sections:
iCustom Buffer Access
- DataBar (shift): When calling iCustom(), whatever value you enter into the “shift” parameter of function iCustom() must match this value when enterint indicator settings into iCustom().
- LineBuffer (0-4): There are only a maximum of 5 lines printed at a time near price. These lines will lie between buffer 0-4. Please remember, sometimes all 5 lines will not be present as price sometimes has not reached that area yet, so values may be returned as 0. Please make sure this is the same value that you enter into “buffer” parameter of function iCustom().
- SRTimeFrame: TimeFrame to run calculations on.
- BarsToLookBack: The number of bars to look back on TimeFrame to detect swing points for the calculation.
Panel Display Settings
- On Minimize: Show Visibility: When panel is minimized, select whether to show the master visibility button.
- On Minimize: Show Past Mode: When panel is minimized, select whether to show the historical button.
- Start X: Choose panel placement along the x axis of you chart (in pixels)
- Start Y: Choose panel placement along the y axis of you chart (in pixels)
- System Font: Select font of the panel. Fonts available will depend on what your computer has installed.
- Panel Color Settings: The rest of the settings below are for you to be able to customize the panel colors to your choosing.
Recommended Settings:
Your settings and instance setup will differ entirely upon your style of trading. However, I can give some general guidelines as far as setting up instances. Here are some tips and recommendations when setting up your instances:
- Use higher time frame zones when trading for key areas. Higher Timeframe zones will hold a little more weight than using lower Timeframe zones or applying the same SR Zone as your chart Timeframe For instance, if you are trading off the M1, I would suggest using a combination of M30, H1, or H4 SR Zones. If you are trading off the M15, looking at H4, D1, or W1 SR Zones will be beneficial.
- Use lower time timeframe zones to assist with trailing stops or partial closes. If you trade M1, you can use M5 or M15 zones as areas to adjust your stop losses or partial closes and use higher timeframe zones for the absolute closure of orders (or possible entries)
- Depending on your style of trading, you can adjust the Look Back bars setting for the calculation. However, as a general rule, the Weekly time frame SR you should look at 2-3 years’ worth of data (104 - 156 bars), Daily about 6 months to a year (253 - 506 bars), H1 and H4 about 3 months or less. any Time frame below that, maybe about 2 weeks - month depending on your trading.
Notes about the Panel:
- Each instance you add will have to have a unique name. This is one of the ways the panel recognizes different inputs/settings. If you try giving an instance a name that exists, the panel will remove it.
- You can only add up to a maximum of 9 instances.
- You can't have a lower timeframe SR zone on higher time frame (for example, M1 SR zone on H1 Chart). The indicator wont remove it from the panel, but it will not run the calculation and therefore not print any lines. The result will have the calculation light as Red.
- Indicator calculations are heavy, so there is a limit set to how many Display Bars you can have based on what chart period you're on and SR timeframe you have loaded. Indicator will automatically reduce the number if its too high. The higher the display bars, the longer it will take for calculations and time for lines to be printed. Please used Historical Mode for back testing as it will be quicker.
If you have any questions, Please send me a message and I'll help you immediately.
Thank you,
Alexander


