

The StopHunts Indicator has a unique algorithm that can get you into the market ahead of price itself. Join the market makers and stop trading with the herd. It took me more than a year of development and testing. This will be the last indicator I will release. When traded correctly the indicator and the following method always gets you into high probability setups.
IF YOU WANT TO JOIN A COMMUNITY OF TRADERS HEAD OVER TO: the-tradersedge.com/stophunts
7-days FREE trial
“I believe the very best money is made at the market turns. Everyone says you get killed trying to pick tops and bottoms and you make all your money by playing the trend in the middle. Well for twelve years I have been missing the meat in the middle but I have made a lot of money at tops and bottoms.” Paul Tudor Jones
THE FAIR VALUE OF PRICE
The fair value of price is the base of our method.
How do we find the fair value of price on the charts?
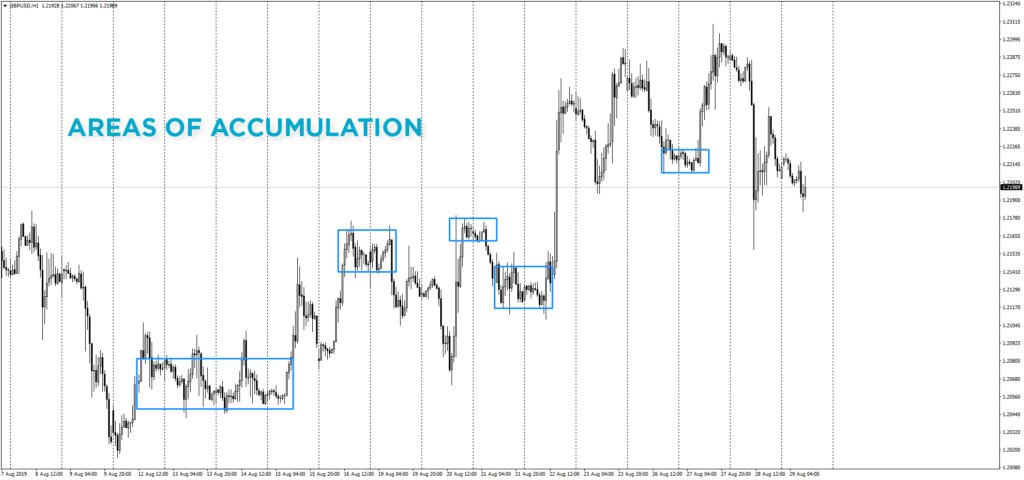
Look at the following chart example. If buyers and sellers agree on a fair price, what does that mean? Price would slowly go up and down bringing us to some sort of accumulation. Means further that price should go sideways.
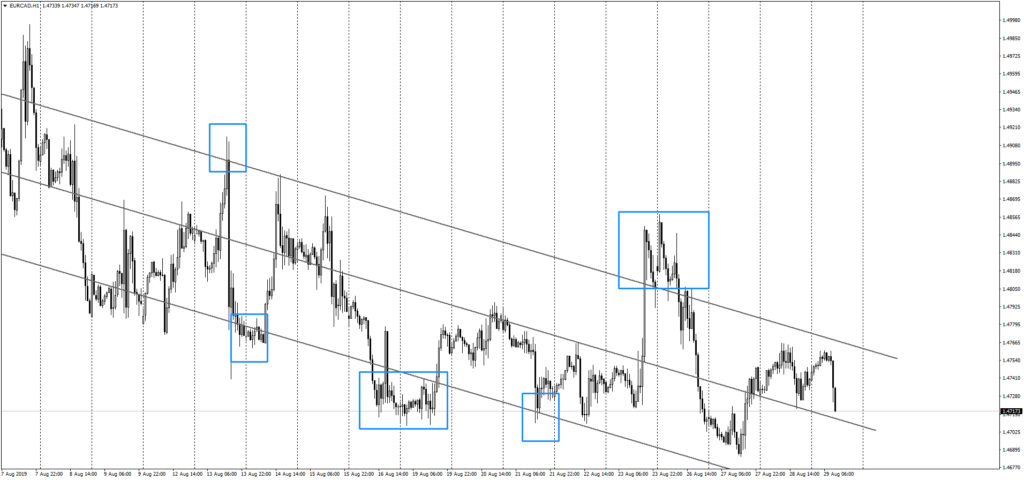
We are in an uptrend. What we are looking for is a certain movement of price. We can definitely say buyers and sellers agreed within these areas of accumulation.
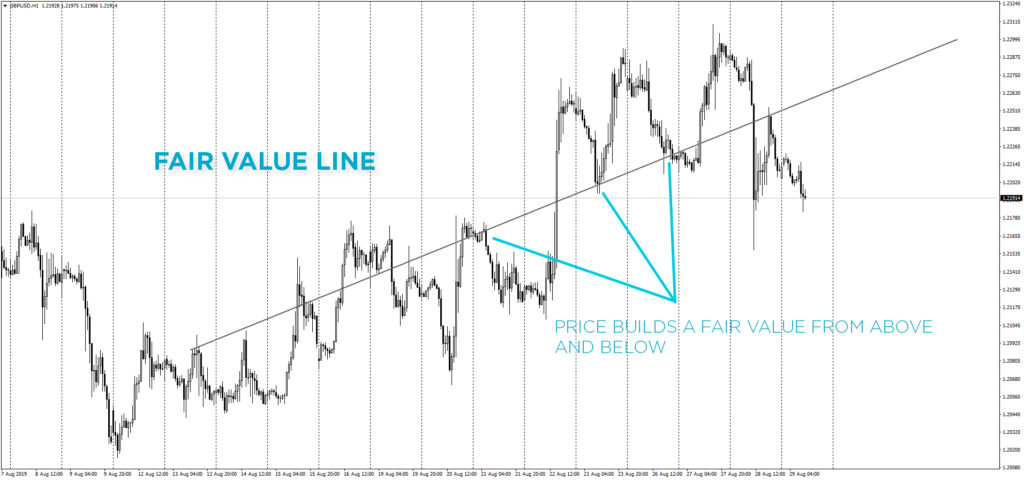
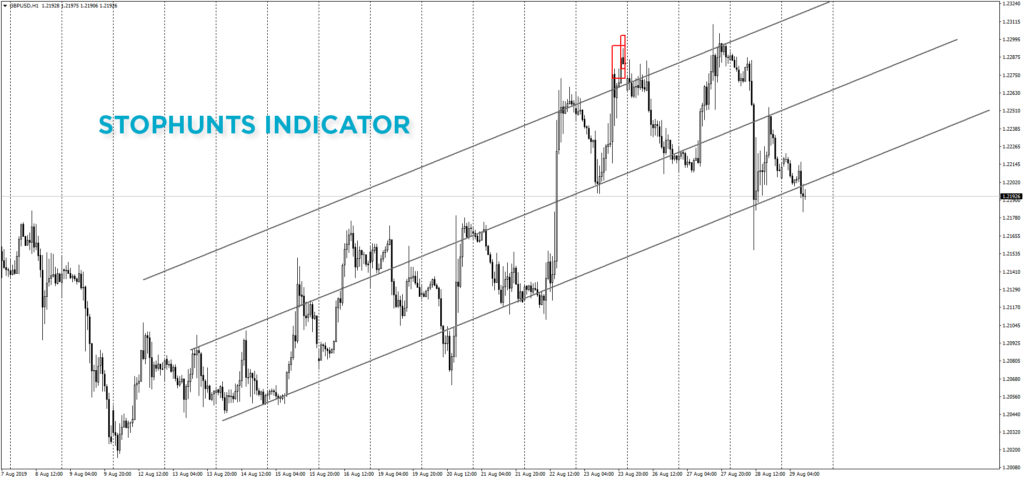
But I want you to look at a bigger picture. Let me draw a line in here. What you can see now is that price is moving around that line from the upside and the downside. This is our fair value of price seen from a different point of view. Long term positioned traders like funds etc. are positioned long. But still, price always returns to its fair value where buyers and sellers agree on a price.
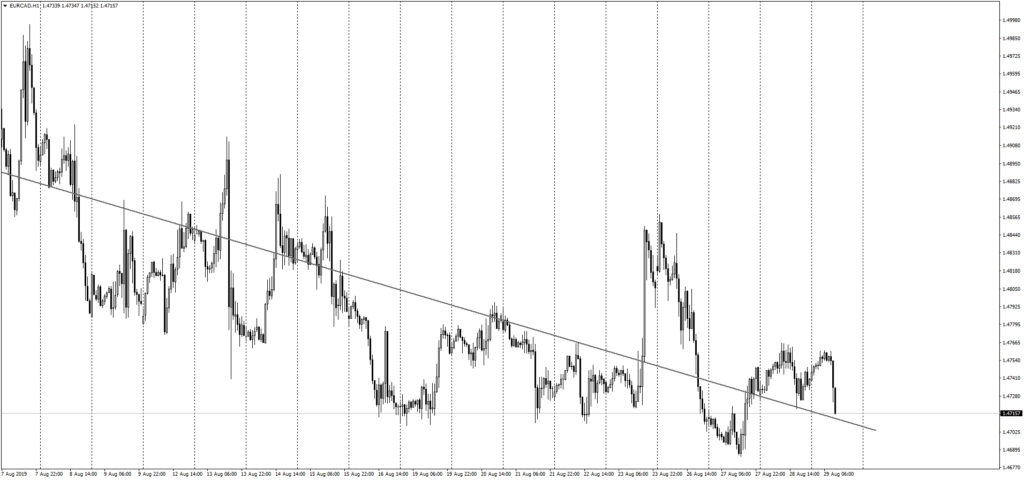
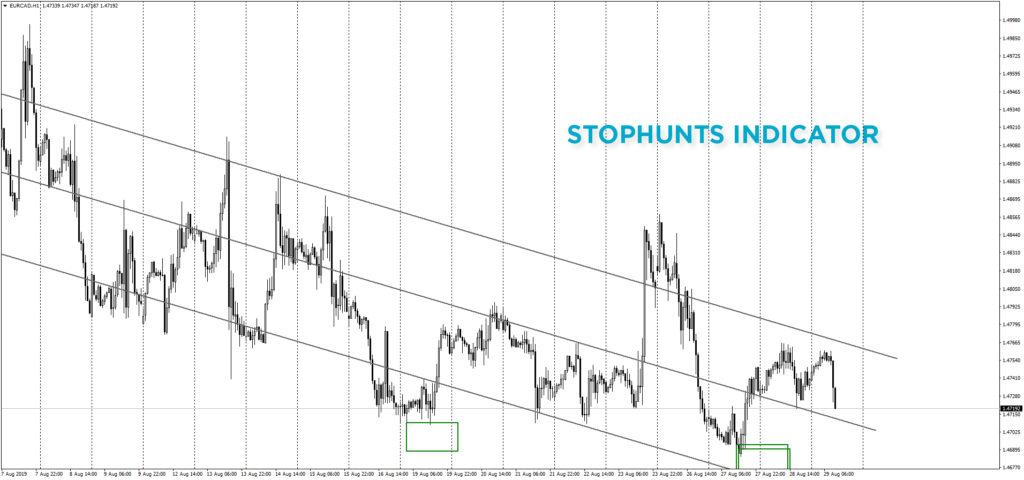
Here is another example of a downtrend. Again you can see how price is reacting to the line from the down- and upside.
This line is our fair value of price.
EXCESS AREA
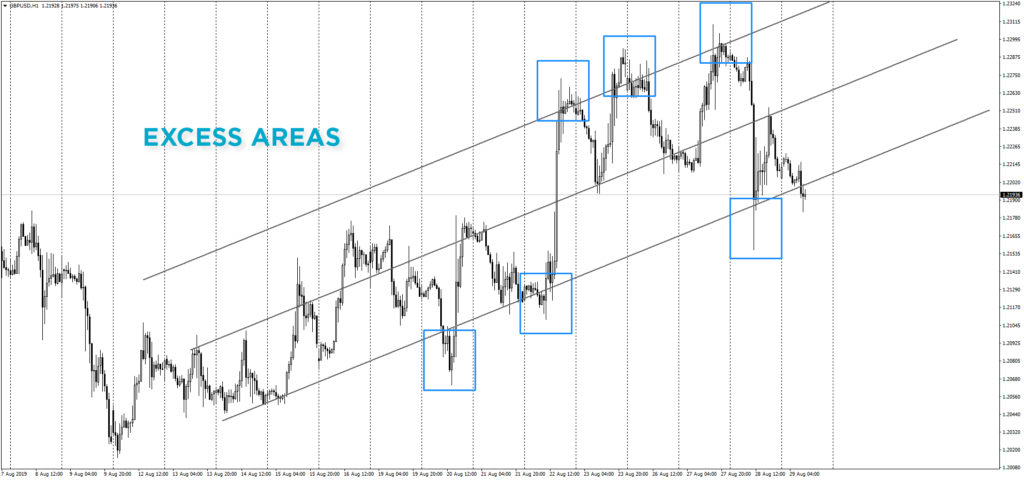
Now that we know the fair value of price, we know that these areas always have two sides. One side were price comes from above and one side were price comes from below.
We not gonna take trades just based on a simple line, that would be crazy. Let us get back to our first example chart. We are in an uptrend. We want to enter a trade when the smart money realizes that no buyers and sellers want to buy or sell for a certain price anymore. This brings us to the second type of line we gonna draw in to identify a certain areas where price exceeds its limits.
What we are going to do, is to duplicate our fair value price line and drag it up. In a downtrend you draw the upper line first. In an uptrend you will draw the lower line first. In this example we are in an uptrend . Let us drag our line and drag it down. And you want to drag it down to the point where as little as possible price reaches over that line.
Once we are done with that, we duplicate our fair value line again and drag it up. Now this is really a visual part. You want to drag the line up at approximately the same distance as you dragged the lowerline down. What we have now is some sort of channel. As you can see now. We have areas were price reaches outside the channel. This is an excess area. An area were price could not go higher. The smart money had to bring the price back to the fair value to attract buyers again.
THE STOPHUNTS INDICATOR
Here is a quick summary of what this is all about
IF YOU WANT TO JOIN A COMMUNITY OF TRADERS HEAD OVER TO: the-tradersedge.com/stophunts
7-days FREE trial
This will be the last trading indicator I will ever develop and here is why
HAPPY TRADING!!!
(If you want to read more about my basic view of the markets feel free to read my other blog post: https://www.mql5.com/en/blogs/post/730024
)


")
