
Getting in the Groove – Roller Coaster
In my recent article discussing the MACD Stochastic Cross I concentrated on the technical theory behind our Roller Coaster trading strategy. This article follows on from that, as I want to address the importance of finding the correct time frame for each instrument you want to trade. I also want to discuss Risk to Reward against Win Rate.
The Groove
Our Roller Coaster Indicator Suite works for Stocks, Forex, Futures and Crypto Currency. However, understanding the behaviour of each instrument on differing timeframes is important. In my Core Trading Strategy class, I discuss the importance of understanding the behaviour of Institutional traders and how they move the markets. Taking this a little further when we are looking at specific instruments, whether a stock or a currency pair is the next step.
The Roller Coaster is there to trade the flow going from overbought to oversold zones and so on. But this doesn’t happen on every single timeframe for a specific instrument. Institutional traders will favour certain time frames to trade a specific instrument, depending on data and market conditions. All we must do is “take a look” through main timeframes and find where our Roller Coaster is in the same Groove as those traders. Now this can change over time so make it a weekly task to check through multiple timeframes.
Look back periods when scanning for Roller Coaster Groove
When looking back we suggest the following periods to truly understand how an instrument is behaving or “In the Groove”
- Daily Time Frame – 1 Year Back
- 4hr or 240min – 6 months back
- 1hr or 60min – 6 weeks back
- 15min and 30min – 2 weeks back
- 1 – 10 minutes – 2 days back maximum, try last 24 hours!
(Please note this look back period is for use with our Roller Coaster Indicator suite and not the other suites we produce)
Forex Pairs
Most Forex traders have their “Go To” Currency pair to trade or a short list. This is a great idea as you become intimate with their behaviour. Not all short-term trades are the best with Forex in the current market conditions as ranges can be reasonably tight. However, moving up timeframes to try and understand the upper and lower bounds in which a Currency Pair is trading is advantageous. Especially when looking for the “Groove” of our Roller Coaster Indicator Suite.
EURJPY
This Forex Pair is behaving well with our Roller Coaster on the 240min timeframe over the last 6 months with 10 trades that triggered, and all took profit! You will see that 2 signals were not triggered, in that the entry price was not moved through. Remember we class a winner as soon as the trailing top is printed beyond the entry price, making the trade “Risk Free”

Futures
Advantages with Futures trading is that we now have Micro E-Mini Futures which are 1/10th the size of Normal E-Mini Futures contracts. This works well with our Roller Coaster Indicator Suite as we can reduce risk at inception of the trade, which we will discuss later in this article when we talk about Risk to Reward. A Similar method used across all instruments; in that we must move through the time frames to find the groove of a particular futures contract.
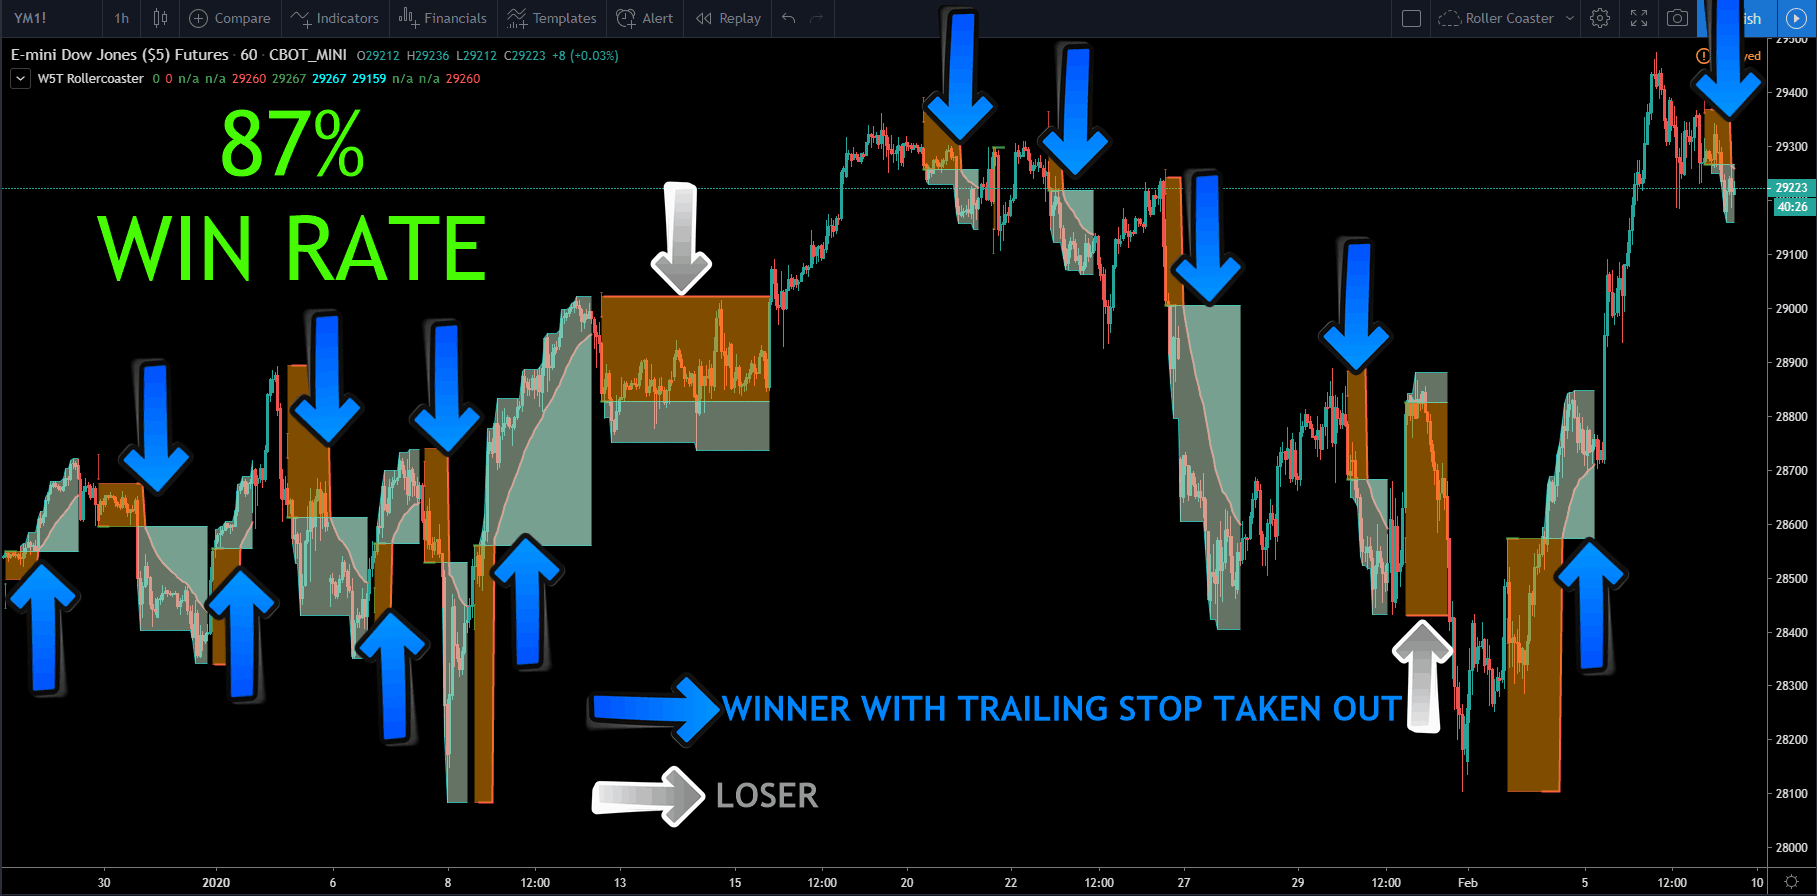
YM – Dow Futures
Again, on a 60-minute timeframe, we look about around 6 weeks back to see if the instrument is in a Roller Coaster Groove. I know this one very well as I trade this YM futures contract on the 60-minute timeframe with our Roller Coaster frequently. An 87%-win rate is around what we call average for this strategy. Remember once the green boxes print with the Trailing Stop, we are Risk free!
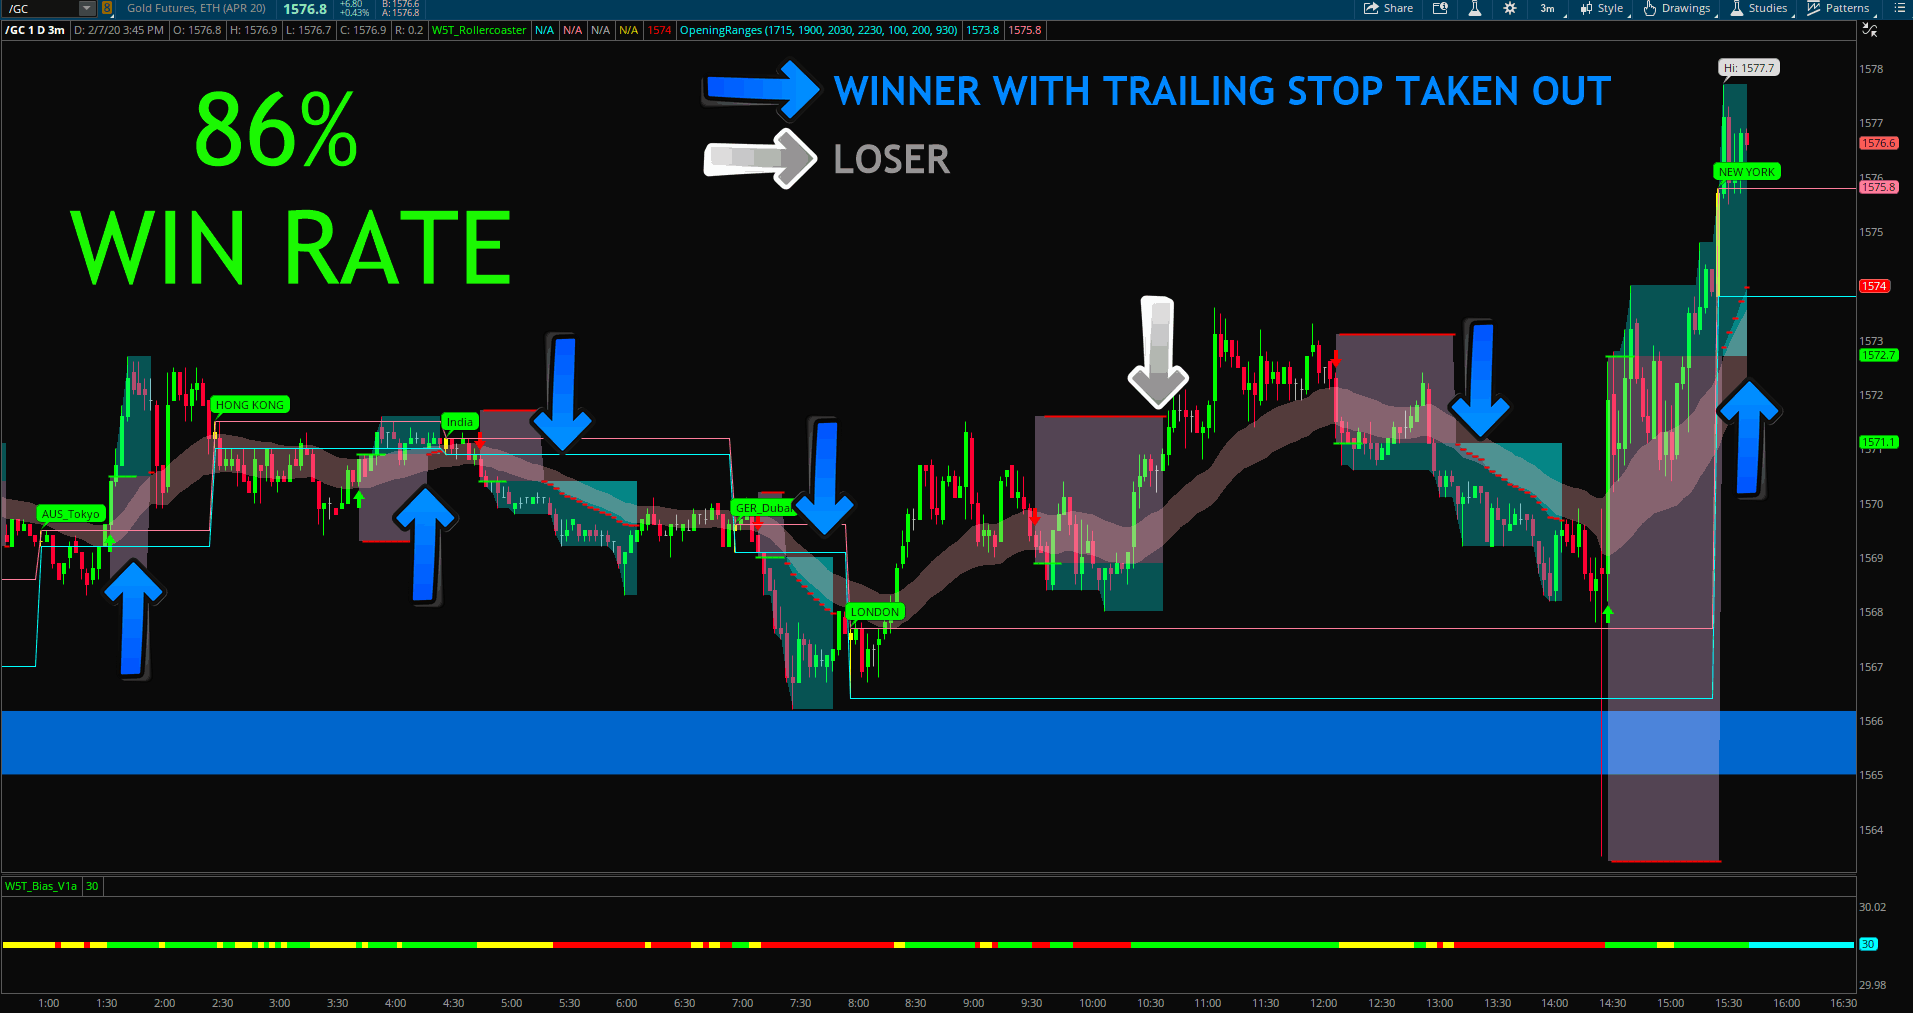
Gold Futures
Gold is currently in a lot tighter range seen well on the 60-minute time frame and so, much lower timeframes are responding well with our Roller Coaster indicator suite. 1,3 and 5 minute timeframes have a very similar win rate. Below is a recent 3-minute chart looking back over 1 day, taken at the time of writing this article. Again this 86% win rate is around the average with our strategy!
Stocks – Roller Coaster
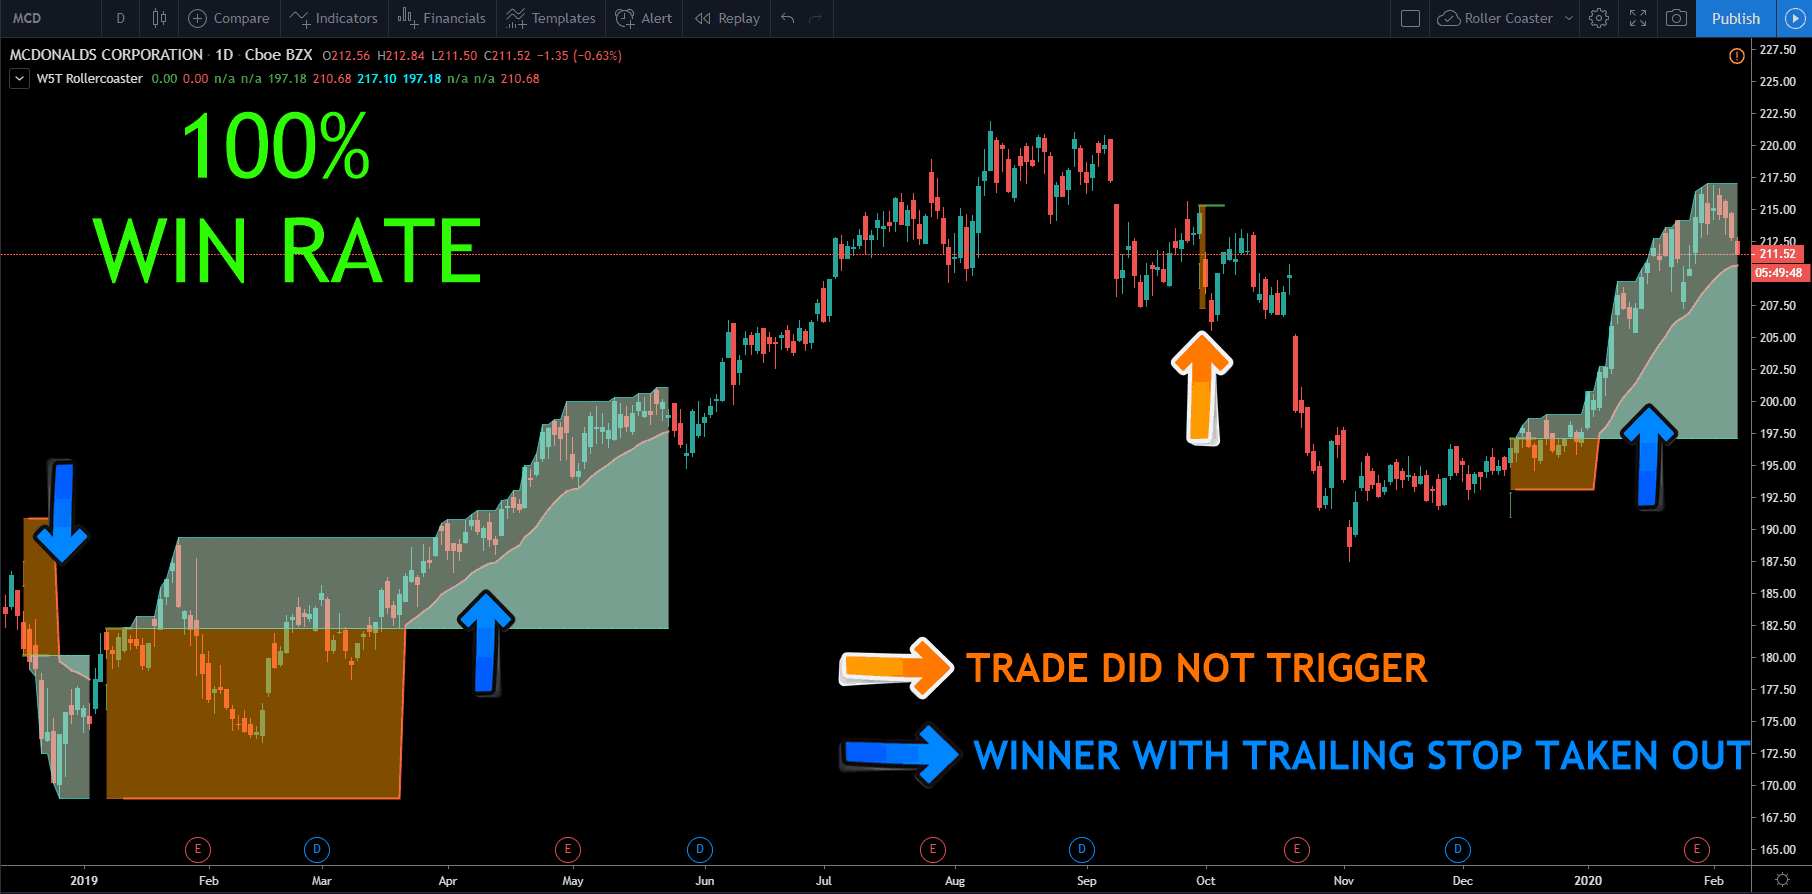
Stocks inherently are in our Roller Coaster groove on higher timeframes as major data points for individual stocks are wider apart (quarterly earnings) compared to data that affects Forex and Futures. Multiple Time-Frame Technical Analysis, that we teach in our Core Trading Strategy Online Course is essential when trading stocks with our Roller Coaster or Elliott Wave Indicator Suite.
Below is $MCD, McDonald’s Stock chart on the Daily Timeframe, looking back 1 Year. Only 3 trades in the current 1 year look back period and all winners. There was one other signal, but the entry was not taken in. When swing trading stocks, patience pays off!
Risk to Reward
Traditional Risk to Reward calculations require Stop Loss, Entry and Target prices. However, with the Roller Coaster Strategy we don’t offer a Target Price. With this type of strategy, we can get what we call “Runners”, trades that just keep going and going…. With this is mind we use our Lagging Point of Control as a Trailing Stop position, allowing the trade to run if conditions are right. We can also see that we become “Risk Free” as soon as the automated Trailing Stops get printed on your chart with the Roller Coaster Indicator Suite.
To manage Risk is still important when using any trading strategy and we say that adjusting trade size and working out the risk of the amount of Monetary loss is important. Don’t just trade the same lot size for every trade! The gap between entry and stop can vary in all trades.
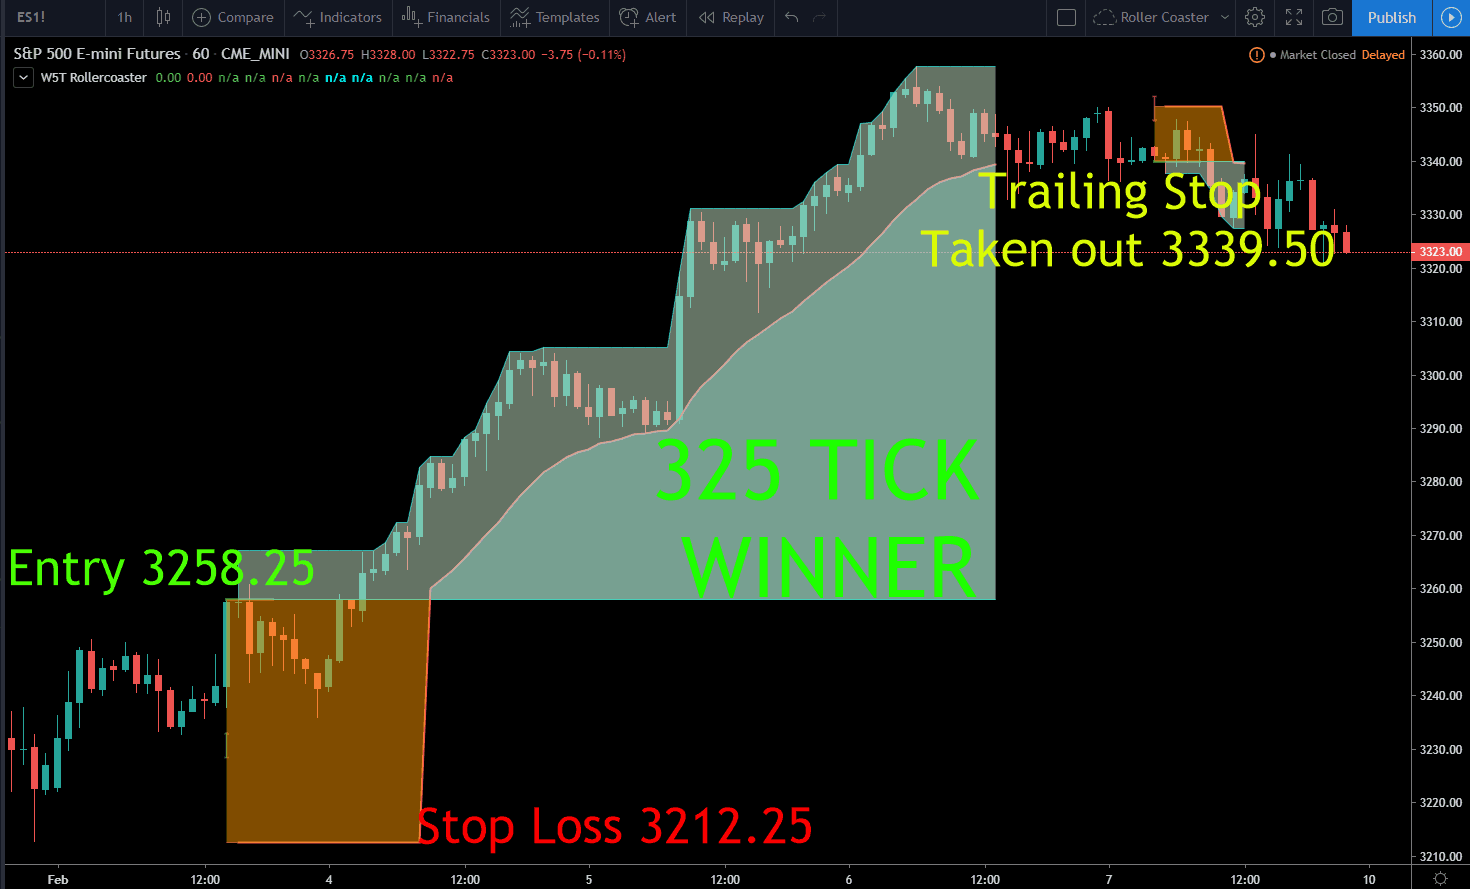
Futures Example with S&P 500 Futures
In this example we use S&P Futures on the 60 minute time frame with a great 325 Ticks Winning Trade using our Roller Coaster Indicator Suite. See Chart Below.
Calculating what we could potentially lose on this trade was the VERY FIRST thing that traders should be doing! With the Entry at 3258.25 and Stop at 3212.25 using the traditional Emini ES futures contract would be risking $2300 per contract. And for some traders this is an acceptable risk. In this situation the 325 Tick winning trade would have won 180% x the Risk, $4050.
However, for a lot of futures traders, this would be too much Risk! Therefore, switching to Micro Emini Contracts would be the solution for this wide gap between entry and stop. With Micro Emini ES, we would only be Risking $230 per 1 contract and the win would be $405. If this is still too big, then we simply don’t take the trade!
Win Ratio
We have found that the larger the time frame the larger the Win Rate. But the larger the Risk. So, it is important to have the discipline to work out the potential loss of any trade before entering the order.
The win rate on smaller time frames is slightly less but the Risk is much smaller also. So, we can say more trading opportunities arise. BUT you must find the “Groove” for an instrument and if that is a larger time frame then you must manage your risk. You can’t change the groove; you must change your risk!


 Trading Guide")

