

Support Resistance Screener
Support Resistance Screener Indicator : Its a technical indicator that identifies support and resistance based price action with supply and demand levels.
Using support and resistance to trade can be a very profitable trading strategy – but only if you do it correctly. Most of the time when we look for support and resistance indicators for Metatrader 4 (MT4),Or Metatrader 5 (MT5), we get an indicator that draws a whole bunch of lines at every swing high and swing low and it turns it into an absolute mess.
We’re left staring at the mess and scratching our heads in finding our how exactly to calculate important support and resistance levels. There simply isn’t a proper way to filter out which lines are stronger, which are weaker and which should be completely ignored.
1. Support and Resistance Simplified
Resistance= any level that is above the price.
SHORT TERM LEVELS and they are perfect levels for Scalping and intraday trading.
MEDIUM TERM LEVELS and they are perfect levels for Intraday trading.
LONG TERM LEVELS and they are perfect levels for swing trading .
If you see price failing to break below this horizontal support line multiple times, it is a strong level to pay attention to it.
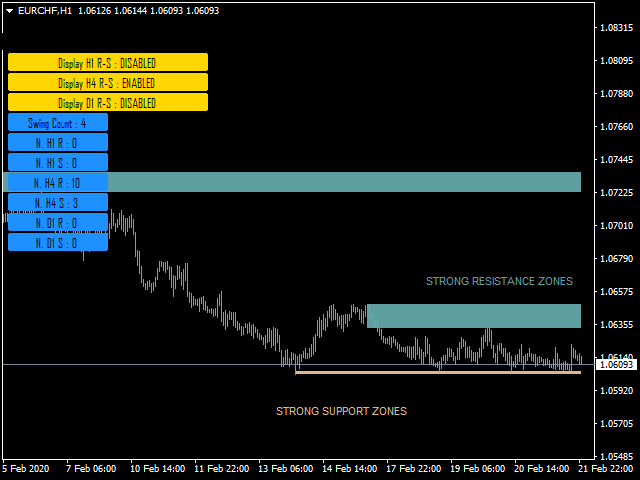
2. Example : How to Trade Strong Support ?

Support and Resistance screener indicator identified a Support as Strong Support Level
- Buy Signal: When the price gets back to test the strong support zones, the probability that the price will go higher is very high because these zones are tested several times by the price and the price in AUDCAD failed to break this zone.
- Sell Signal: When the price break most of the Supports in the Strong Support Zone, the break mean that the probability that the price will go to a lower levels is very high.
The difference between a strong Support and a normal Support that the probability where the price will break the Strong support is very low because the strong zones are tested several. The break of strong Zone or the testing of Strong Zone, it's a great trading opportunity.
3. Example : How to trade Strong Resistance ?
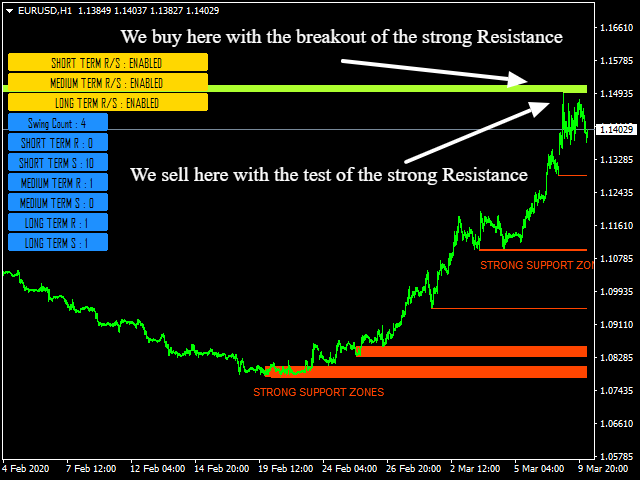
Support and Resistance screener indicator identified a resistance as Strong Resistance Level
- Buy Signal: When the price break a strong resistance zone, the probability that the price will go higher is very high because these zones are tested several times by the price and the price in EURUSD failed to break this zone.
- Sell Signal: When the price failed to break the Strong Resistance Zone with testing it, it will result that the price gets back to move down again.
The difference between a S trong Resistance and a Norrmal Resistance that the probability where the price will break the Strong Resistance is very low because the strong zone is tested several times. The break of strong Zoneor the testing of Strong Zone, it's a great trading opportunity.
IMPORTANT NOTE :
When the price breaks a support or resistance, this level will lose his Status as a support or as resistance with the closing of the bar that broke this level.
The indicator will generate an alert with the break of the level and delete this support or resistance because of its no longer valid support or valid resistance.
Feel free to post your comments below, thank you.
Author
SAYADI ACHREF , fintech software engineer and founder of Finansya.


")
![[XAUUSD]: Weekly Liquidity Activation Points (timings), June 22-26, 2026](https://c.mql5.com/6/1013/splash-preview-771790.png "[XAUUSD]: Weekly Liquidity Activation Points (timings), June 22-26, 2026")
")