
AUDUSD Bounced on Fib - This is Why - - TRADING WITH WEIS WAVE WITH SPEED INDEX
11 December 2019, 17:19

0
147
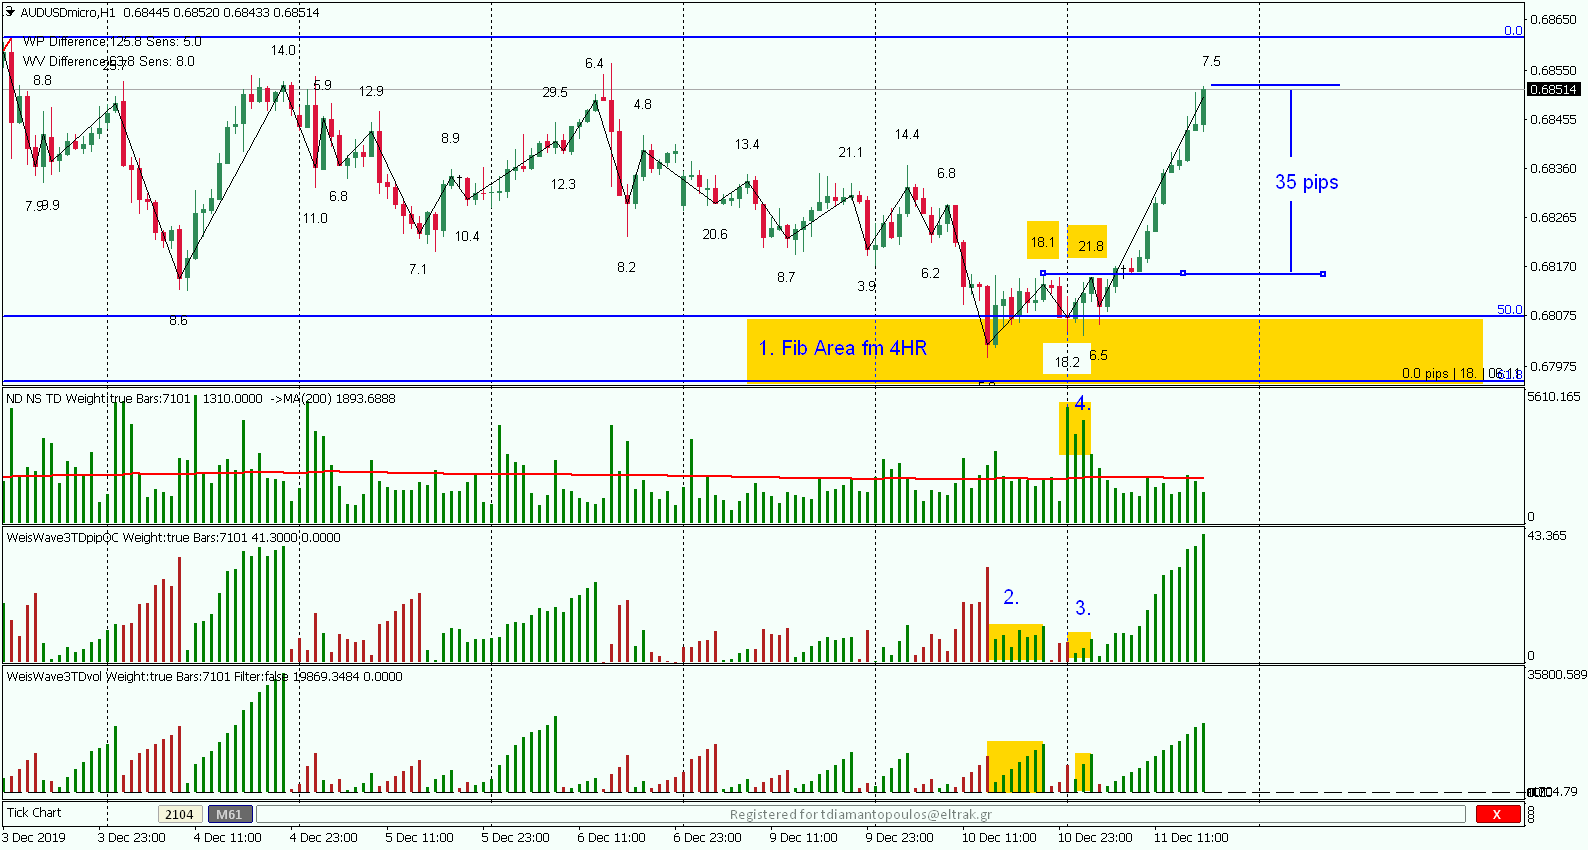
Setup 1Hour Chart
Indicators: Weis Pip Wave, Weis Wave with Alert (+Speed Index) and No Demand No Supply ( https://www.mql5.com/en/users/takisd/seller)
This is Why AUDUSD Bounced on 4HR Fib:
- Fib Area coming from 4HR chart
- First Push up - High volume wave but not the respective Pip move - Speed Index 18.1 and on the down wave Speed Index 18.2 ( Very Very important no SI 18.2 on the down waves on the entire chart - except that 20.6 which is wrong due to the Gap)
- Second Push - High volume wave but not the respective Pip move - Speed Index 21.8 - How do we know that this 21.8 is more buying and not hard time to move up (selling)? Well look at the individual volume bars on point 4.- (where are they? They are at the bottom of the range: therefore buying). If you are conservative you can wait also for the break up to confirm.
- Mentioned before huge volumes at the bottom
Unfortunately I was away from my pc and I missed that trade, but who cares there many opportunities every day.
I hope some of you guys following, got these 35pips.
Enjoy!


 & AMD Framework")
