

PRICE ACTION FIBO CHANNEL is an indicator that calculates price FIBO ranges and places them on the price chart of currency pairs in the form of channels with corresponding FIBO levels.
PRICE ACTION FIBO CHANNEL is non repainting and a convenient tool for determining:
- price reference points when trading using flat scalper strategies (trading on a rebound from the borders within the channel)
- price reference points when trading using trend strategies (trading on the breakdown of the channel borders).

Also, PRICE ACTION FIBO CHANNEL is an effective tool for calculating Take Profit and Stop Loss levels.
Each currency pair has completely different dynamics of volatility. A 400 pips of Take Profit for one currency pair may be too large, but for another pair too small. Thus, for different currency pairs, you need to use different Take Profit and Stop Loss parameters.
PRICE ACTION FIBO CHANNEL indicator will help to determine these parameters, because he calculates the width of FIBO-range, using the volatility values of currency pairs quotations.
In this case, the starting point for calculating TP and SL will be the width of FIBO range, which is equal to average length of a price wave for a particular currency pair.
- Take Profit 1 is recommended to be installed with a size of 1/2 of the width between the extreme opposite lines of the PRICE ACTION FIBO CHANNEL range.
- Take Profit 2 is recommended to be installed with a size of 1/1 of the width between the extreme opposite lines of the PRICE ACTION FIBO CHANNEL range.
RECOMMENDATION 1
This indicator is recommended to be used in combination with the PRICE ACTION IMPULSE TREND indicator. In this case:
- PRICE ACTION IMPULSE TREND - will give you signals about the occurrence of conditions for trading using a pulse-trend strategy.
- PRICE ACTION FIBO CHANNEL - will help to determine correctly the individual Take Profit and Stop Loss levels for each currency pair.
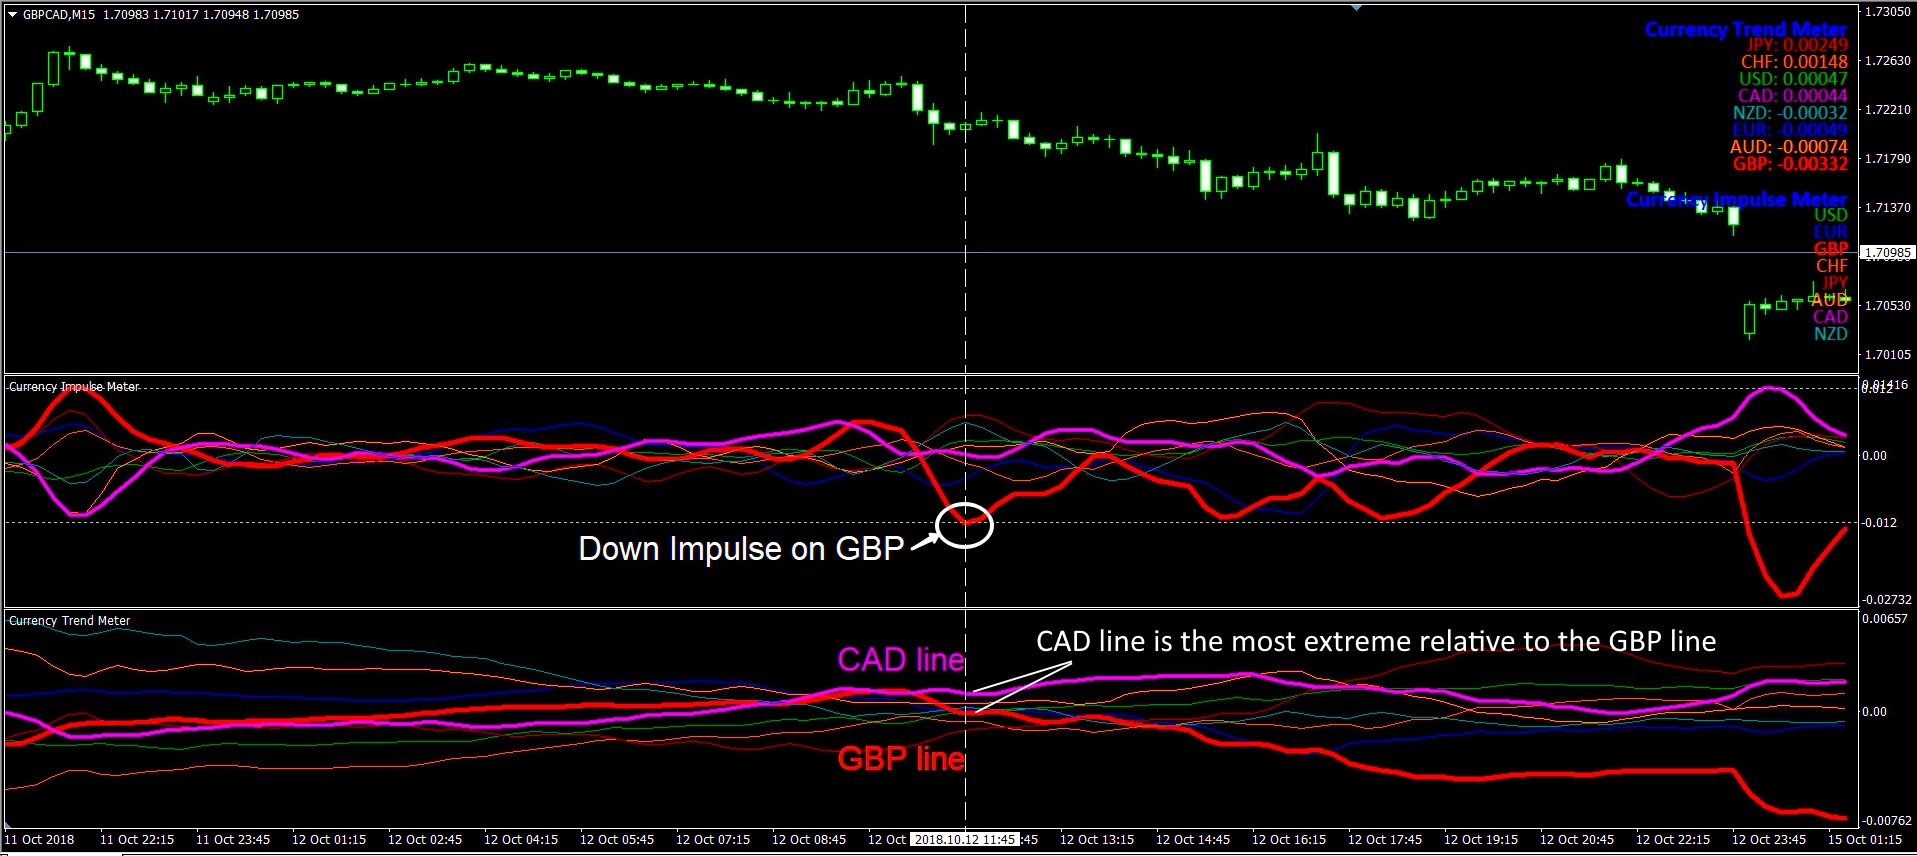
For example: PRICE ACTION IMPULSE TREND gave a signal about the emergence of a “Down” price impulse on the GBP currency.

After this we determine, with help of which currency we will buy CAD (in other words, on which currency pair it is best to trade).
Through the "Currency TrendMeter" block, we determined that the most suitable currency pair for trading is GBPCAD (since, the CAD line is the most extreme relative to the GBP line).
Now we make a deal to buy the GBPCAD currency pair. The question remains - what levels of Stop Loss and Take Profit should be set for this deal?!
To do this, we set the PRICE ACTION FIBO CHANNEL indicator on the GBPCAD chart (on which we made a deal) and measure the width of the channel between the extreme lines of the FIBO channel.
Take Profit 1 is 1/2 (half the channel width).
Take Profit 1 is 1/1 (full channel width).
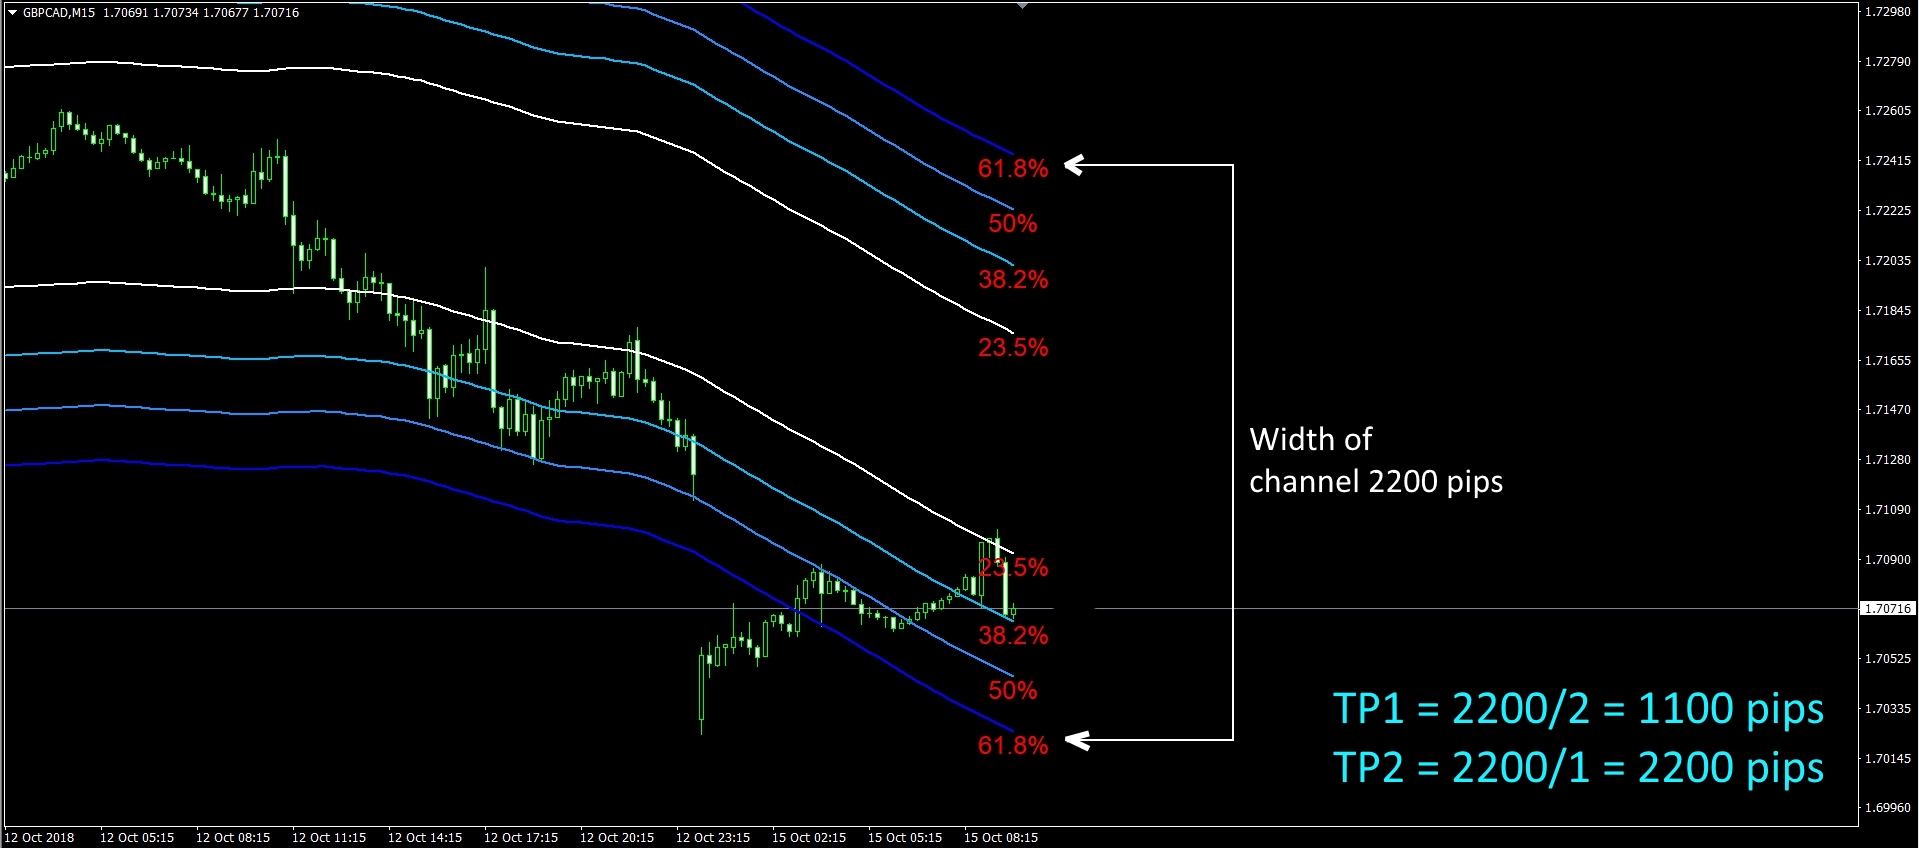
In our case, the channel width is 2200 pips.
So:
Take Profit 1 = 2200 pips / 2 = 1100 pips
Take Profit 2 = 2200 pips
As you can see, in our case, the price has reached the level of TP1 +1100 pips. TP2 will work with the further decrease of the trend.
However, it often happens that the trend continues for a very long time. And with the help of a wider TP, we can take a lot more profit from the market.
Here's the deal on GBPNZD. TP1 was +1600 pips, and TP 2 was +3200 pips.
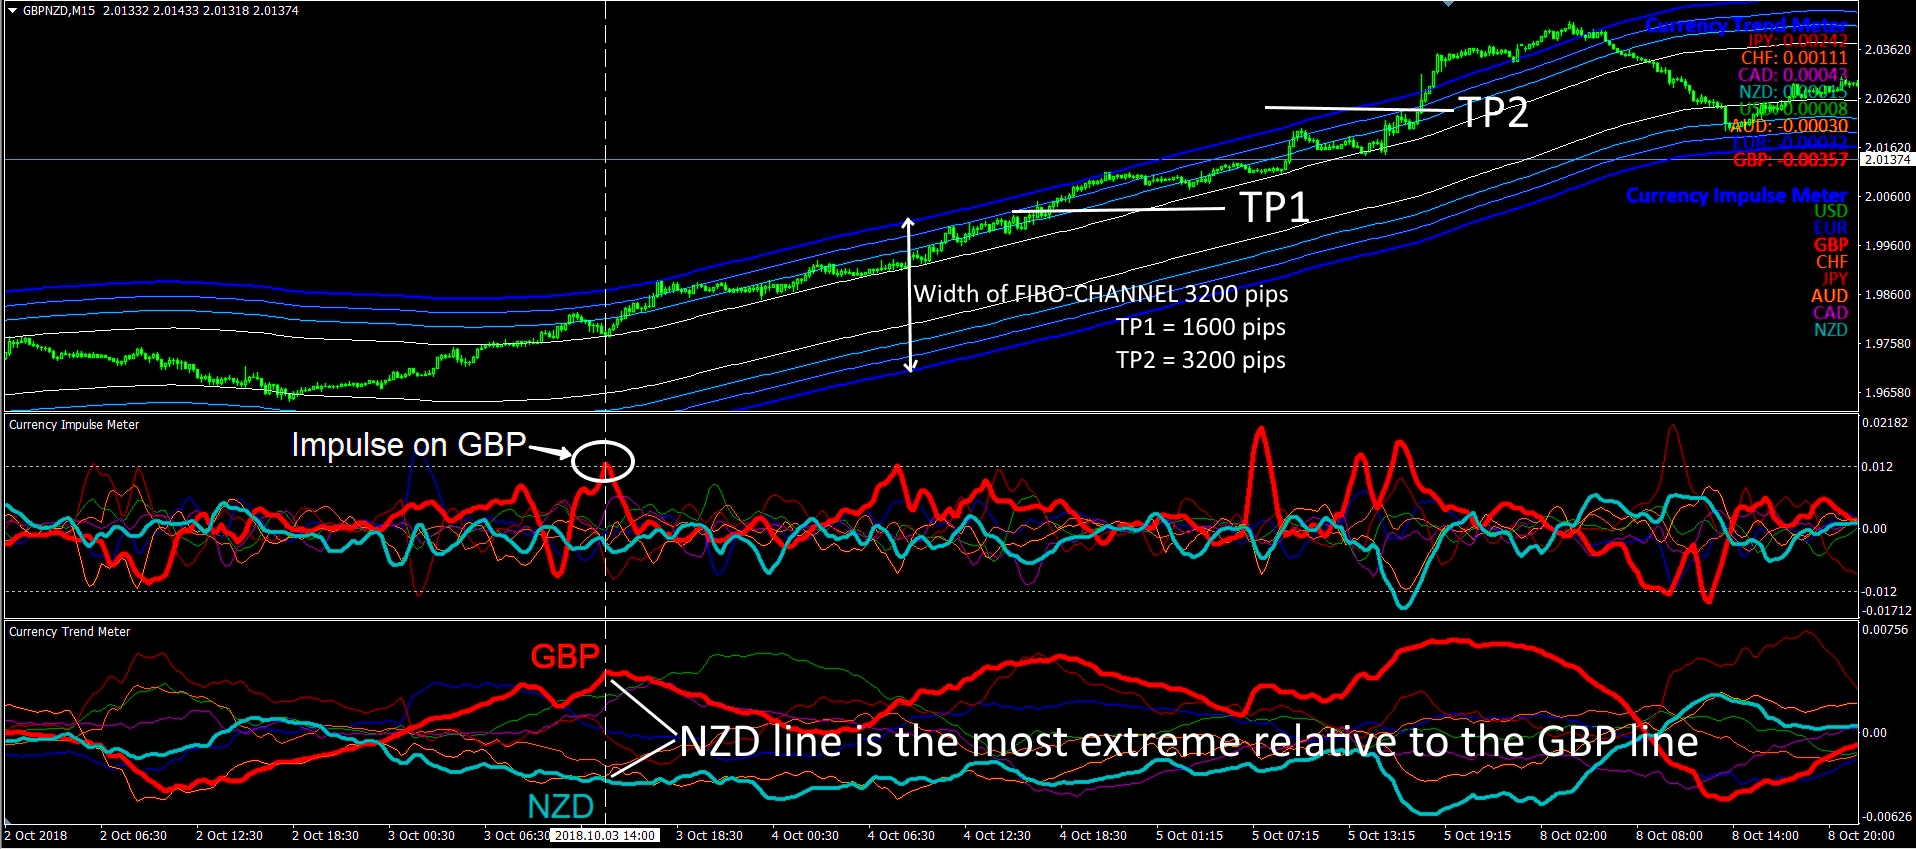
Cool, right?! Note that these levels were determined by the PRICE ACTION FIBO CHANNEL indicator!!!
RECOMMENDATION 2
To improve the results in the tactics of scalping within the PRICE ACTION FIBO CHANNEL price channel, we recommend using it with the COMPASS indicator.
In this case:
- PRICE ACTION FIBO CHANNEL will help to determine when a price reaches the maximum overbought / oversold level (price reaches the upper / lower line of the channel)
- COMPASS will help you to specify the moment for a deal (including by submitting an audio-visual alert). His signals do not repaint!!
Here is an example of trading:
We waited for currency pair quotes reached the upper boundary of the PRICE ACTION FIBO CHANNEL corridor. This is a signal for making a deal for a sale of an asset. However, there is a possibility that the price will continue to move for some time in the direction of breaking through the border of the channel. That is, against our trading position.
How to determine the moment of rebound for sure?! We recommend using the COMPASS indicator, which will allow you to determine much more accurately the moment of reversal of a price after touching the PRICE ACTION FIBO CHANNEL borders.
When to fix profits?
We recommend to close a trading position after the price touches the nearest to deal Fibo-level 23.5%. To this level, the price returns in more than 90% of cases after a rebound from the extreme border of the channel!
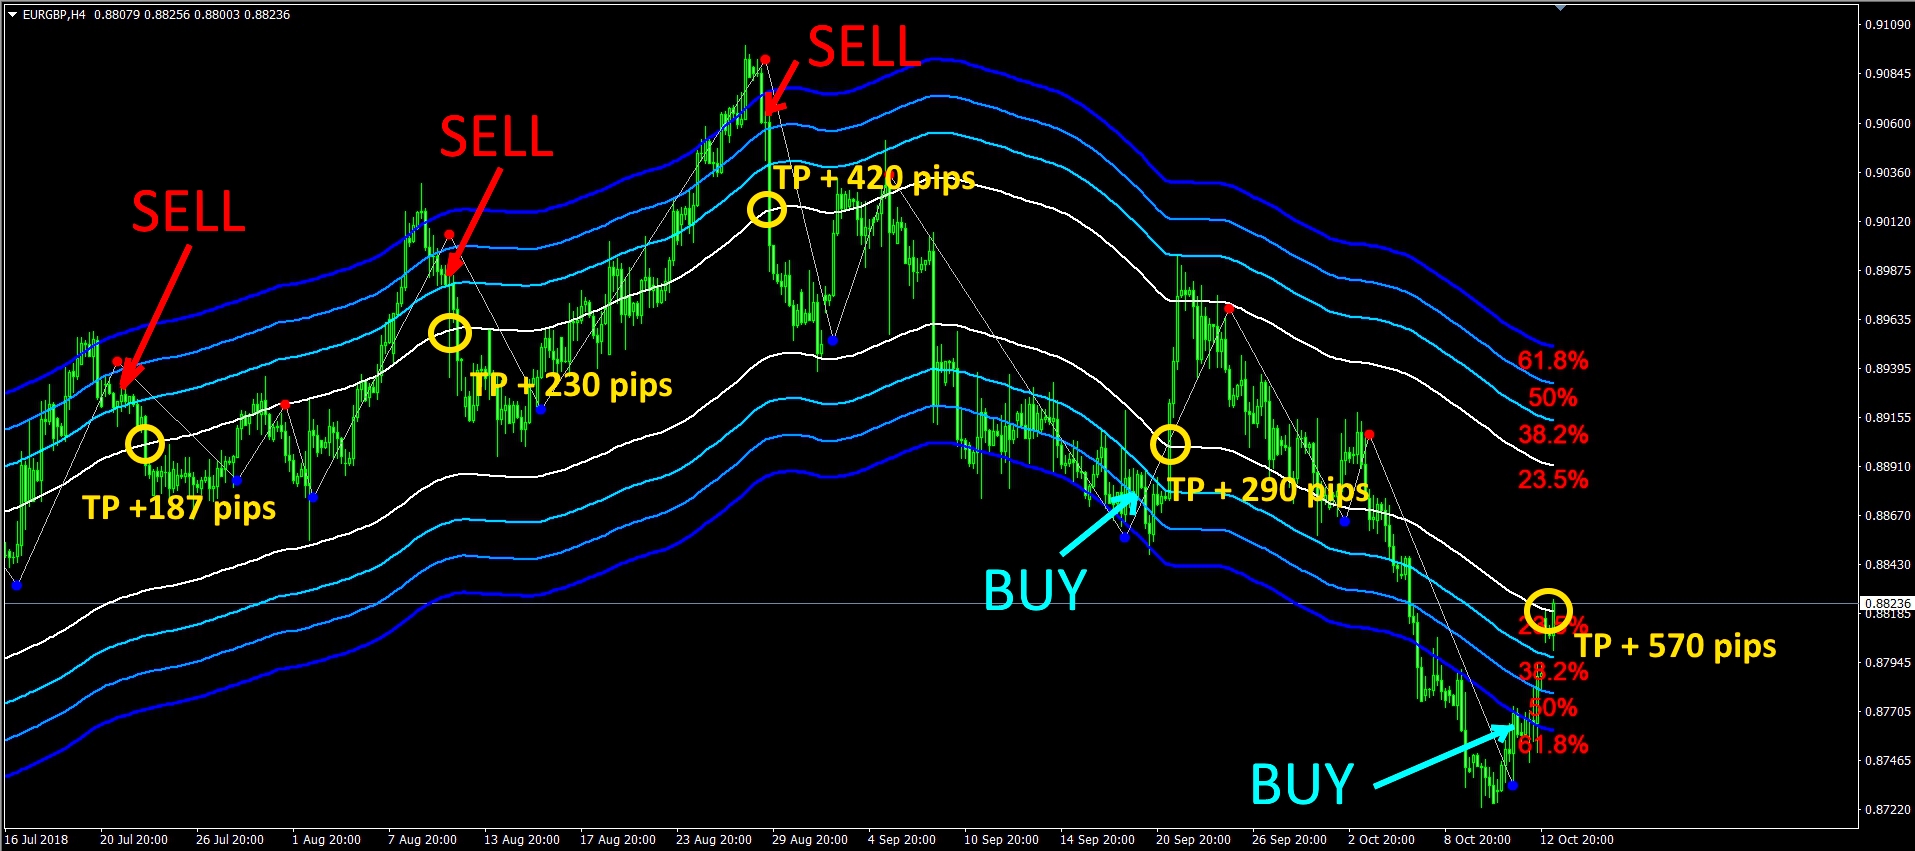
This is a real deal on a real account!


![[XAUUSD]: Weekly Liquidity Activation Points (LAP), July 6 - July 10, 2026](https://c.mql5.com/6/1015/splash-preview-772241.png "[XAUUSD]: Weekly Liquidity Activation Points (LAP), July 6 - July 10, 2026")