Prices for gold increased by $ 3 to $ 1277.00 per troy ounce on Thursday. The sale of the dollar and its weakening contributed to higher prices for commodities and precious metals.
On Friday, during the Asian and early European sessions, the dollar's decline continued, however, closer to the beginning of the US trading session, the dollar moved to a positive territory.
The dollar index DXY, which tracks the rate of the US currency against the basket of 6 other major currencies, after rising sharply on Thursday to the June 2018 mark, is growing on Friday at the beginning of the US trading session near the 93.61 mark.
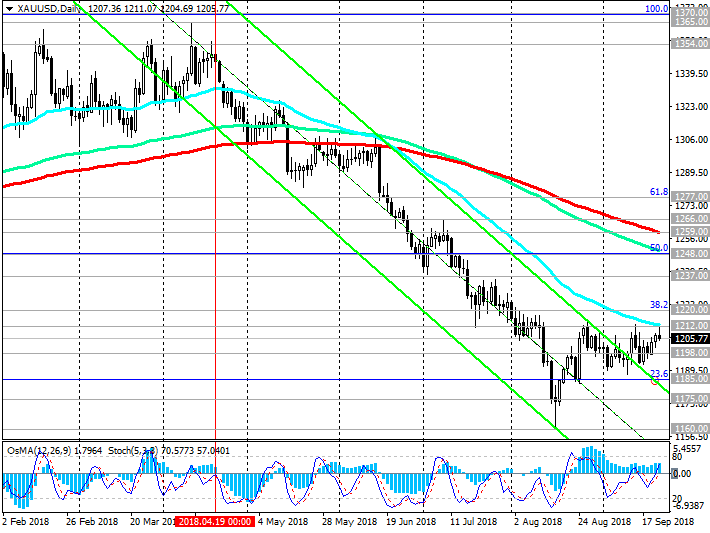
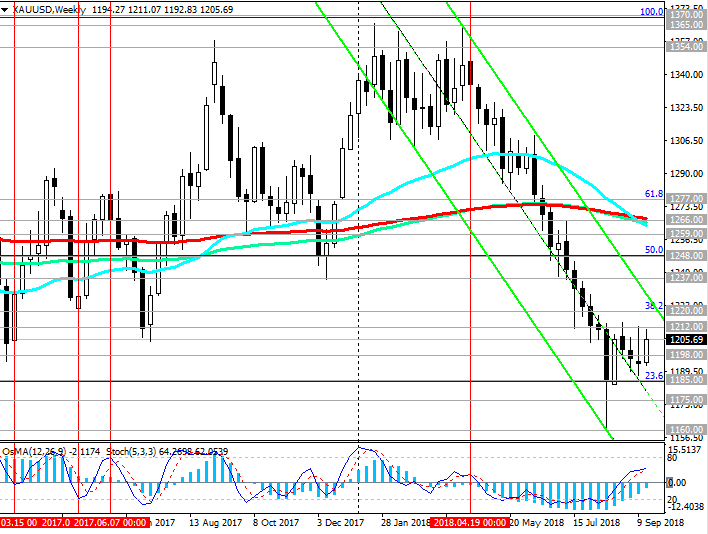
The pair XAU / USD also declines after rising yesterday. At the same time, XAU / USD continues to trade in the range between resistance levels 1212.00 (EMA50 on the daily chart) and 1185.00 (Fibonacci level 23.6% of the correction to the wave of decline since July 2016), pending the meeting of the Federal Reserve System, which will take place at the next week (September 25 - 26) to assess the prospects for the monetary policy of the Fed. With an increase in the Fed's interest rate, the price of gold usually falls.
The overall trend of XAU / USD, still remains bearish. Another test of the resistance level 1212.00 (EMA50 on the daily chart) is possible. However, further growth is unlikely, unless, of course, the dollar will not resume a decline.
Investors take into account the 100% probability of an increase in the Fed's interest rate in September. In conditions of an increase in the interest rate, the investment attractiveness of the dollar is growing, and gold is falling.
*)An advanced fundamental analysis is available on the Tifia Forex Broker website at tifia.com/analytics
Support and resistance levels
Since mid-April, XAU / USD is trading in a downward channel on the daily chart, the lower limit of which is near the support level of 1128.00 (the low of 2016).
Below the key resistance level of 1259.00 (EMA200 on the daily chart), the downside dynamics prevails.
The breakdown of the support level of 1185.00 (the Fibonacci level 23.6% of the correction to the wave of decline since July 2016) will confirm the return of XAU / USD to the global downtrend that began in October 2012.
The signal for medium-term purchases and the development of an alternative scenario will be a breakdown of the resistance level at 1212.00. In this case, the corrective growth can last up to resistance level 1220.00 (Fibonacci level 38.2%). Short positions are preferred below this level.
Support levels: 1200.00, 1198.00, 1185.00, 1175.00, 1160.00, 1128.00
Levels of resistance: 1212.00, 1220.00, 1237.00, 1248.00, 1259.00, 1266.00, 1277.00

Trading Scenarios
Sell Stop 1206.00. Stop-Loss 1213.00. Take-Profit 1200.00, 1198.00, 1185.00, 1175.00, 1160.00, 1128.00
Buy Stop 1213.00. Stop-loss 1206.00. Take-Profit 1220.00, 1225.00, 1237.00, 1248.00, 1259.00, 1266.00
*) For up-to-date and detailed analytics and news on the forex market visit Tifia Forex Broker website tifia.com


