

The USD / CAD keeps the medium-term negative dynamics, trading in the downward channel on the daily chart. At the same time, USD / CAD remains in the upward channel on the weekly chart, the upper limit of which passes near the resistance level 1.3600 (the highs of November, December 2016).
While USD / CAD is trading above the important support level of 1.2930 (200-period moving average on the daily chart), long-term positive dynamics remain.
In the vicinity of this support level 1.2930, the bottom line of the upward channel and EMA50 on the weekly chart also pass.
Thus, the support level of 1.2930 is the key.
In case of its breakdown, USD / CAD will go to support levels 1.2800 (EMA144 on the weekly chart), 1.2740 (Fibonacci level 38.2% of the downward correction to the pair's growth in the global uptrend from September 2012 and the 0.9700 mark).
The breakdown of the support level 1.2625 (EMA200 on the weekly chart) raises the risks of the final breakdown of the bullish USD / CAD trend.
The growth scenario is related to the breakdown of the resistance level 1.3050 (EMA200 on the 4-hour chart) and the resumption of positive dynamics within the rising channel on the weekly chart. The first signal for purchases will be the breakdown of the nearest short-term resistance level of 1.2995 (EMA200 on the 1-hour chart).
)An advanced fundamental analysis is available on the Tifia Forex Broker website at tifia.com/analytics
Support levels: 1.2930, 1.2900, 1.2800,
1.2740, 1.2625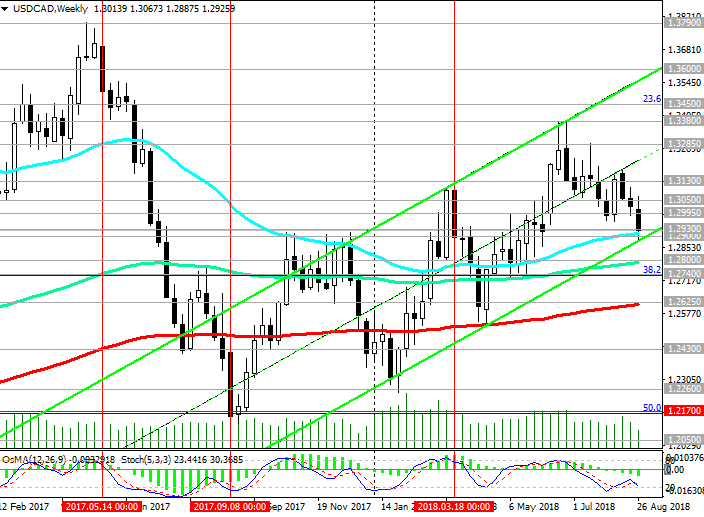
Resistance levels: 1.2995, 1.3050, 1.3130, 1.3200, 1.3285, 1.3380, 1.3450
Trading Scenarios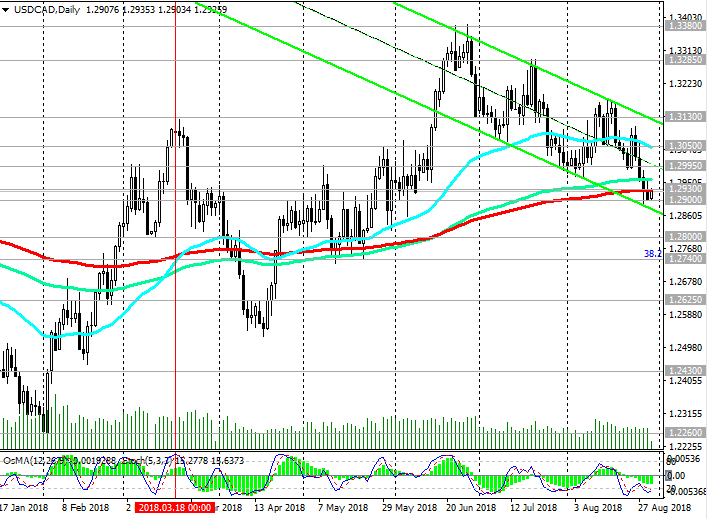
Sell Stop 1.2890. Stop-Loss 1.2945. Take-Profit 1.2800, 1.2740, 1.2625
Buy Stop 1.2945. Stop-Loss 1.2890. Take-Profit 1.2995, 1.3050, 1.3130, 1.3200, 1.3285, 1.3380, 1.3450
*)
For up-to-date and detailed analytics and news on the forex market visit Tifia Forex
Broker website tifia.com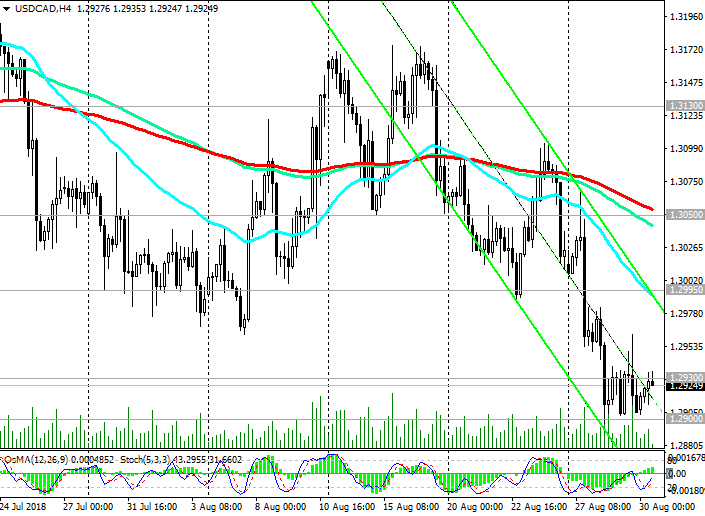


")
