In this short story we will focus on the standard oscillator "Stochastic" all novice traders are aware of its existence and tried to use it in your trade. But for one reason or another, they refused to use it. I hope that after reading this article, many will take a fresh look at his other view and appreciate its capabilities.
Everyone probably knows that "stochastic", like all oscillators, is not a trend indicator. During an extended trend, the values of this indicator hang for a long time in one of its extreme zones. The so-called overbought and oversold zones. And at this time, as a rule, the indicator generates a lot of false signals. It is believed that this indicator can be used only during the flat, when the price moves in a limited range and there is no trend movement.
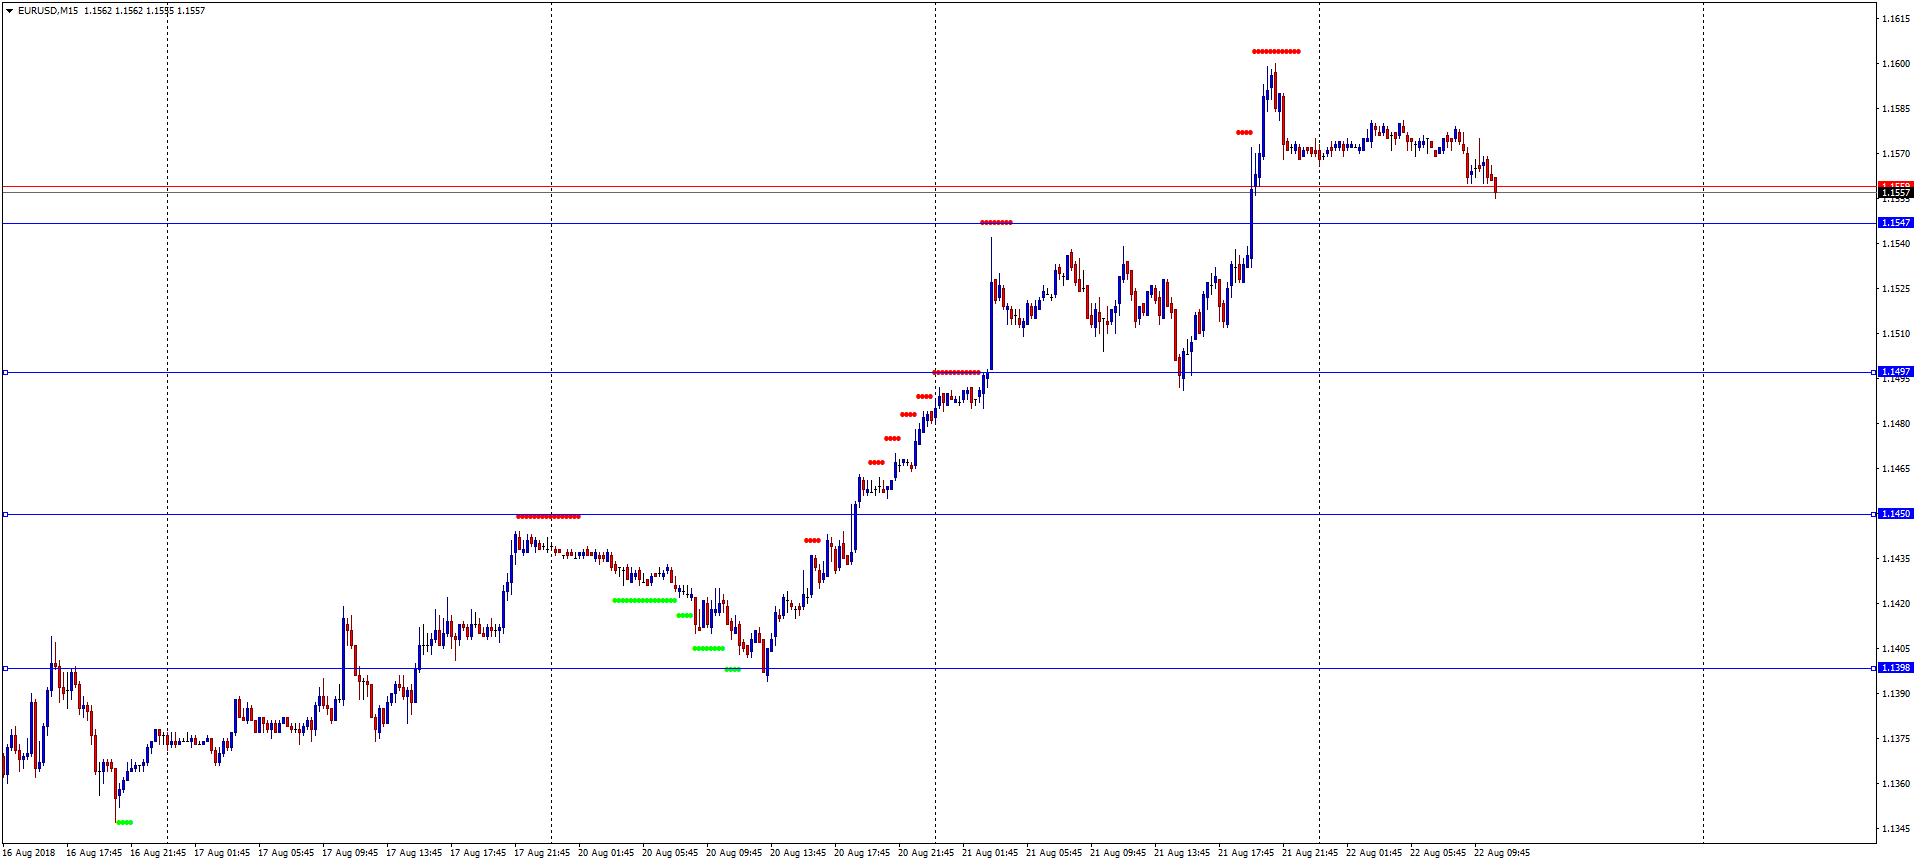
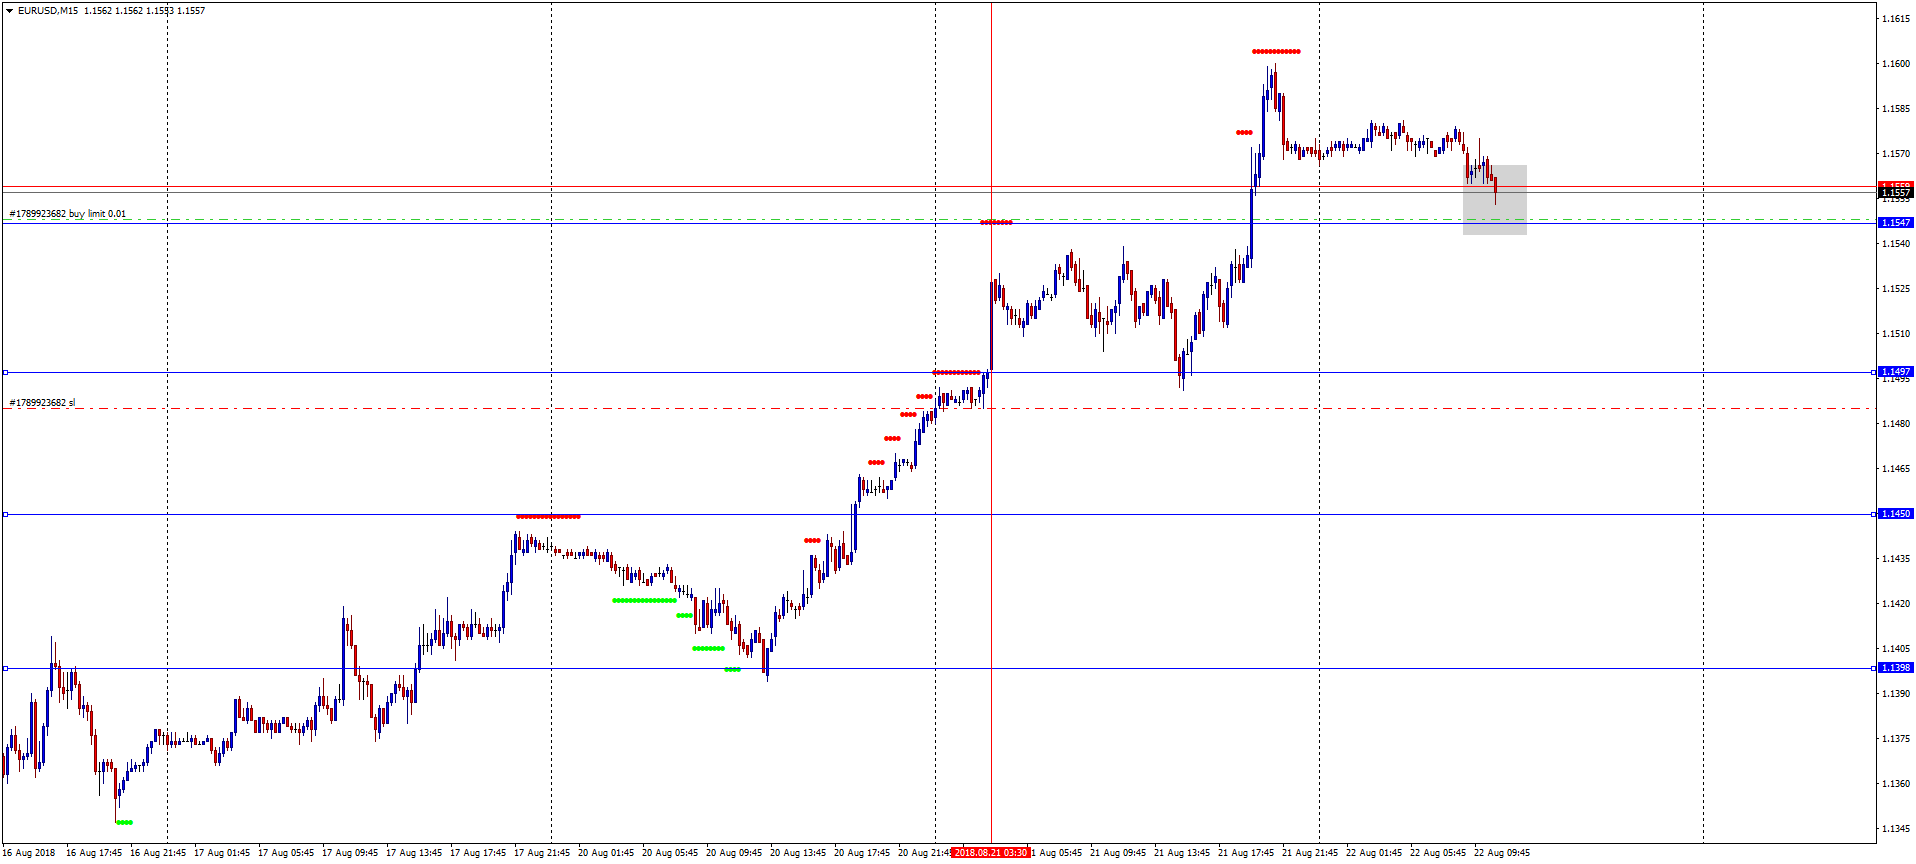
However, after a small alteration and modernization. And also if you make this indicator multi-timeframe-able to display on the current time interval data from another time interval of the highest order. For example, on M15 to show data from H1. At the same time, you can also refuse to display the indicator values in an additional window (in the chart footer), and instead show the indicator data in the main chart window. The result of all these changes can be seen in the picture, which shows the M15 EURUSD chart the indicator shows the values from the time interval H1.
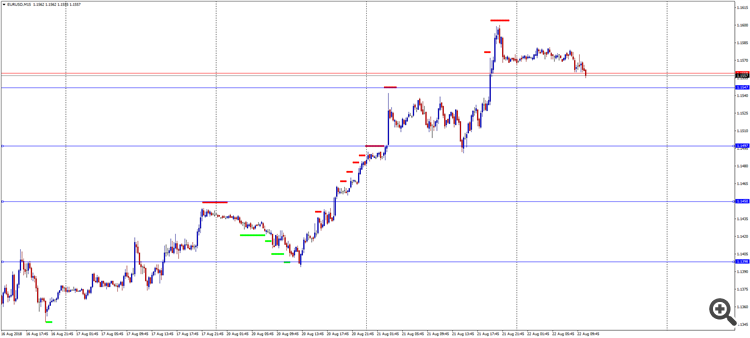
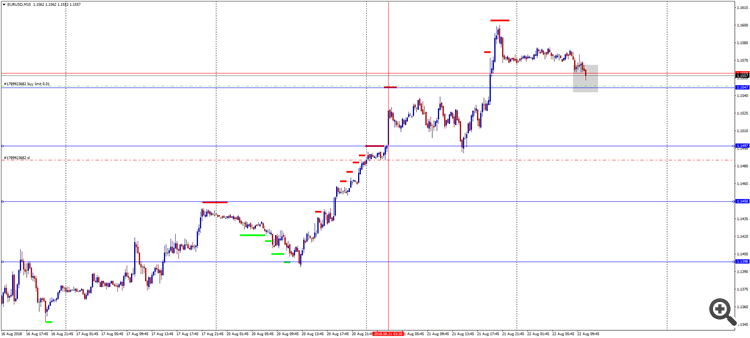
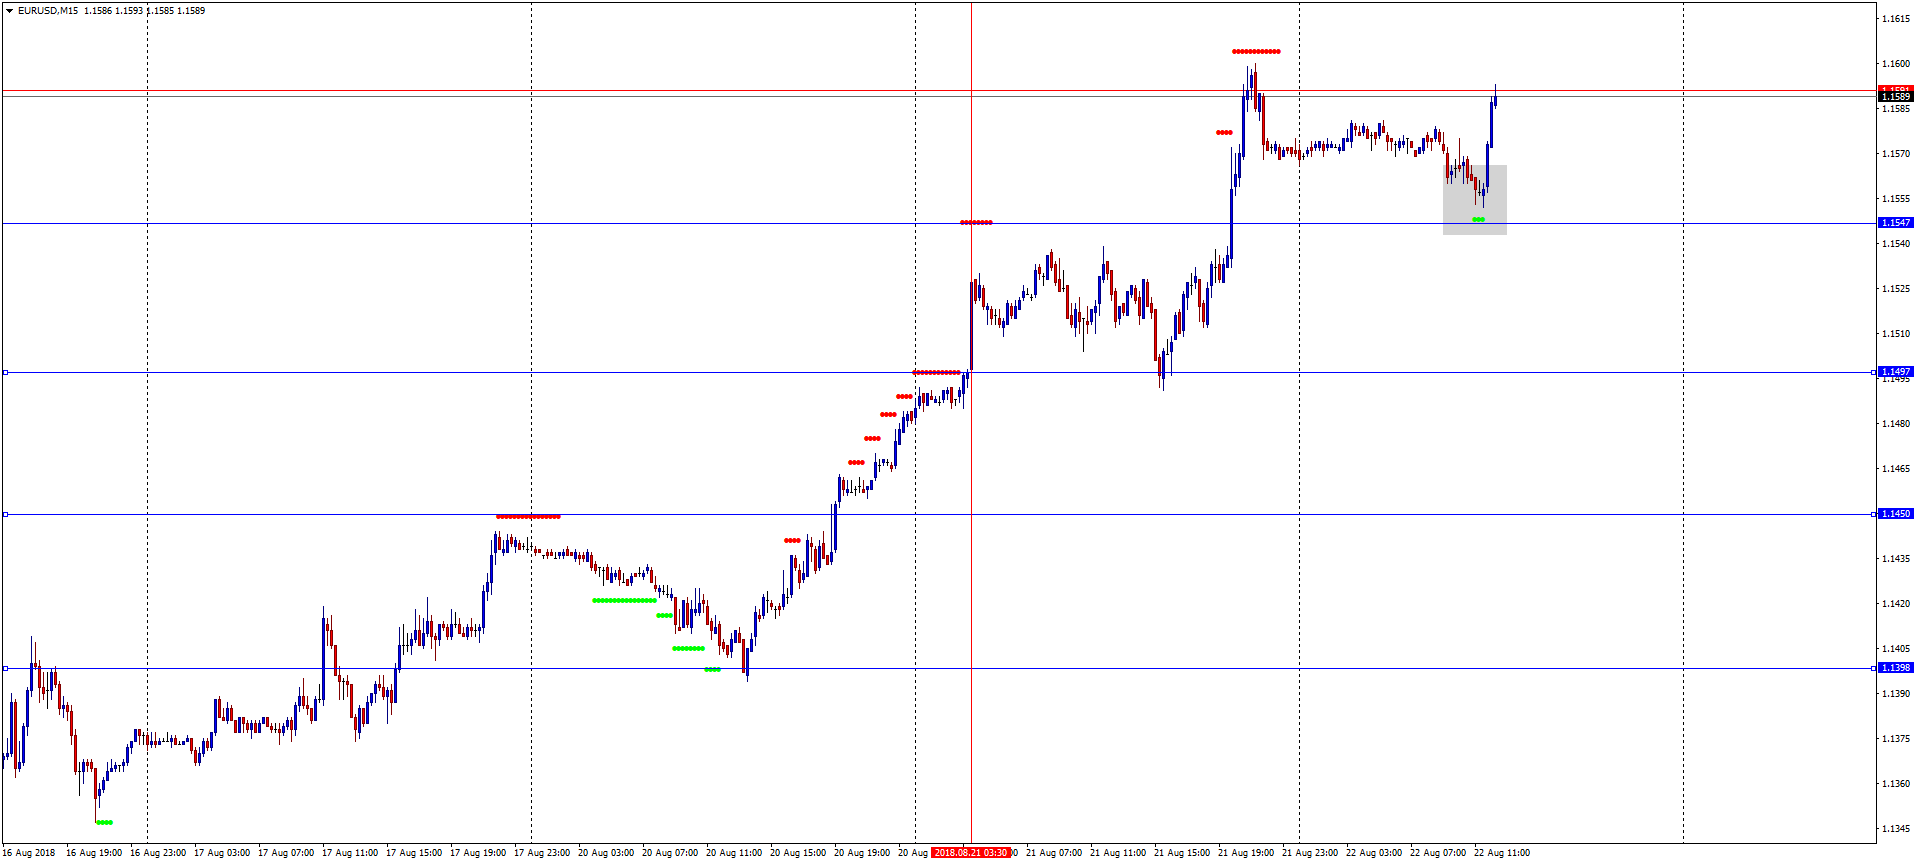
How to use it in your trading system? The figure shows the current trend direction upwards. For trading in the trend, you can use pending orders of type BUY_STOP in the calculation for the breakdown by the trend of the extreme values of the indicator (they are marked with red dots). Or orders of type BUY_LIMIT in the calculation of a return to previously punched extreme values. In the figure, these key values are marked with blue lines. In the second figure, the current situation is shown that the extreme value of the indicator was punched with an impulse candle on August 21, 2018 at 03:30. We set the pending order BUY_LIMIT and wait for the price to return to this value in the hope that the price will bounce off of it and continue to move along the trend.
Download and test and test this indicator in your trading system by following the link VAStochasticMTF
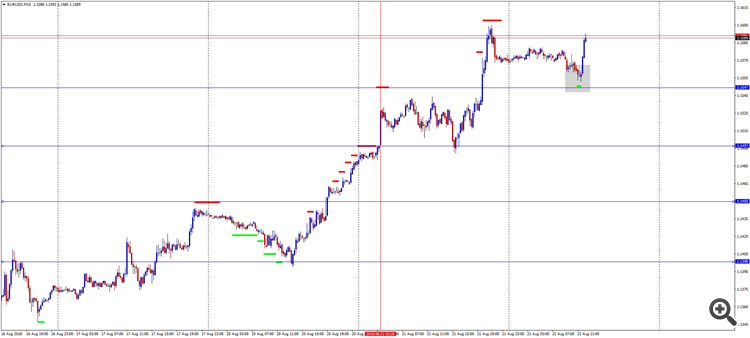
Posted on 22.08.2018 at 12:20 MSK:
The price of several items did not reach the limit buy order, it turned and continued to move on the trend. The indicator at the same time showed that extreme values (oversold) had been reached. I had to cancel the warrant.


")
![[XAUUSD]: Weekly Liquidity Activation Points (timings), June 22-26, 2026](https://c.mql5.com/6/1013/splash-preview-771790.png "[XAUUSD]: Weekly Liquidity Activation Points (timings), June 22-26, 2026")
")