.")

Introduction.
Most of the indicators currently used by traders in the Forex market were created for another market - the stock market and for another time, when there were quite monotonous trends and quotes were not so volatile as at present, when there are no trends as steady trends of unidirectional price movement. Therefore, the entire existing arsenal of indicators is not very suitable for trading in the Forex market and does not reflect the key moments of the state of this market. To assess the condition of the Forex market and its instruments, it is necessary first of all to analyze statistical histories of their quotations, which allows identifying patterns that are important for trade, which are latent for the standard indicators (supplied with the MT4 trading platform).
One such tool that provides in-depth statistical analysis of tools is the SPP indicator that, based on analysis of a large array of data from junior time frames, predicts in the real-time mode the future most probable price values for larger time frames and calculates for these values the boundaries of confidential intervals.
1. Purpose of the
indicator SPP.
Using the methods of mathematical prediction of random processes, predicts the most probable values of the future price and calculates a confidence interval for them.
The SPP indicator is suitable for both long-term trading and for scalpers (look at screenshots). Monitoring the SPP indicator in the manual trading mode on small timeframes and their immediate subsequent confirmation is simply amazing. This indicator is what traders dreamed about for the whole time of the existence of the currency exchange.
2. Concepts of work and
methods of application of the indicator SPP.
The statistical characteristics
necessary for the realization of the forecast are based on the data set of the
smallest timeframes - M1 for M5-H4, M5 for D1, M30 for W and MN. If, for
example, the forecast for the timeframe H4 is calculated, then the array is
treated 240 times larger than if the forecast was made according to the historical
data of the H4 timeframe itself, which in the algorithm used raises the
forecast accuracy in sqrt (240) ~ 15 time. Therefore,
before the indicator SPP is
installed on the chart of a tool, you first need to load the history (Tools
/ History Center) quotes for this tool. The indicator works on all timeframes,
except for M1. With the increase in the timeframe of the graph, the reliability
of the SPP readings increases. The
mathematical algorithm for calculating the forecast is the KNOW-HOW of the
author.
In addition to the position of the most probable prediction points (marked with hexagonal asterisks), SPP calculates the boundaries of the confidence interval for forecasts. In this case, the use of 2 standard deviations (the "Number of standard deviations" option) with the correct application of the indicator sets the limits of the channel to which the future price will fall with a probability of 95%.
The SPP indicator predicts the future emerging from the already established own "statistical fluctuations" in the price. The forecast algorithm can not take into account the strong effects on the price caused by major events that have not yet occurred, such as important news, etc. Therefore, it is incorrect to use SPP for the forecast before the release of important news and immediately after their release (it is desirable to wait for the decrease in volatility).
However, by setting 3 standard deviations (Number of standard deviations = 3) in the settings of the SPP indicator (with the value of the option Length of forecast in bars = 5) on the endings of the confidence interval it calculates, you can very correctly to placing the deferred orders (Buy_Stop and Sell_Stop) before news outlets, which ensures correct trading on news.
The indicator has three forecast algorithms applicable to the states of the instrument to forecast in the modes: (1) trend, (2) high volatility and (3) flat. The forecast modes are selected from a drop-down list in Choose market mode.
3. SPP indicator settings.
- Length of forecast in bars (1-60 for M5-M30, 1-20 for H1-MN) - number of bars a forecast is performed for.
- Number of standard deviations (0-10) - number of standard deviations from the most probable value in a forecast channel.
- Choose market mode - select the current state of the instrument to forecast. Values: «Trend», «High volatility» and «Flat».
- Global indicator shift (to estimate the forecast) (1-300) - indicator shift for assessing the quality of its work.
- Dimensions of markers (asterisks) (1-5) - sizes of the markers to display the forecast points.
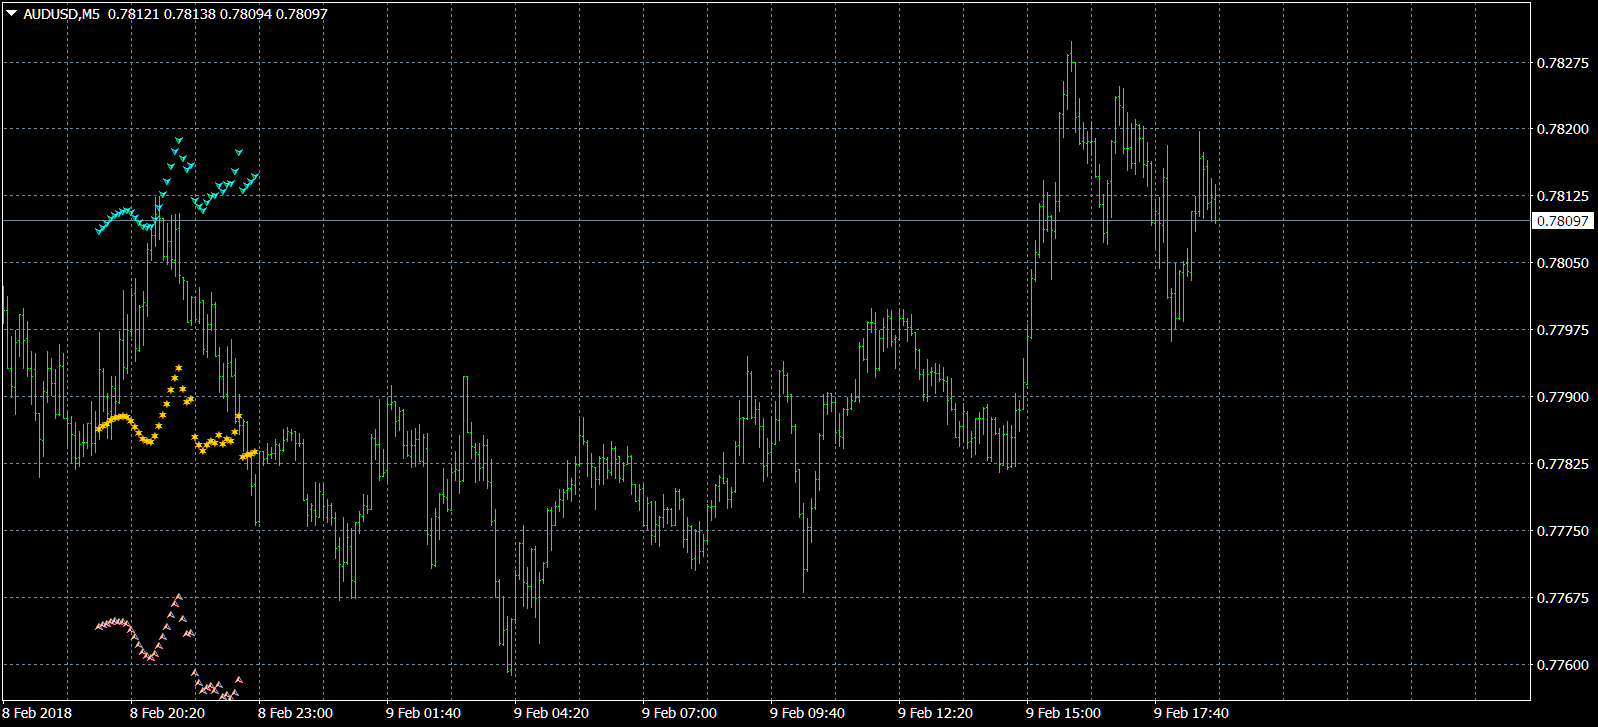
4. Screenshots.
AUDUSD charts 5 min. The forecast is based on past data from historical
moments "present minus shift", which allows to evaluate the quality
of forecasts. Indicator mode «Flat».
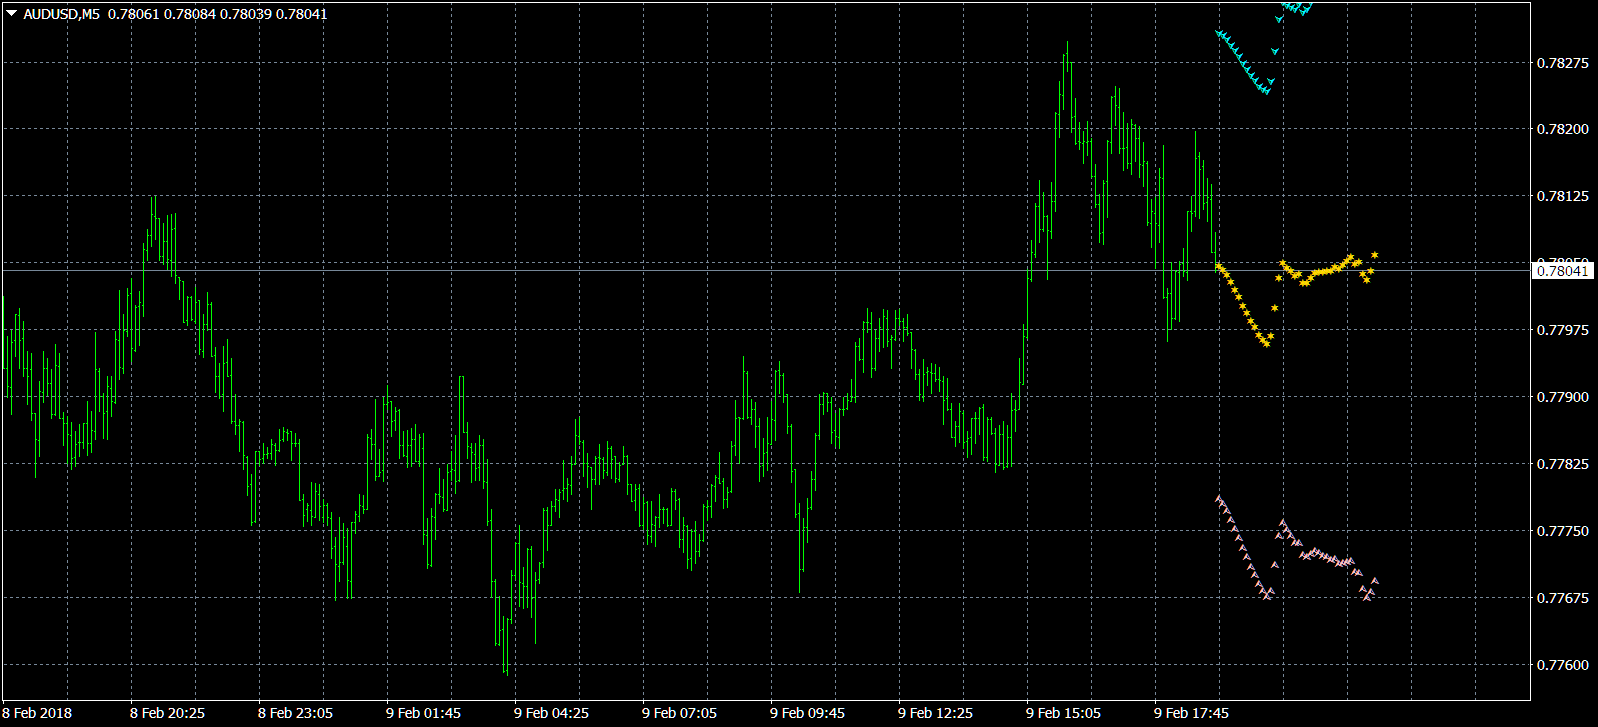
Forecast 40 bars, shift 0 bars.

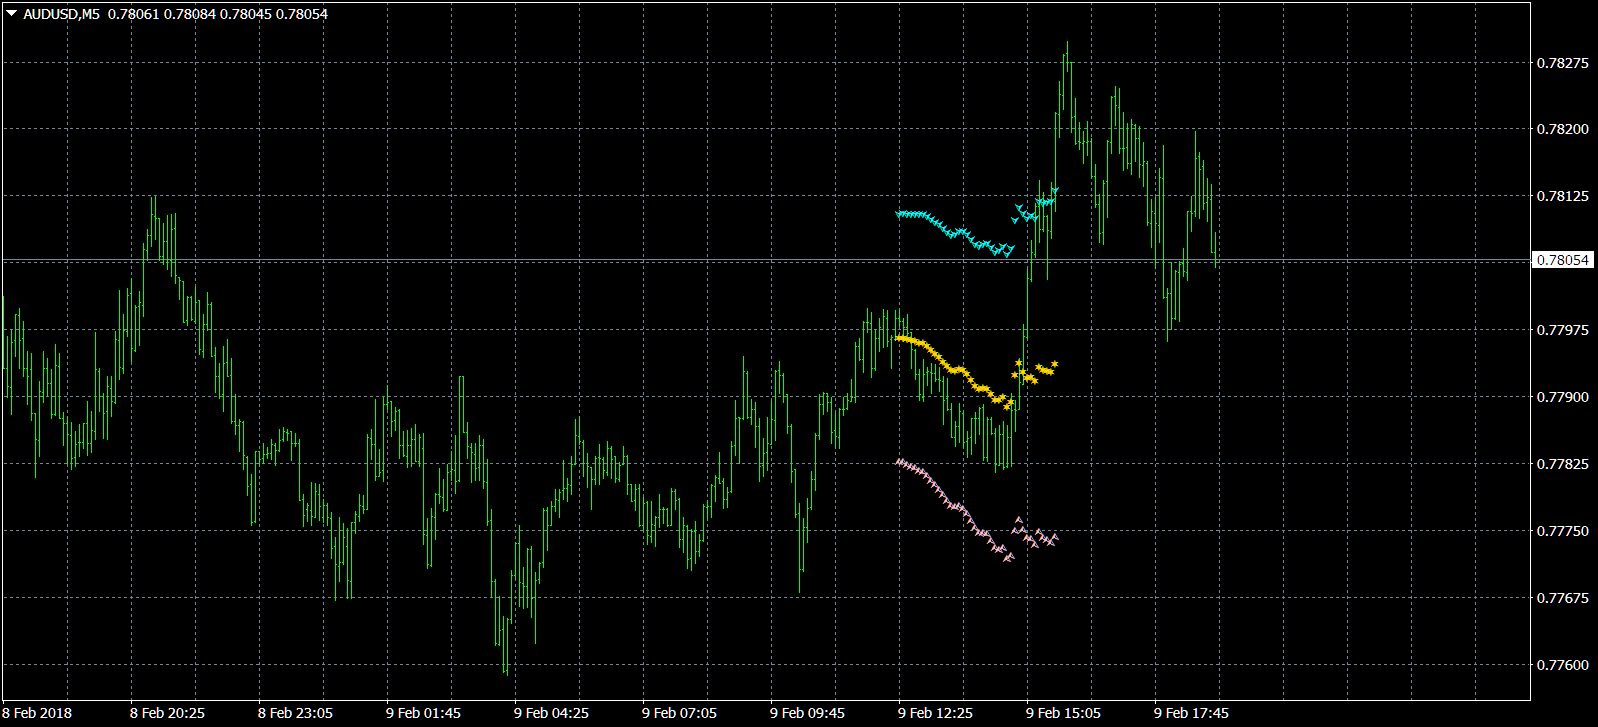
Forecast 40 bars, shift 40 bars.
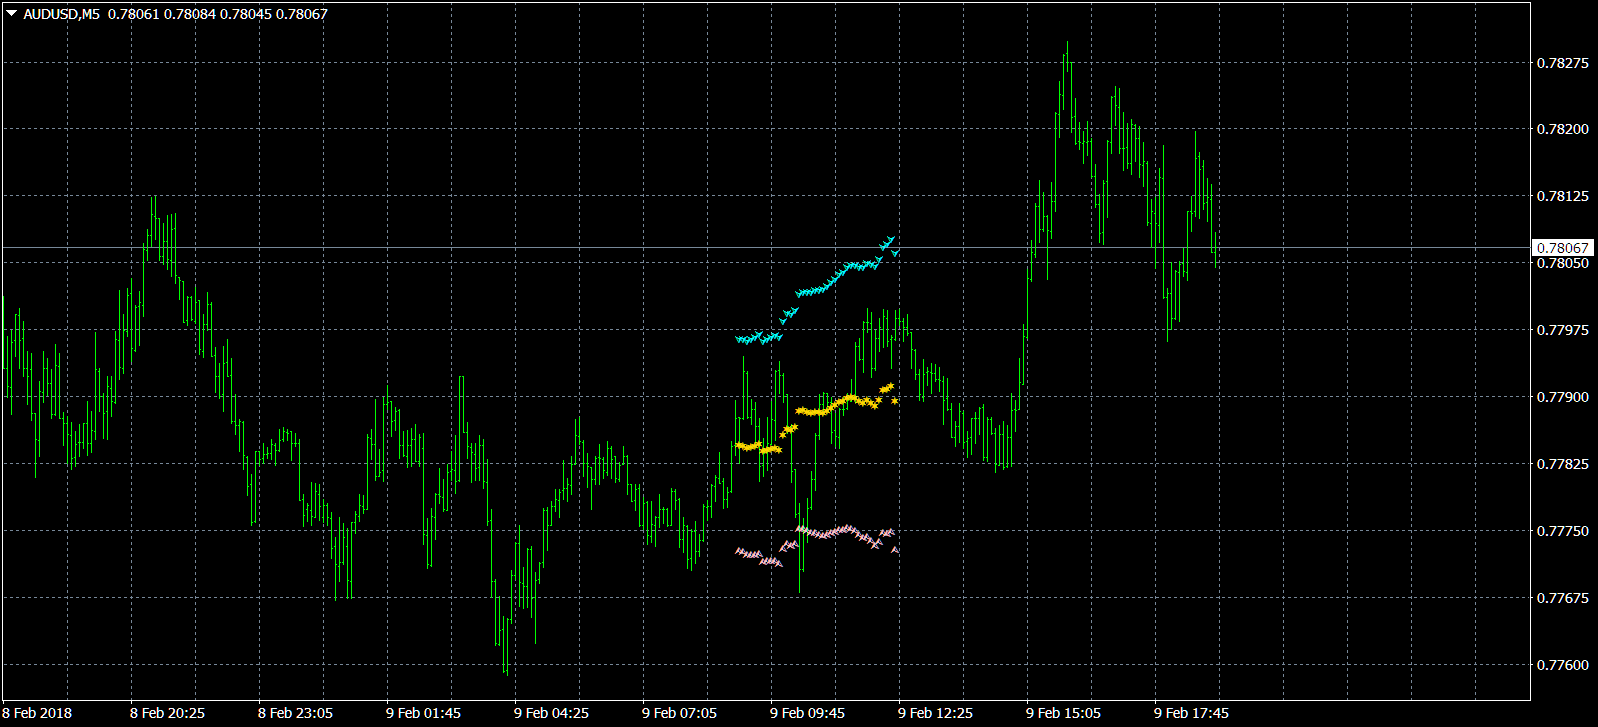
Forecast 40 bars, shift
80 bars.
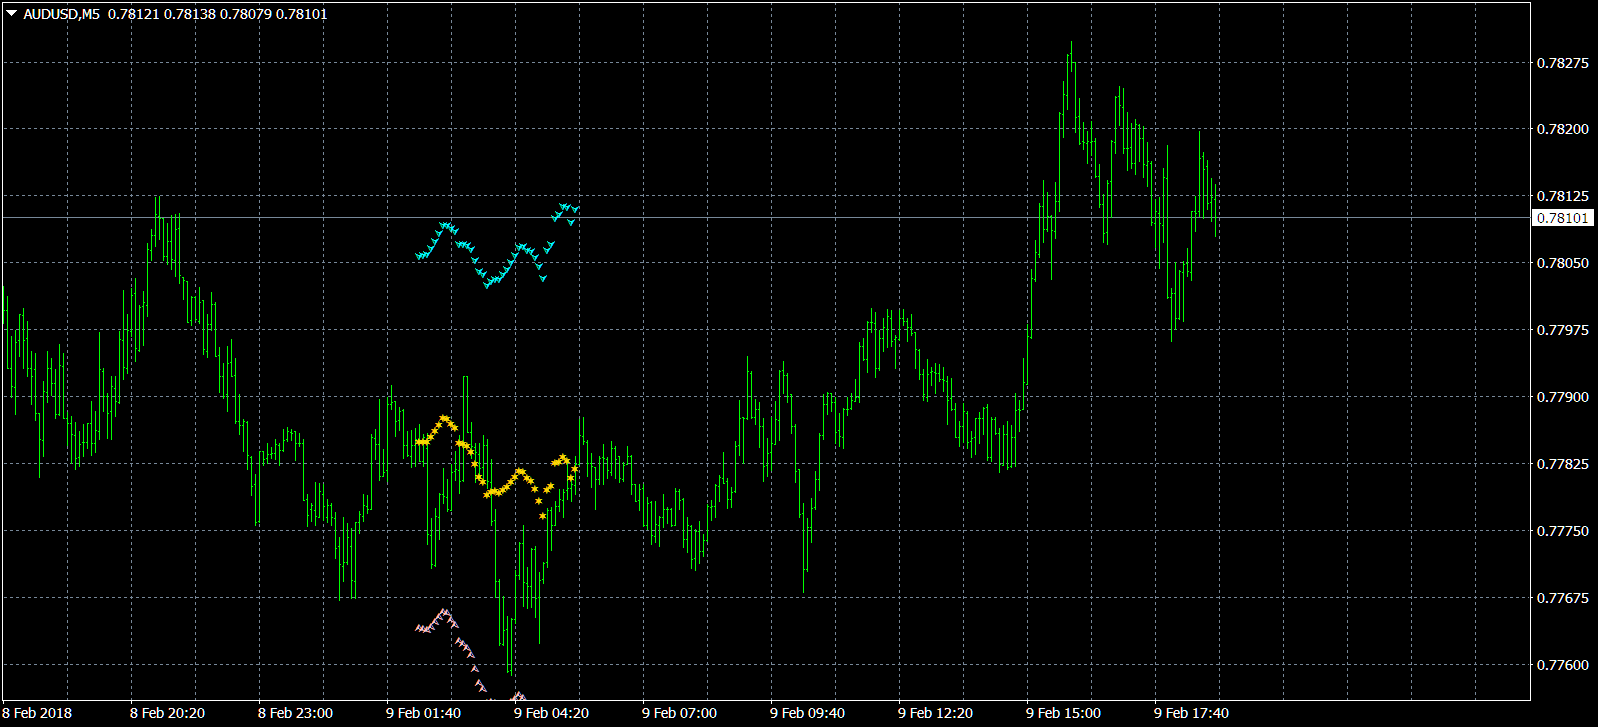
Forecast 40 bars, shift 120 bars.

Forecast 40 bars, shift 160 bars
Forecast 40 bars, shift 200 bars

Forecast 40 bars, shift 240 bars
Forecast 40 bars, shift 280 bars.
Download or buy the indicator you can by reference https://www.mql5.com/ru/market/product/28003 .


