

The dollar continues to decline actively in the foreign exchange market. Nevertheless, on oil prices denominated in dollars, so far this fact is reflected little. Much more impact on oil prices had a storm in the US in the Houston area, a hurricane, later a "tropical storm", Harvey. Hurricane caused damage to oil refineries located in this part of the US, leading to their closure. Nearly 30% of the country's oil refining facilities are located on the Texas coast. Also, several offshore oil and gas platforms in the Gulf of Mexico were closed, accounting for about 22% of offshore oil production in the Gulf. Their closure will negatively affect oil demand in the US, and will also affect world oil prices. According to experts of the oil market, the negative impact of the consequences of the storm can drag on for several weeks, because it will take time to restart the refinery. Even yesterday, futures for Brent crude on ICE Futures fell 1.3% to 51.74 dollars per barrel. Today, oil prices continued to decline. The spot price for Brent crude at the beginning of today's European session was close to $ 51.00 per barrel.
Wednesday (14:30 GMT) will publish weekly data of the Ministry of Energy on oil reserves in the US. Decrease in demand from the refinery will probably cause an increase in inventories, since oil produced earlier and domestically is not being processed.
This can cause pressure on oil prices. Also today, it is worth paying attention to the weekly published data at 20:30 (GMT) on oil reserves from the American Petroleum Institute, which largely correlates with official data from the US Energy Ministry.
*)An advanced fundamental analysis is available on the Tifia Forex Broker website at tifia.com/analytics
Support and resistance levels
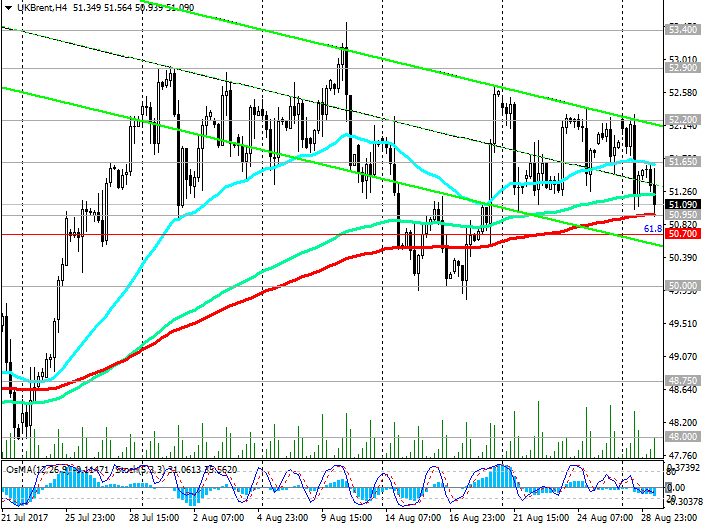
The price of Brent oil broke through the short-term support level of 51.65 (EMA50 on the 4-hour chart, EMA200 on the 1-hour chart) and found support today at 50.95 (EMA200 on the 4-hour chart, EMA144 on the daily chart, EMA50 on the weekly chart). Short-term negative dynamics prevails. In case of breakdown of the support levels of 50.95, 50.70 (EMA50 on the weekly chart, as well as the Fibonacci level of 61.8% of the correction to the decline from the level of 65.30 from June 2015 to the absolute minimums of 2016 near the 27.00 mark), the decline may last to the support level of 50.00 (lows August). Further objectives are support levels 48.75, 48.00, 46.20 (50% Fibonacci level), 44.50 (year lows). A more distant goal is the level 41.70 (the Fibonacci level of 38.2% and the lower boundary of the descending channel on the weekly chart), which increases the risks of price return in the bearish trend.
Indicators OsMA and Stochastics on the 4-hour, daily, weekly charts again moved to the side of sellers.
In case of resumption of growth and breakdown of resistance level 52.20, the target will be 52.90 (EMA144 on the weekly chart), 53.40 (August highs), 54.70 (EMA200 on the weekly chart and the upper bound of the rising channel on the daily chart).
Support levels: 50.95, 50.70, 50.00, 48.75, 48.00, 47.70, 46.20, 45.50, 44.50, 41.70
Levels of resistance: 51.65, 52.20, 52.90, 53.40, 54.00, 54.70
Trading Scenarios
Sell by the market. Stop-Loss 51.70. Take-Profit 50.90, 50.70, 50.00, 48.75, 48.00, 47.70, 46.20
Buy Stop 51.70. Stop-Loss 50.80. Take-Profit 52.00, 52.20, 52.90, 53.40, 54.00, 54.75
*) For up-to-date and detailed analytics and news on the forex market visit Tifia Forex Broker website tifia.com


")
