
AUD/USD: Against the background of weak macro data from China

After extremely volatile trading, the Australian dollar fell sharply during the Asian session today. After the release of optimistic data on retail sales in Australia in April (+ 1.0% vs. the forecast + 0.3%), the Australian currency strengthened. This is the largest monthly increase in more than two and a half years. However, soon the Australian dollar fell sharply after China's production report, which turned out to be weak, was published. The index of supply managers (PMI) for China's manufacturing sector from Caixin Media Co. In May, it fell to 49.6 (against 50.3 in April).
China is Australia's largest trade and economic partner and a consumer of Australian iron ore and coal. The growth of the Australian economy still depends heavily on the commodity sector. And the decline in commodity prices, as well as the slowdown in the economy of the Australian partner countries, have a strong impact on the Australian dollar, undervaluing its value.
At the same time, despite the unexpected growth in retail sales in April, other statistics still indicate a limited increase in consumer spending. Domestic consumption makes a big contribution to GDP growth. In view of the weak growth in consumption in Australia, some economists forecast zero or insignificant GDP growth for the first quarter.
The consumer confidence index is weak, salaries are growing slowly, and purchasing power is limited. House prices also began to decline, which unleashes the hands of the RBA in the matter of lowering the interest rate.
Earlier this month, the RBA retained its interest rate in Australia at 1.5%. However, the RBA can go on reducing the interest rate in the country due to record household debt, a record low salary growth and a weak labor market.
At the same time, the US dollar is showing growth today in the foreign exchange market.
Despite the problems that have arisen with the administration of the US President in implementing the plans for a new economic policy, investors focus on positive macro statistics coming from the United States.
President of the Fed-San Francisco and FOMC member John Williams today expressed confidence that the strengthening of the US economy justifies "three or four rate hikes" this year.
Thus, the difference between the monetary policy of the Fed and the RBA is the main driver for reducing the pair AUD / USD.
Today we are waiting for data from the USA. Between 12:15 and 14:00 (GMT) a whole block of important macroeconomic indicators is published. Among the data - the index of business activity ISM in the manufacturing sector (in May) and the index of gradual acceleration of inflation. We expect weaker indicators than in the previous month, which could negatively affect the dollar. Nevertheless, in absolute terms, the figures look very positive. Also worth paying attention to the report of ADP on the level of employment in the private sector of the US for May. Investors often consider it a harbinger of the NFP, although no direct correlation with Non-Farm Payrolls is usually noted. Strong data positively affects the dollar. Here the growth is expected (185,000 versus 177,000 in April), which will support the US dollar. In general, macro statistics are expected to be very positive, which will have a positive impact on the US dollar, including in the pair AUD / USD.
Support and resistance levels
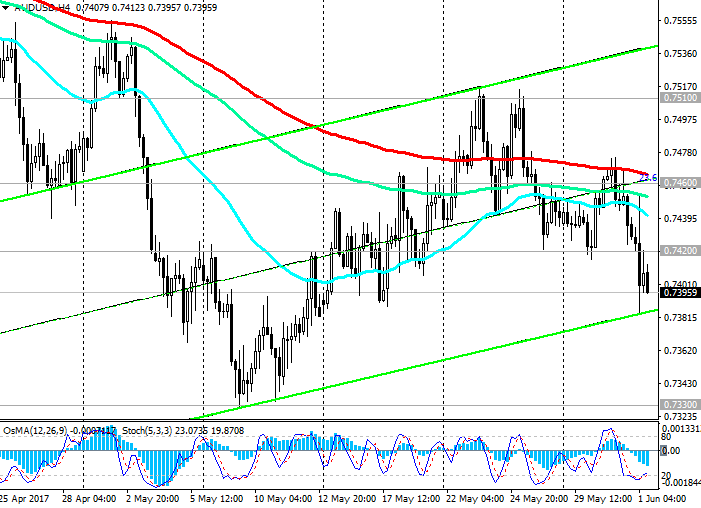
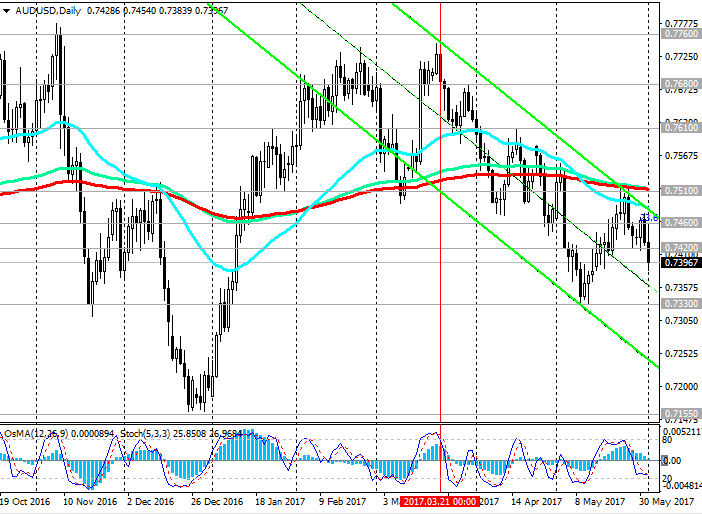
Since mid-March, the AUD / USD pair is actively declining in the downlink on the daily chart. The pair AUD / USD is below the important resistance levels 0.7510 (EMA200 on the daily chart), 0.7460 (Fibonacci level of 23.6% correction to the wave of decline of the pair since July 2014, as well as the upper limit of the descending channel on the daily chart, EMA200 on the 4-hour Chart).
The negative dynamics prevails.
Indicators OsMA and Stochastics on the 1-hour, 4-hour, daily charts went to the side of sellers.
The closest target in case of further decline of the pair will be the level of 0.7330 (November, May minima and the bottom line of the rising channel on the weekly chart). The next target in case of breakdown of this support level is the level of 0.7155 (May, December minima of 2016). The minimum wave of the last global decline of the pair since July 2014 is close to the level of 0.6830.
The alternative scenario is related to the return of the pair AUD / USD to the zone above the level of 0.7510 and further growth to the resistance levels of 0.7610, 0.7680, 0.7760, 0.7840 (Fibonacci retracement of 38.2% correction to the fall wave from July 2014).
Fundamental factors create the prerequisites for further reduction of the AUD / USD pair.
Support levels: 0.7380, 0.7330, 0.7300, 0.7200, 0.7155
Resistance levels: 0.7420, 0.7460, 0.7510, 0.7545, 0.7570, 0.7610, 0.7680
Trading scenarios
Sell Stop 0.7380. Stop-Loss 0.7420. Take-Profit 0.7330, 0.7300, 0.7200, 0.7155
Buy Stop 0.7420. Stop-Loss 0.7380. Take-Profit 0.7460, 0.7510, 0.7535, 0.7545, 0.7570, 0.7600
*) Actual and detailed analytics can be found on the Tifia website at tifia.com/analytics


