

World and, above all, American stock markets are recovering after a serious fall two days ago. The fall of the dollar and US stock indices on Wednesday was caused by reports in the media that Trump allegedly asked former FBI director James Komi, who was dismissed from his post a few days earlier, to stop the investigation against Michael Flynn, who previously held the position of adviser President for national security. The news came after reports that Trump handed classified information to Russian authorities, which could harm the US national security. Against this background, talk of possible impeachment of Trump increased.
Nevertheless, since yesterday, there has been a recovery of the dollar and US indices. Yesterday, US Treasury Secretary Stephen Mnuchin and the president of the Federal Reserve Bank of Cleveland, Loretta Mester, hastened to reassure investors.
Stephen Mnuchin said that "President Trump is determined to carry out the tax reform as quickly as possible". Loretta Mester, who is also a member of the FOMC of the Fed, gave a positive assessment to the US economy and said that the central bank will continue to raise interest rates to "avoid increasing risks to macroeconomic stability that may arise if the economy overheats".
The dollar and US indices received yesterday also support from published data on the number of applications for unemployment benefits in the US, which declined for the third consecutive week, indicating a steady increase in the number of jobs. The index of business activity for May, published by the Fed-Philadelphia, significantly exceeded the expectations of economists, which also gave confidence to investors (38.8 against the forecast of 19.5 and 22.0 in April).
Today, the economic calendar for the United States is empty; however, it is worth paying attention to the speech of FOMC member and head of the Federal Reserve Bank of St. Louis James Bullard (starts at 13:15 GMT). It is likely that Bullard, also following Mester, will point to a high probability of an early interest rate increase in the United States. The next meeting of the Federal Reserve on this issue will be held on June 13-14, and many investors are already laying a price hike on prices in this meeting.
According to the CME Group, the probability of an increase in rates next month is again estimated at 74%. On the one hand, the probability of an early increase in the interest rate is holding back from more active purchases on the American stock market, raising the rate makes the dollar more expensive. On the other hand, as the head of the Federal Reserve, Janet Yellen, pointed out more often, the rate increase speaks about the strength of the American economy, and this is a positive factor for the dollar and the US stock market, which, nevertheless, is dominated by positive dynamics.
Support and resistance levels
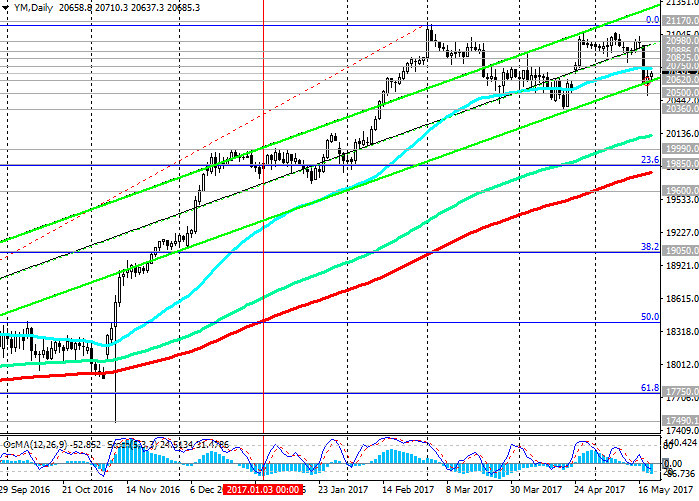
As a result of the recent fall, the DJIA index has lost all the achievements of recent weeks, falling below the opening level of the previous month near the mark 20650.0. The DJIA index broke through the support level of 20620.0 (the bottom line of the ascending channel on the daily chart), falling to the level of 20500.0.
With the opening of today's trading day and the beginning of the European session, the DJIA index continues to recover, once again returning to the upward channel on the daily chart, the upper limit of which passes above the level of 21170.0 (absolute and annual highs).
To confirm the upward dynamics, the DJIA index needs to gain a foothold above the level 20825.0 (EMA200 on the 4-hour and 1-hour charts).
The indicators OsMA and Stochastics on the 1-hour and 4-hour charts turned to long positions.
Positive dynamics of the index can fully recover already above the level of 20820.0. Long positions can be opened already in the zone above the resistance level 20750.0 (EMA50 on the daily chart).
In an alternative scenario, the index should drop below the local and May low near the 20500.0 mark
If the downward trend is to increase, the decline in the index may continue to support levels of 20360.0 (April lows), 19990.0 (December highs), 19850.0 (EMA200 on the daily chart and Fibonacci level of 23.6% correction to the wave growth from the level of 15660.0 after recovery In February of this year to the collapse of the markets since the beginning of the year. The maximum of this wave and the Fibonacci level of 0% is near the mark of 21170.0).
The change in the bullish trend for the bearish will occur only after the DJIA index falls below the level of 19850.0. So far, the bullish trend prevails.
Support levels: 20620.0. 20500.0, 20360.0, 20110.0, 19990.0, 19850.0
Resistance levels: 20750.0, 20820.0, 20885.0, 20980.0, 21170.0

Trading Scenarios
Buy in the market. Stop-Loss 20610.0. Take-Profit 20750.0, 20820.0, 20885.0, 20980.0, 21170.0
Sell Stop 20610.0. Stop-Loss 20760.0. Take-Profit 20500.0, 20360.0, 20110.0, 19990.0, 19850.0
*) Actual and detailed analytics can be found on the Tifia website at tifia.com/analytics


")
 & AMD Framework")