Trading recommendations
Sell Stop 2364.0. Stop-Loss 2378.0. Objectives 2330.0, 2300.0, 2275.0, 2213.0, 2200.0, 2180.0
Buy Stop 2378.0. Stop-Loss 2364.0. Objectives 2390.0, 2400.0
Overview and dynamics
As the Organization for Economic Cooperation and Development (OECD) reported today, a sharp increase in recent quotations of the US stock market do not match the expected rate of economic growth, which is a threat to the recovery of the global economy.
Thus, the Dow Jones Industrial Average index has increased by more than 23% over the past 12 months, with almost half of this growth occurring in the last three months. At the same time, the past year, according to the OECD, "has become a disappointment for the US and the world economy." In 2017, the OECD also does not build a more optimistic forecast regarding the state of the global economy.
In OECD believe that "the dynamics of the stock markets has no real reason", and "at some point, there will be a drop in quotations." According to OECD experts, this fall can be quite sharp and profound.
Signs of the fact that the deterioration of the economic situation is coming may become actively rising prices for housing, especially in Australia, Canada, Sweden and the UK.
At the same time, financial markets are still dominated by euphoric sentiment amid the fact that investors are confident that the increase in rates is due to economic growth in the US.
Economists positively assess the prospects for the US economy, and many market participants believe that the possibility of tax cuts and fiscal stimulus will continue to support equity markets, and their profitability can grow.
On Friday at 16:30 (GMT + 3) will be published a report on the US labor market for February. It is expected to increase jobs by 190,000 and reduce unemployment by 0.1% (to 4.7%).
This will be the last important macro statistics before the March meeting of the Fed. At the same time, most market participants expect that the Fed will raise interest rates, unless the employment report turns out to be very bad.
In general, the positive background for stock indices remains. And, probably, next week the growth of US indices can resume, of course, if the report on the US labor market does not become a complete disappointment.
Support and resistance levels
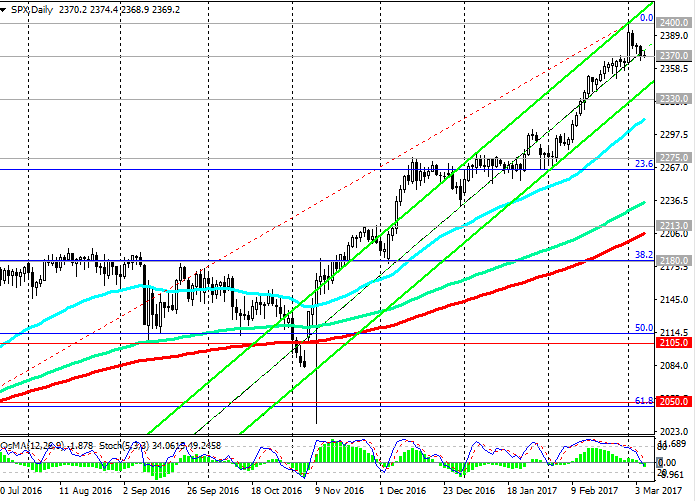
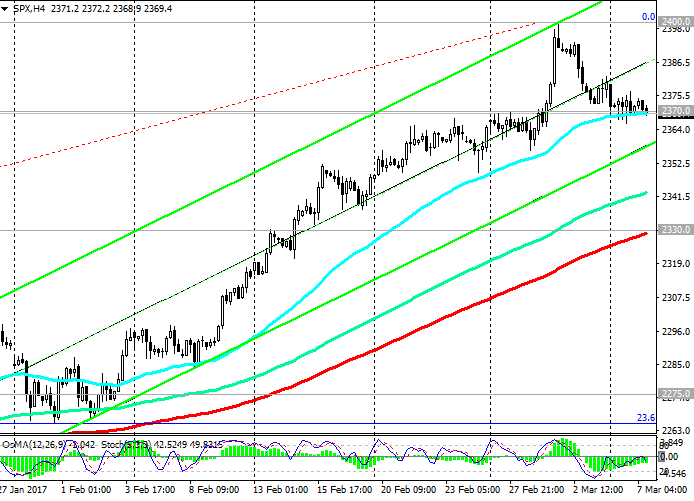
In February, the S & P500 index continued its growth, breaking through the local resistance level of 2275.0 (the December and recent highs achieved in the wave of growth in the S & P500 index since February 2016). In early March, the index updated a maximum near the mark of 2400.0, setting a new absolute record after the election of a new president in the United States. However, for the fourth consecutive session, the index loses its positive potential.
Today, the S & P500 index is trading in a narrow range near the mark of 2370.0 and the support level (EMA50 on the 4-hour chart and EMA200 on the 1-hour chart). Activity trading in financial markets is low.
Indicators OsMA and Stochastics on the 4-hour and daily charts are deployed to short positions, signaling a downward correction.
Nevertheless, breakdown of the level of 2370.0 is unlikely. Scenario for reduction can be seriously considered only in case of a return below the level of 2330.0 (EMA200 on the 4-hour chart). Breakdown of this level of support will increase the risk of further decline in the index to 2275.0, 2213.0 (EMA200 on the daily chart and November highs). The breakdown of the support level 2180.0 (the Fibonacci retracement level of 38.2% in the wave of growth of the S & P500 index from February 2016 to the level of 2400.0) will cancel the bullish trend of the index.
Nevertheless, the positive dynamics of the S & P500 index remains. Despite overbought, the growth of the index, apparently, will continue. For now, only long positions should be considered, but after the completion of the downward correction.
Support levels: 2370.0, 2330.0, 2300.0, 2275.0, 2213.0, 2200.0, 2180.0
Resistance levels: 2400.0
https://www.mql5.com/en/signals/author/edayprofit
*)presented material expresses the personal views of the author and is not a direct guide to conduct trading operations.